The genetic diversity and population genetic structure of thread-sail filefish, Stephanolepis cirrhifer (Temminck & Schlegel), were examined with a nucleotide sequence analysis of a 495bp fragment of the 5′-end of the cytochrome b gene in 113 fish collected from five populations from the south and east coasts of the Korean Peninsula. Seventeen variable nucleotide sites and 16 haplotypes were defined. The observed haplotypes had a shallow haplotype genealogy and no geographical association. Most of the populations had high haplotype diversity and low nucleotide diversity, and significant negative values for Fu’s FS, suggesting rapid, recent population growth from an ancestral population and sudden population expansion. The estimated pairwise fixation indices (FST) indicate that substantial gene flow occurs among these populations.Thread-sail filefish in the South Sea of Korea and East Sea Korean populations forms a single panmictic population. Thus, thread-sail filefish in these areas should be treated as one management unit.
Thread-sail filefish
Genetic variation is important for the long-term survival of natural populations because it confers the ability to adapt to environmental changes, thereby increasing the fitness of the population (Frankel and Soule 1981). Indeed, the structure of fish populations has attracted considerable interest because of its importance for the management of fisheries (Bailey,1997; Zhang et al., 2006). The estimation of population genetic structure using molecular markers is now commonly used to understand the dynamics of natural populations, especially resource recovery, and to monitor populations for fisheries management and conservation purposes. The population genetic structures of marine fishes are influenced by their larval behavior and dispersal patterns, which are determined by oceanographic features, such as sea currents, hydrological conditions, and physical barriers (Doyle et al., 1993; Umino et al., 2009; Hsieh et al., 2010; Kim et al., 2010). Most marine species have limited intraspecific population structures and high levels of gene flow influenced by sea currents(Palumbi, 1994; Sekino and Hara, 2001; Kochzius and Blohm, 2005; Song et al., 2010). However, little is known about the genetic structure of
Nucleotide sequence information from maternally inherited mitochondria DNA (mtDNA) genes is useful for investigating inter- and intraspecific genetic variation among closely related taxa, species,or regional populations (Moritz et al., 1987: Avise,1994). The cytochrome
This study examined the genetic variation and population structure of

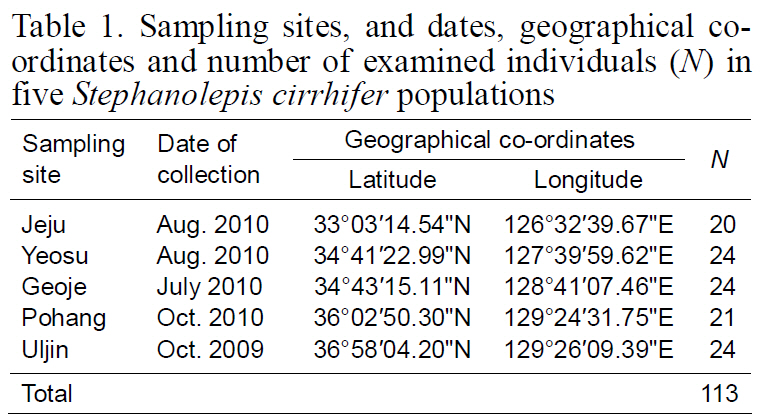
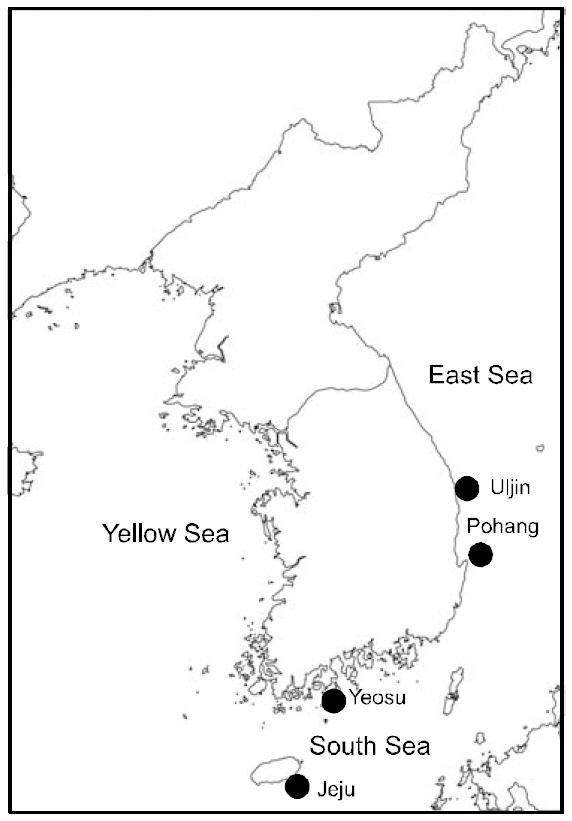
Sampling sites and dates geographical coordinates and number of examined individuals (N) in five Stephanolepis cirrhifer populations
>
Nucleotide sequence analysis
The polymerase chain reaction (PCR) was used to amplify the mtDNA
and 2 μL of 10× LA Taq reaction buffer (TaKaRa Shuzo). PCR conditions consisted of preheating at 94°C for 5 min, followed by 35 cycles of 94°C for 30 s, 55°C for 30 s, and 72°C for 30 s, with a final 5 min extension at 72°C. Size of the PCR product was verified by 1.5% agarose gel electrophoresis after ethidium bromide staining. The PCR product was purified with the AccuPrep PCR Purification Kit(Bioneer, Daejeon, Korea). After cycle sequencing with the ABI PRISM BigDye Terminator v3.1 Cycle Sequencing Ready Reaction Kit (Applied Biosystems,Foster City, CA, USA), the purified PCR product was sequenced directly on an ABI 3730xl DNA Analyzer(Applied Biosystems) with the same primers.
Sequence data were aligned using DnaSP (ver.4.90.1; Rozas and Rozas, 1997) to examine the haplotypes of the
Pairwise population FST values were calculated to estimate the genetic differentiation between populations, according to Slatkin and Hudson (1991), using the program Arlequin (ver. 3.1; Excoffier et al., 2005).The significance of each FST value was tested using 10,000 random permutations. Analysis of molecular variance (AMOVA) was used to test for population structure with Arlequin (ver. 3.1). Neutral expectation and historic demographic expansions were investigated by examining Fu’s FS and Tajima’s
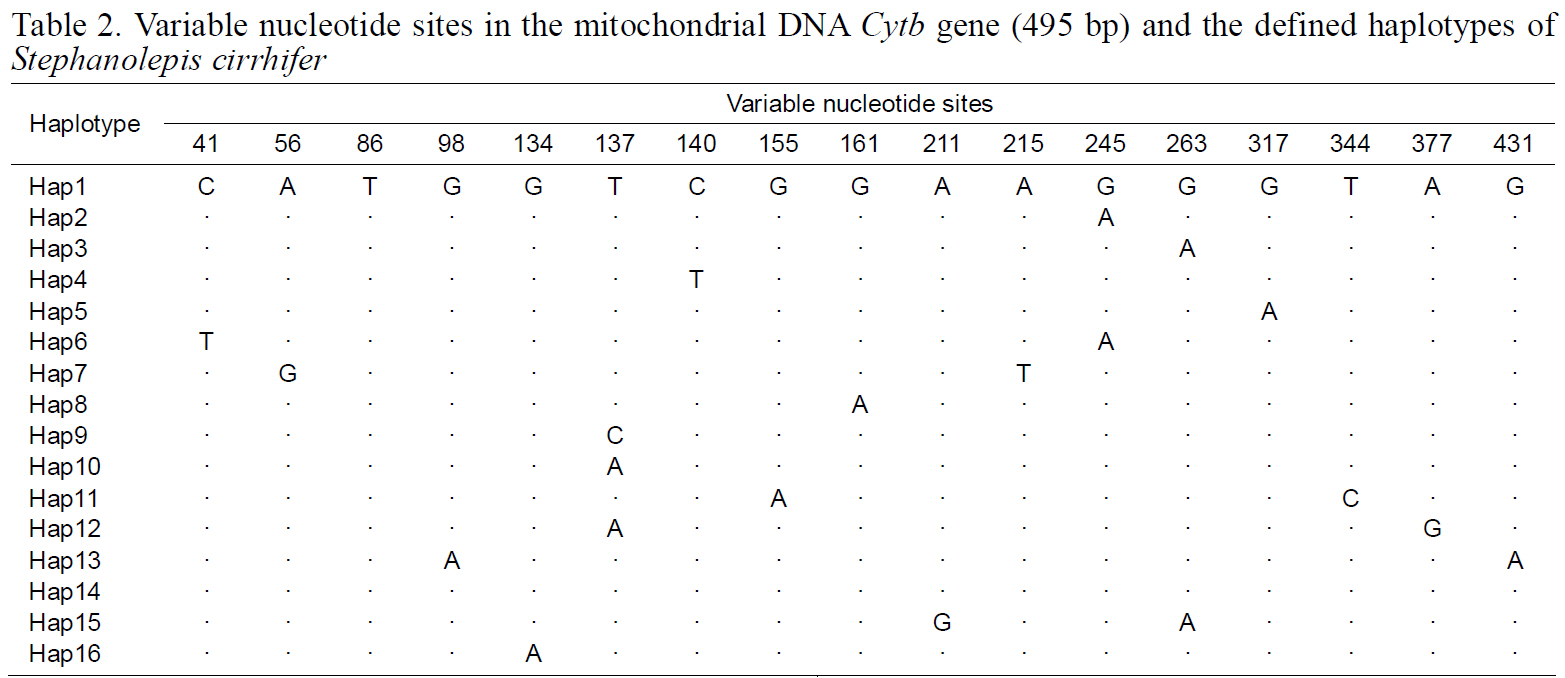
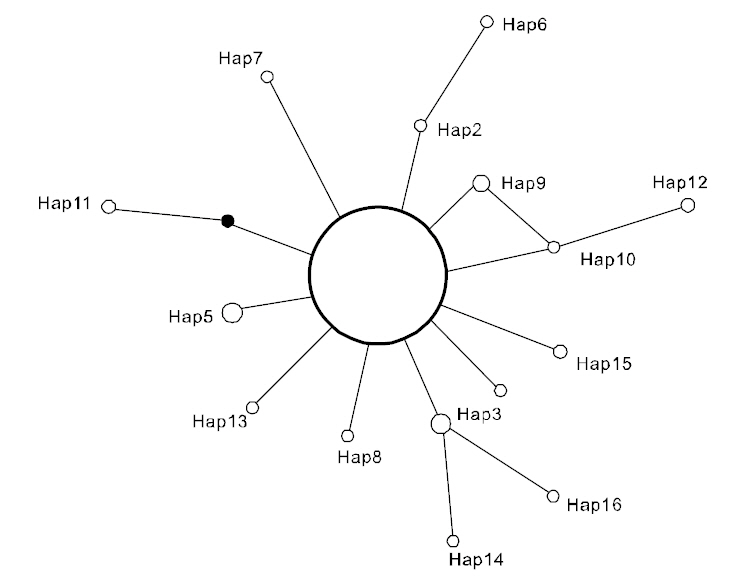
Sequence analysis of a 495-bp fragment of the 5′-end of the

Variable nucleotide sites in the mitochondrial DNA Cytb gene (495 bp) and the defined haplotypes of Stephanolepis cirrhifer
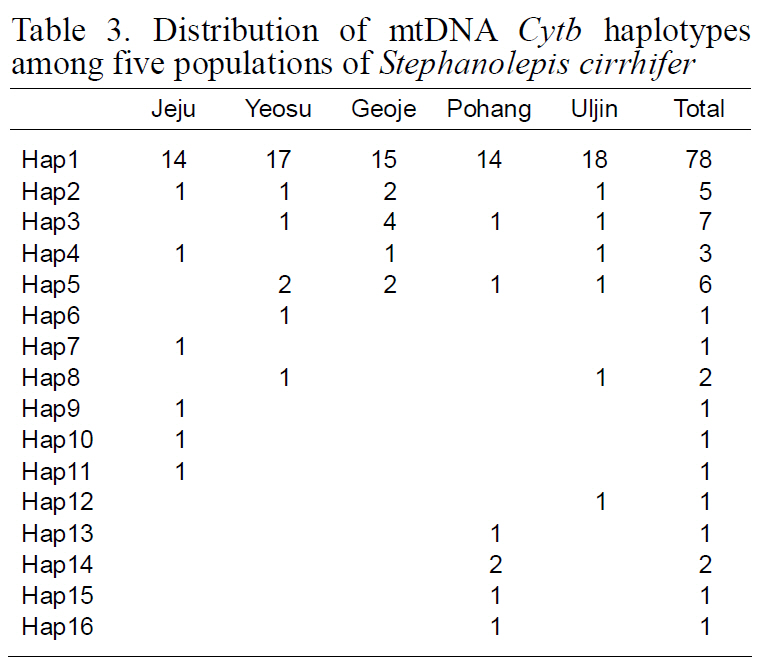
(Table 3), suggesting that the observed haplotypes did not provide evidence of geographical association.The haplotype and nucleotide diversities are shown in Table 4. The average haplotype diversity was 0.517 and the average nucleotide diversity was 0.00153,indicating that the
Fixation indices, based on mitochondrial haplotypes,showed no significant genetic differentiation between any population pair (Table 5), perhaps as a result of the high gene flow. Results of AMOVA were also not significant for the South Sea or East Sea Korean populations, suggesting that no population structure existed throughout the examined range of
[Table 3.] Distribution of mtDNA Cytb haplotypes among five populations of Stephanolepis cirrhifer

Distribution of mtDNA Cytb haplotypes among five populations of Stephanolepis cirrhifer
tinuously to high rates of gene flow from southern sources. The population structure of many marine
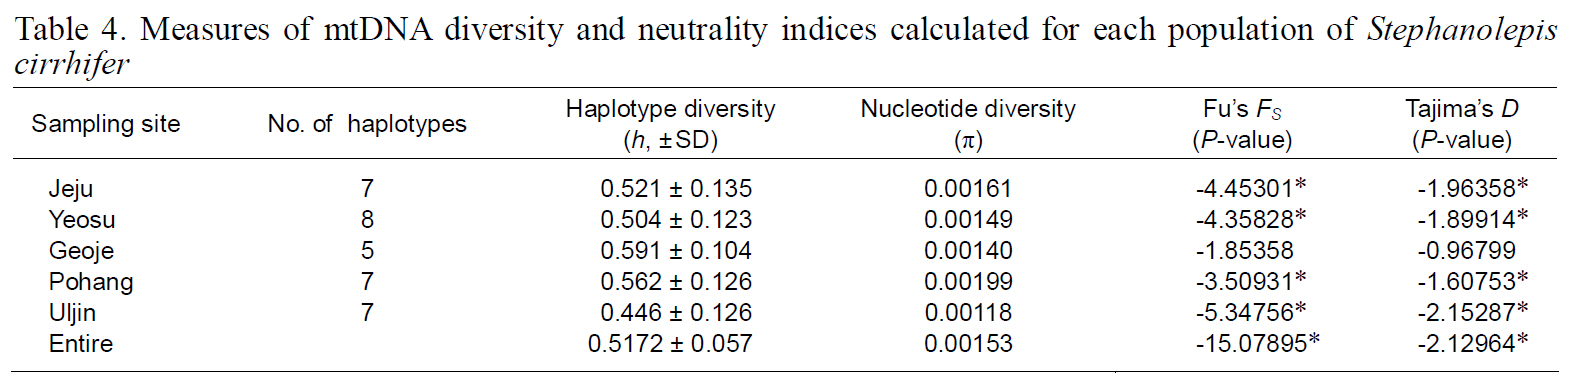
Measures of mtDNA diversity and neutrality indices calculated for each population of Stephanolepis cirrhifer
fishes often depends on the active migration of adults and passive dispersal of larvae (Waples, 1998;Cowen et al., 2000, 2003). The major current along the Korean coast is the Tsushima Warm Current(TWC), which branches off the Kuroshio Current in the East China Sea, with part of the TWC running into the Yellow Sea and the main part entering the East Sea along the Korean Peninsula (Senjyu, 1999;Ichikawa and Beardsley, 2002). Thus, our results suggest that the TWC transports
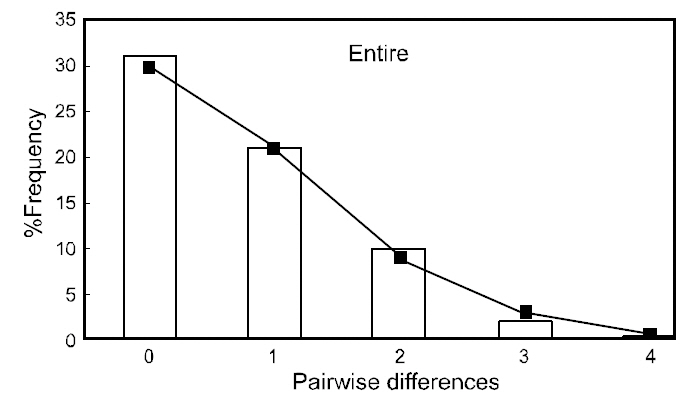
Neutrality indices calculated for each population and the entire sample are shown in Table 4. With both tests used (Fu’s FS and Tajima’s
Our study suggests that the migration and reproductive behavior of
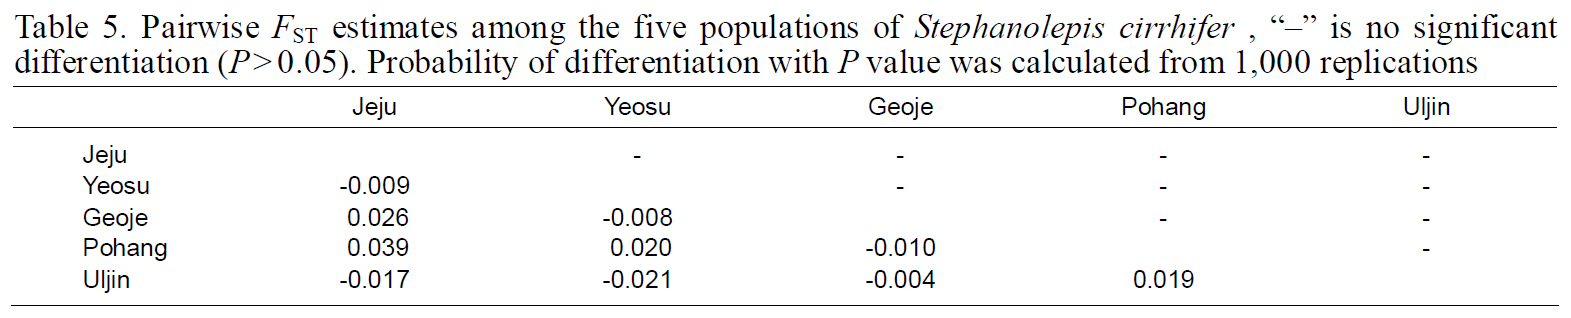
Pairwise FST estimates among the five populations of Stephanolepis cirrhifer “?” is no significant differentiation (P>0.05). Probability of differentiation with P value was calculated from 1000 replications
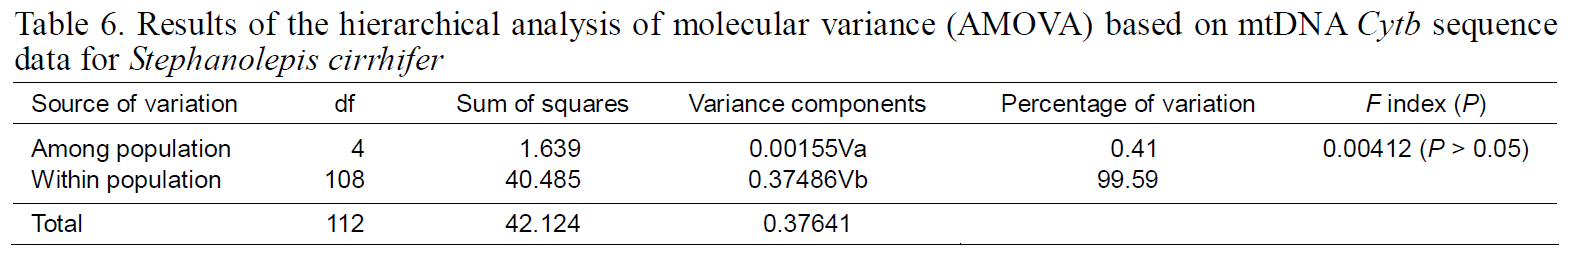
Results of the hierarchical analysis of molecular variance (AMOVA) based on mtDNA Cytb sequence data for Stephanolepis cirrhifer