RR Lyr pulsating variables belong to a stellar group with short periods ranging from ~0.d3 to 1.d0 and pulsation amplitudes smaller than about 2 mag in the V band.They are low mass central He burning Pop II stars, located in the Hertzsprung-Russell diagram on the horizontal branch evolutionary phase with an absolute magnitude in the V band ranging from ~0 to ~1 mag. There are two main subgroups: RRab, which oscillates in the fundamental mode, and RRc, which pulsates in the first overtone mode. The RRc stars have shorter periods, smaller amplitudes, and more symmetric light curves than the RRab stars. Both the light curves and the pulsation periods of RRc stars vary in time. The former is known as the Blazhko effect, and the latter is known to vary in diverse patterns such as secular, sinusoidal, or erratic changes.
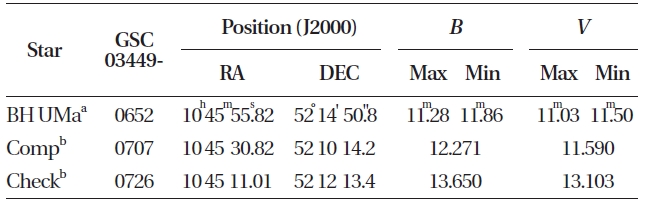
BH UMa (BV 36, CSV 6796, GSC 03449-00652), which was discovered as a variable star by von Geyer in 1955(Meinunger 1965), has been known for a long time as a W UMa eclipsing binary star with a period of 0.d6987. Gotz& Wenzel (1962) assigned the spectral type of BH UMa to B9. The first photographic light curve was published by Meinunger (1965), who obtained many plate times of minimum and determined a light elements as Min I = HJD 2430496.455 + 0.d698685E. He classified BH UMa as a W UMa binary star from the shape of its light curve. Since Meinunger's study, numerous times of minimum lights have been published (Kreiner et al. 2001). Recently, Krajci (2005) observed the star without any filters and found that it was not a W UMa binary star but an RR Lyr star belonging to the RRc subtype. He determined a light elements as Max I = HJD 2453053.6545 + 0.d349350 E. As far as we know, no filtered light curves have been published.In this paper, we presented the BV light curves of BH UMa confirming the star to be the RRc subtype of RR Lyr stars, and we analyzed all published timings, including ours, to obtain a general understanding of the period behavior.
The BV charge coupled device (CCD) observations of BH UMa were made on 17 nights during March and April 2008 with the 35-cm reflector of campus station of Chungbuk National University Observatory in Korea. An SBIG ST-8 CCD imaging system, which was electrically cooled with a 19' × 12' field of view, and a standard BV filter set were used. GSC 3449-707 and GSC 3449-726 were chosen as the comparison and check stars, respectively. Our
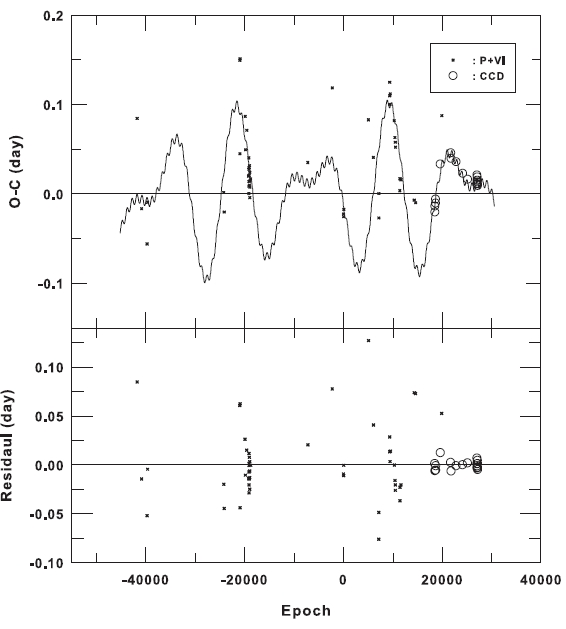
110comparison and check stars were the same ones used by Nelson et al. (2004). The characteristics of the variable, comparison and check stars are listed in Table 1. Fig. 1 shows one of our CCD images in which our program stars are marked with two variable stars discovered by us in this paper (V1) and recently by Nelson et al. (2004) (V2). The camera exposure time ranged between 50 s and 140 s, depending on the quality of the night and the filter response.
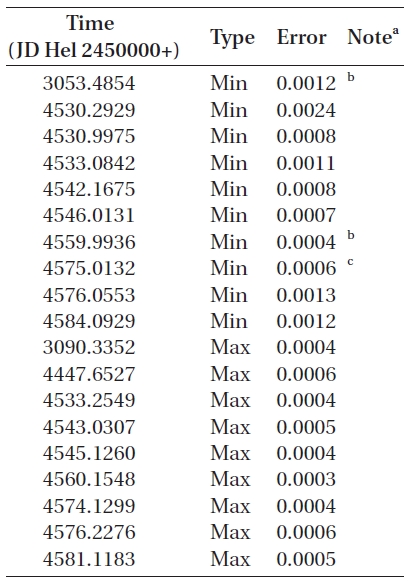
The instrumentation and the reduction method used for the raw CCD frames have been described in detail by Kim et al. (2006). The resulting standard errors of our observations in terms of comparison minus check star were about ±0.m02 in blue and ±0.m01 in yellow. A total of 1,736 individual observations were obtained in two colors (866 in blue and 870 in yellow) and are available at the website1. From our BV observations, nine times of minimum light and eight times of maximum light were obtained by the conventional Kwee & van Woerden (1956) method. Each of these timings, as listed in Table 2, was a weighted-mean of two BV timings defining the same epoch.
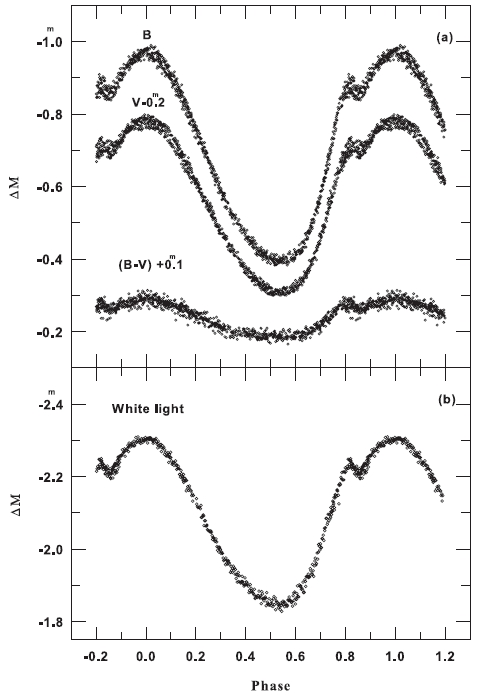
From our observations, the new BV light curves of BH UMa, as shown in the top of Fig. 2, were phased with the new light elements as:
which was determined by a least-square scheme with the times of maximum lights in Table 2. The Krajci’s (2005) white light curve was also drawn in the bottom of Fig. 2, which was phased with his light elements as:
Our light curves and Krajci's light curves are similar, both showing that BH UMa is really an RR Lyr star belonging to the RRc subgroup. Compared with Krajci's light curve, our light curves phased with Eq. (2) show a large phase shift of about 0.p3, which corresponds to about 0.d105 (~2.5 hours). This phase shift may indicate a large period change even in the time interval of about 4.y2 between two observing seasons (see also the periods in Eqs. (1) and (2)). We will discuss this change in more detail in the next section
The light curves in Fig. 2a are slightly asymmetrical
with the descending branch from the maximum (Max) to the minimum (Min) at about 0.p55 taking 4h 32m and with the ascending branch from the Min to the Max taking 3h 48m. The ratio D of the Min-to-Max time to the period is
0.453, a typical value of RRc stars. The variation amplitudes are about 0.m58 in B and 0.m47 in V. A small hump exists between 0.p82 and 0.p86 with the second Max and the second Min. The depths of the hump (the brightness difference between the second Max and the second Min) are about 0.m02 and 0.m01 in the B and V filters, respectively.We also noticed that the ascending branch from the Min to the second Max is steeper than that from the second Min to the Max. The B-V color curve also shows a variation pattern similar to those of the individual BV light curves. The difference of the B-V values between the Max and the Min is about 0.m11. The BV magnitudes of BH UMa measured at several characteristic phases (Max, Min, and Hump) are listed in Table 3. These magnitudes are differential relative to our comparison star (GSC 03449-0707).
Although our observations were not standardized, it would be possible to roughly estimate the BV standard magnitudes of BH UMa because the BV standard magnitudes for the comparison and check stars was given by Nelson et al. (2004), as given in Table 1, and the instrumental magnitudes for the comparison and check stars were measured by us. Our instrumental and standardized Δm (check-comparison) are 1.397 (±0.024) and 1.379 (±0.022) for the B filter and 1.491 (±0.010) and 1.513 (±0.012) for the V filter, respectively. Their differences relative to the standardized magnitude are 0.018 (±0.023) and -0.022 (±0.011) for the B and V filters, respectively. If these constant values are applied to the instrumental and standardized Δm (BH UMa-comparison), then the BV standard magnitudes for BH UMa could be estimated as those given in the first row of Table 1, which should be tentative magnitudes.
1http://binary.chungbuk.ac.kr/bbs/zboard.php?id=lab_photometry
In general, the period changes of variable stars have been investigated with their (O-C) diagrams where the abscissa is usually time or cycle counted with an adopted ephemeris and where the ordinate is the difference between the observed times (O) of a particular phase
(e.g., the maximum, minimum, or the mid-point on the ascending branch of the light curve) and the predicted time of the same phase (C), calculated according to the same ephemeris. In recent years, another method has often been used where the (O-C) data are calculated as the time shift between the entire observed light curve and the normal light curve, rather than from one specific phase. This method is known to produce more stable results for period change investigation (Szeidel et al. 2011).
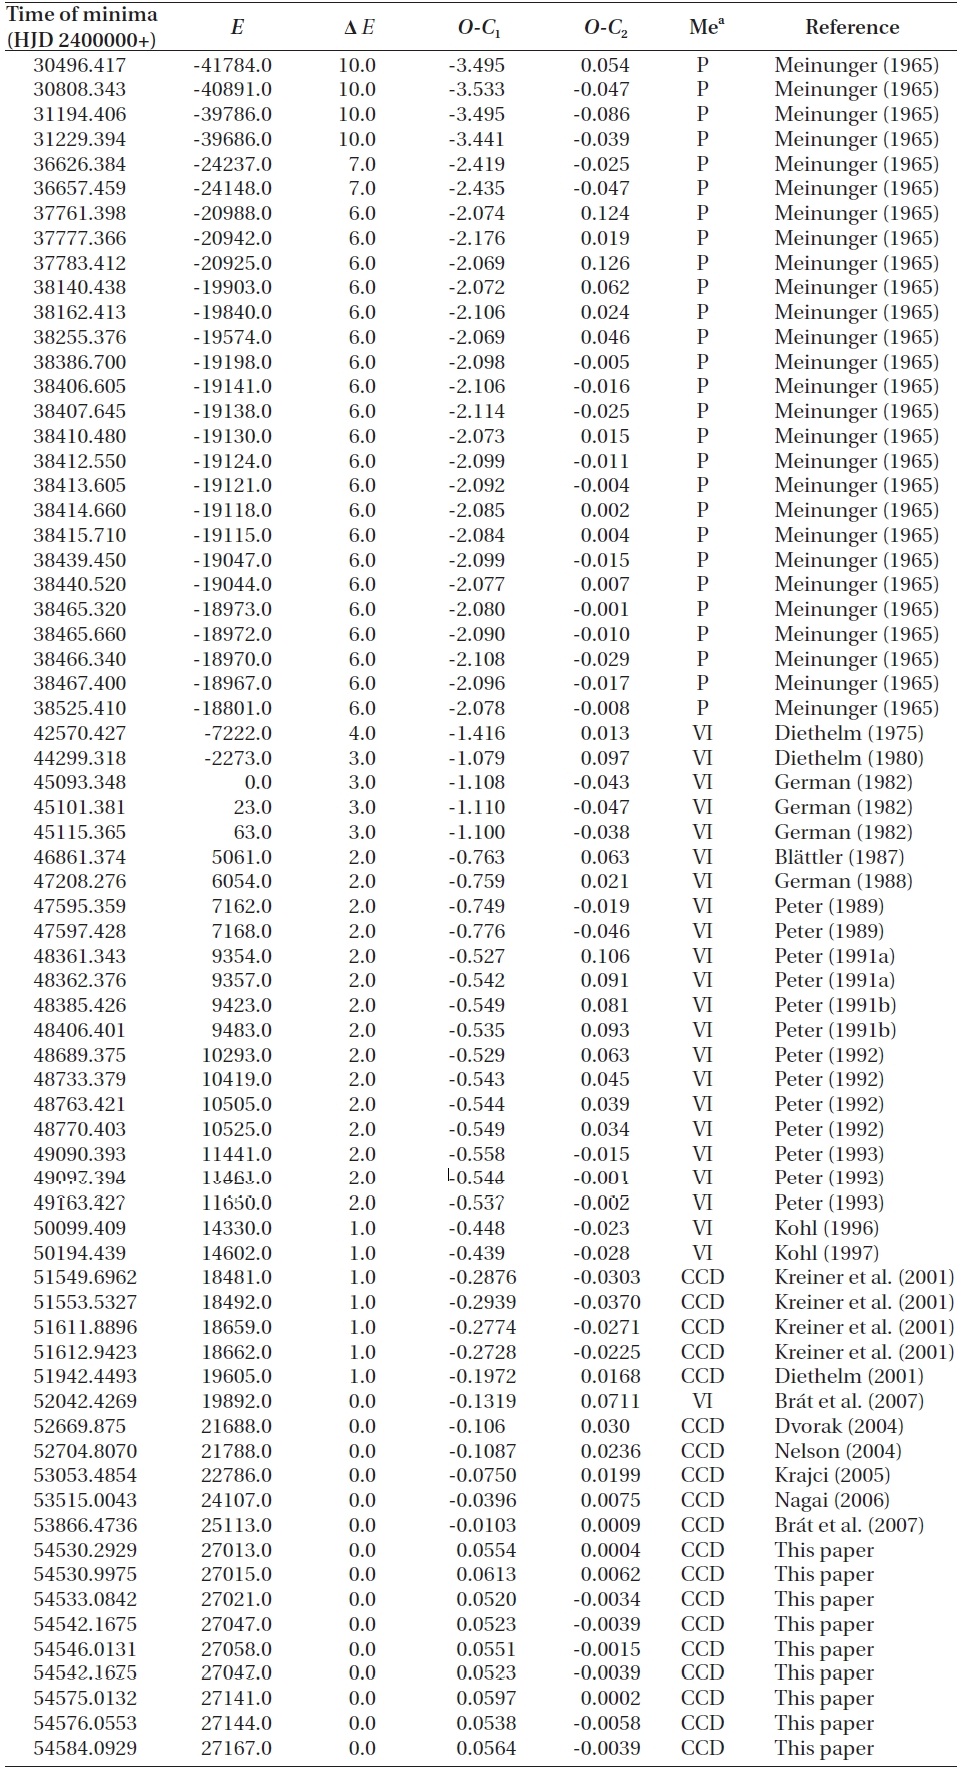
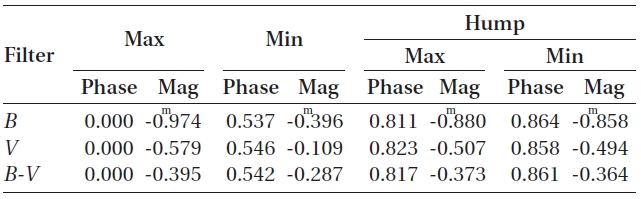
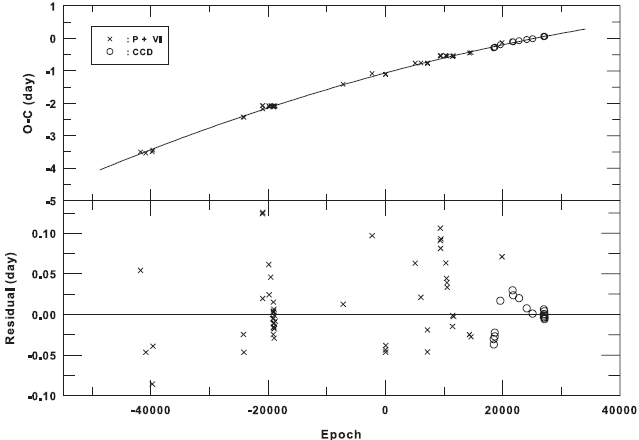
To investigate the period variation of BH UMa, we used the times of minimum light instead of those of maximum light because only nine maximum light timings were distributed locally in a short time interval of about 4 years, while the minimum light timings are numerous and widespread over 66 years. A total of 69 (22 visual, 27 sky patrol, and 20 CCD) times of minimum light, including ours in Table 2, have been collected from a modern database (Kreiner et al. 2001) and from the recent literature. These timings are listed in Table 4 where one time of HJD2453053.4854 was determined by us from the Krajci's (2005) observations.
The (O-C) residuals of all timings in Table 4 were calculated with the following linear ephemeris:

The ephemeris was adopted from the o-c gateway2 managed by the Czech Astronomical Society. The (O-C) diagram is shown in Fig. 3 where crosses and open circles represent non-CCD and CCD minima, respectively. The three groups of (O-C) residuals during the early, mid-, and late 1990s (denoted as (a), (b) and (c) in Fig. 3, respectively) show dramatic jumps (or discontinuities)when compared with the neighboring residuals, which indicates the occurrence of a 'cycle slip' effect (or cycle-count uncertainties) rather than a series of a sudden real change during the time interval. The cycle slip effects may occur frequently in the O-C diagrams of RR Lyrae variables (Szeidl et al. 2011), cataclysmic variables (Kim et al. 2005, Andronov et al. 2006), and some eclipsing variables (Kang et al. 2004), showing very fast period changes in a short time interval. This effect could be solved by properly adjusting the cycles (Kim et al. 2005). Thus, the (O-C) values (plotted in red) for the timings corresponding to such jumping residuals were recalculated with Eq. (3) by adding one cycle to their cycle numbers. After adding one cycle, the residuals for group (a) are still discontinuous from the neighboring residuals, while the residuals for groups (b) and (c) show beautiful continuity with those measured since 2000. After adding two cycles, the (O-C) values of the timings of group (a) were recalculated with the same equation and were plotted in blue in Fig. 3, showing that the discontinuity has disappeared.
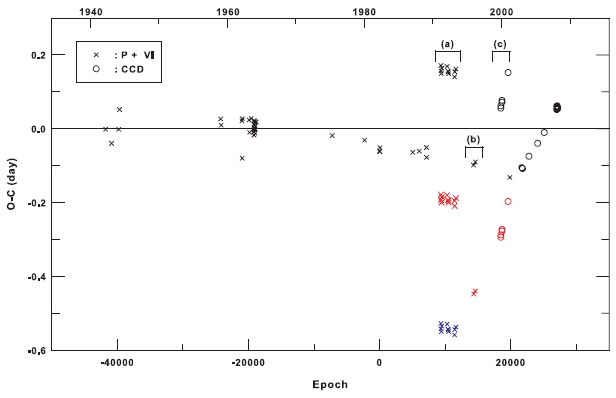
This procedure was applied to all of the timings prior to 1990y to form continuous (O-C) residuals with their neighboring ones. The resultant (O-C) residuals were shown in the upper panel of Fig. 4 and were listed in the fourth column of Table 4. In the calculation, the cycle correction for each timing was made with the cycle slip number (ΔE) given in the third column of Table 4. The diagram shows a clear long-term parabolic trend with small disturbances. A least-square fit of the trend to a quadratic
ephemeris was made to find the following ephemeris:
where the parenthesized value to the right of each term is its standard error. In this and subsequent calculations, the weight of the CCD minima was given ten times that of each of the non-CCD minima, according to the ratio of the inversely squared values of each scatter for non-CCD and CCD minima. The continuous line in Fig. 4, which fits quite well to the residuals, was drawn by using the quadratic term in Eq. (4). The secular period decreasing rate was deduced as -0.58 s/century from the quadratic coef-
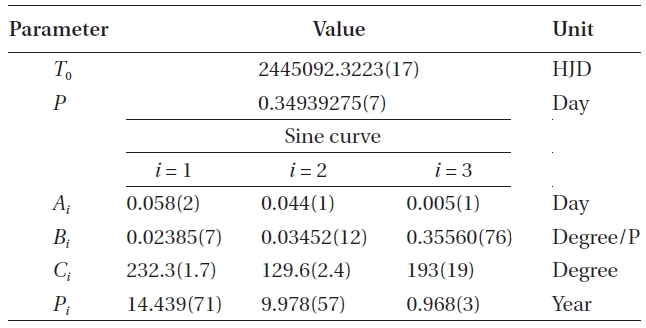
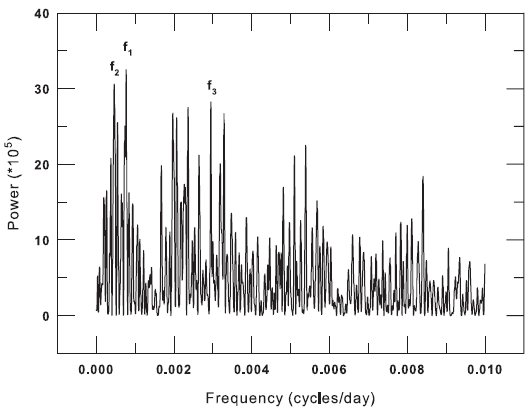
ficient. In the bottom panel of Fig. 4, there were plotted the residuals from Eq. (4) which show large short-term changes of period, especially in the recent CCD minima. The residuals for non-CCD minima seemed to have large scatters, but a careful investigation suggests that the scatters could result from very fast period changes in a short-time interval (several years). Therefore, period searches for all the residuals in the bottom panel of Fig. 4 were made with the Lomb-Scargle periodogram (Lomb 1976, Scargle 1982). The resulting power spectrum shown in Fig. 5 reveals at least three meaningful peaks at f1 = 0.000772 cycle/d, f2 = 0.000465 cycle/d, and f3=0.002949 cycle/d in the order of their powers, corresponding to 3.y56, 5.y95, and 0.y93, respectively. These three periodicities were then compared with three independent sine curves; namely, all of the residuals were fitted to the ephemeris with three sine functions as follows:
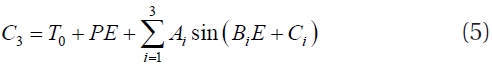
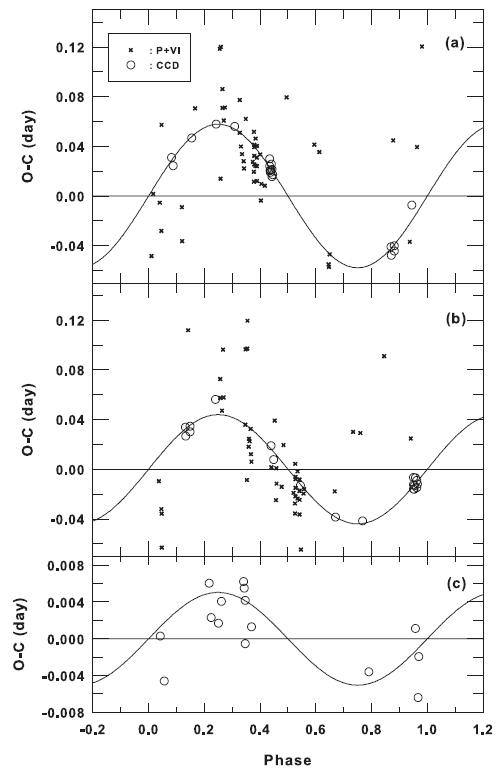
where Ai, Bi, and Ci are the semi-amplitude, angular speed (=2π /Pi ), and initial phase of each sine curve, respectively.The eleven fitting parameters in Eq. (5) were iteratively searched for using the Levenberg-Maquardt method (Press et al. 1992). The three periods obtained with the above periodogram analysis were used as the initial parameters for Bi. The initial parameters for Ai and Ci were estimated from Fig. 4. The final solution converged quickly,and the results are listed in Table 5, wherein the parenthesized values give the standard deviations of the tabulated quantities. Fig. 6 shows our final solution, where the top panel shows the cyclical components of the fitting to the residuals and where the lower panel gives the residuals from all terms in Eq. (5). Interestingly, the two longer periods among the three periods in Table 5 were quite different from those by the periodogram analysis while the shortest ones were consistent with each other. The ratios of the two longer periods (P1 and P2) relative to the
shorter one (P3 = 0.y968) are 14.92 and 10.31; no commensurability between them was found. From top to bottom in Fig. 7, three different (O-C) diagrams were phased with the three periods of 14.y41, 9.y98, and 0.y97, respectively. As seen in the figure, the residuals in the bottom diagram were not represented by the sine curve with the shortest period of 0.y97, which may be spurious, while the two sine curves with longer periods seemed to fit successfully to the observed timings, especially to the CCD ones.
2http://var.astro.cz/ocgate/
We presented the first BV light curves of BH UMa and confirmed Krajci's (2005) result that BH UMa is an RR Lyr star that belongs to the RRc subgroup. The light curves showed a slight asymmetry of D = 0.453 with the amplitude of about 0.m58 in B, 0.m47 in V, and 0.11 in B-V and with a small hump between 0.p82 and 0.p86. Nine times of minimum light and eight times of maximum light were obtained from our BV observations. A total of 69 minimum timings available to us were intensively analyzed for the first time. The period of BH UMa was found to have varied dramatically in at least three independent sinusoidal ways superposed on a secularly downward parabola over 66 years. The secular period decreasing rate was obtained as 6.d684 × 10-8 y-1, corresponding to -0.58 s/century. The semi-amplitude and the period for each of the three sinusoidal variations were (0.d058, 14.y44), (0.d044, 9.y98), and (0.d005, 0.y97), respectively. It is currently uncertain whether the periodicity for the shortest period of 0.y97 is real or spurious. More accurate timings are needed to resolve the ambiguity.
The secular period decrease would be a natural result of evolution of the BH UMa system, as many investigators have argued (Smith 1997, Marconi 2009, Szeidl et al. 2011). As Smith (1997) discussed, the quantity α (= (1/P)(dP/dt)) for BH UMa, where the time interval dt is taken to be 106 years, is about 0.191, which is consistent with those of other RRc stars (Fig. 2 of Smith's (1997) paper). The two sinusoidal period variations may be due to two light-time effects caused by two hypothetical tertiaries in the BH UMa system. With the parameters in Table 5, the mass functions were obtained to be 4.44 ± 0.31M⊙ for the 9.y98 period and 4.86 ± 0.31M⊙ for the 14.y44 one. Such large mass functions imply that the companions have relatively high masses and that the orbit is likely to be second edge-on if the second and third companions exist. If the mass of BH UMa was assumed to be 0.55M⊙, a mean mass typical of RR Lyrae stars, then the implied minimum masses for the second and the third bodies would be 5.3 ± 0.3M⊙ and 11.3 ± 0.8M⊙, respectively, which are about 10 and 20 times larger than that of BH UMa. Alternatively, if two sinusoidal trends of the (O-C) residuals in Fig. 7 could be assumed to occur by chance, then they might arise from random fluctuations (or erratic changes) in the pulsation period of BH UMa, which have been attributed not to a star's secular evolution but to various causes such as mixing events in the stellar core (Sweigart & Renzini 1979), hydromagnetic events (Stothers 1980), convection (Stothers 2010), or passage through the RR Lyrae instability strip (Silva Aguirre et al. 2008). At the moment, no method is available to discern which mechanism among the existing theories is responsible for the observed changes in the pulsation period of BH UMa. However, the seemingly sinusoidal period changes could be produced if two or more mechanisms are concurrently active.
With the continuous monitoring of timings, high-precision observations of radial velocity curve and light curves are needed to understand this intriguing system.