In this study, we compared the precipitable water vapor (PWV) data derived from the radiosonde observation data at Sokcho Observatory and the PWV data at Sokcho Global Positioning System (GPS) Observatory provided by Korea Astronomy and Space Science Institute, from 0000 UTC, June 1, 2007 to 1200 UTC, May 31, 2009, and analyzed the radiosonde bias between the day and the night. In the scatter diagram of the daytime and nighttime radiosonde PWV data and the GPS PWV data, dry bias was found in the daytime radiosonde observation as known in the previous study. In addition, for all the rainfall events, the tendency that the wet bias of the radiosonde PWV increased as the GPS PWV decreased and the dry bias of the radiosonde PWV increased as the GPS PWV increased was significantly less distinctive in nighttime than in daytime. The quantitative analysis of the bias and error of the radiosonde PWV data showed that the mean bias decreased in the second year, regardless of nighttime or daytime rainfall, and the non-rainfall root mean square error (RMSE) was similar to that of the previous studies, while the rainfall RMSE was larger to a certain extent.
Water vapor, one of the greenhouse gases, plays an important role in the atmospheric energy transfer and its distribution is the key driving force in cloud and precipitation formation. Water vapor is decreased as the height is increased to upper part of the troposphere and its vertical distribution is not uniform when compared with other gases composing the atmosphere. In addition,horizontally, the water vapor in the low latitudes is greatly different from that in the Polar Regions. Measurement of water vapor is very critical to cloud physics, boundary layer study, atmospheric chemistry, climate study and weather forecast, but the measurement accuracy is limited by the cost and spatial limitations. Such a limitation in the accuracy affects weather forecast, sometime causing a failure in short-term forecast, especially in the precipitation forecast.
To improve the precipitation-predicting ability in weather forecast, it is important to understand the temporal and spatial distribution of atmospheric water vapor through high-accuracy observation. The observation of the vertical distribution of water vapor includes radiosonde, microwave radiometer and remote sensing using a satellite. Among these, radiosonde is the oldest instrument for the tropospheric water vapor observation and it generates the vertical data of the atmospheric pressure (geopotential height), air temperature, relative humidity and wind, 2-4 times per day. Although radiosonde is one of the key measurement tools in measuring the atmospheric water vapor from the past, the temporal resolution is limited to two time per day in most cases and many studies took note of the problems of the radiosonde water vapor observation such as the inaccuracy and bias (Elliott & Gaffen 1991, Lorenc et al. 1996, Motell et al. 2002).
The signal transmitted by a global positioning system (GPS) satellite is refracted and thus delayed due to water vapor before it is received by the ground station. The GPS precipitable water vapor (PWV) is calculated by converting the delay inversely. The advantages of the meteorological technology using GPS is that the data with high temporal and spatial resolution can be obtained since the observation is always possible, 365 days a year, and the observation network can be dense in proportion to the number of installed ground GPS observatories. Additionally, it is known that the accuracy of the PWV derived from GPS signals is as high as that from radiometer and radiosonde (Bevis et al. 1992, 1996, Rocken et al. 1995, Businger et al. 1996, Duan et al. 1996). Currently, Korea Astronomy and Space Science Institute (KASI) generates the GPS PWV data with the temporal resolution of 10-minute intervals using the constant GPS observation network data. Through the data, the atmospheric change in a small time scale can be detected and such temporal resolution is the advantage of GPS observation over the conventional radiosonde observation.
The previous studies regarding the error and bias of radiosonde showed that bias in PWV between the GPS and radiosonde measurements is mostly because of the radiosonde dry bias in daytime (Liou et al. 2000, 2001). Smout et al. (2002) showed that the difference in the daytime and the nighttime was because of the radiosonde humidity bias. It is also known that the relative atmospheric humidity and the solar radiation which is depending on the elevation are the main factors of the radiosonde bias (Wang & Zhang 2008). Kwon et al. (2007) also reported that there exists dry radiosonde bias when compared with the GPS data and the PWV difference is larger particularly in daytime.
In the analysis of the radiosonde PWV bias between the daytime and nighttime, Turner et al. (2003) used the radiometer PWV as the reference but proposed that the PWV derived from GPS observation be used as the reference because the radiometer PWV may have a problem in the calibration procedure or in the model to derive PWV using the brightness temperature. In addition, Nakamura et al. (2004) considered the accuracy of the GPS-derived PWV was as high as or higher than that of the radiosonde-derived PWV. Wang & Zhang (2008) set the GPS PWV as the reference for the PWV comparison, indicating that the inconsistency between the radiosonde and GPS data was often caused by the error in the radiosonde data. Takiguchi et al. (2000) also assumed that the PWV difference between GPS and radiosonde might have been mainly because of the radiosonde data and chose the GPS PWV as the PWV comparison reference. Most of the domestic and international studies regarding the comparison of the PWV data derived from GPS and radiosonde have been focused on the analysis for each season and year until now. However, a direct comparison of the radiosonde PWV with the GPS PWV by dividing the radiosonde PWV data into the daytime and nighttime data, and the rainfall and non-rainfall data may contribute to the improvement of the water vapor observation ability of a radiosonde.
In this study, we compared the PWV data derived from the radiosonde observation data at Sokcho Observatory and the PWV data at Sokcho GPS Observatory provided by KASI and analyzed the bias of the radiosonde PWV between the daytime and nighttime. Through this, we investigated the characteristics of the daytime and nighttime radiosonde water vapor observation data depending on rainfall occurrence. In this article, the observation instrument and method are firstly introduced and then the results of the GPS and the radiosonde PWV data analysis and comparison are presented.
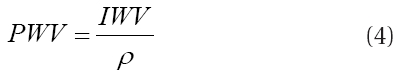
In this study, PWV which was used as the comparative indicator during the observation period refers to the total mass of the water vapor contained in an air column that is assumed to have the ground surface area of 1 m2 and extend from the ground surface to the upper layer of the atmosphere. PWV is used as the indicator of the water vapor contained in the air column and calculated as in Eq. (1) (Ninomiya 2003):
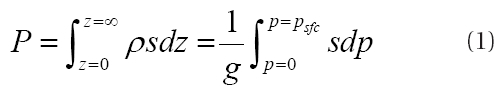
where
GPS signals are delayed as they pass through the troposphere of the atmosphere before arriving at the ground surface and the delay is classified depending on the atmospheric compositional gases into the dry delay caused by oxygen, nitrogen and carbon dioxide and the wet delay caused by water vapor. There two can be distinguished
by zenith total delay (
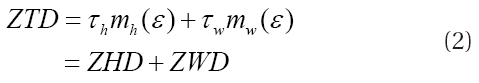
where τ denotes zenith dry delay and wet delay, and
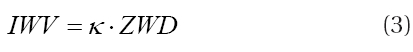
where κ is the term determined by the refraction constant and the average temperature equation (Davis et al. 1985, Bevis et al. 1992, 1994). The average temperature equation used here was the equation suggested by Ha et al. (2006). The method to calculate the error effect of the refraction constant and the average temperature is described in Park et al. (2010) in detail.
weather sensor attached to the GPS observation tower. The GPS receiver was the Trimble NetRS model and the data processing was performed using Bernese 5.0 developed in University of Bern, Switzerland (Dach et al. 2007). Among the nine constant observatories operated by KASI, the Sokcho Observatory performs both the GPS and radiosonde observation simultaneously. Thus, the results could be directly compared excluding the spatial error that may be caused by different observation locations.
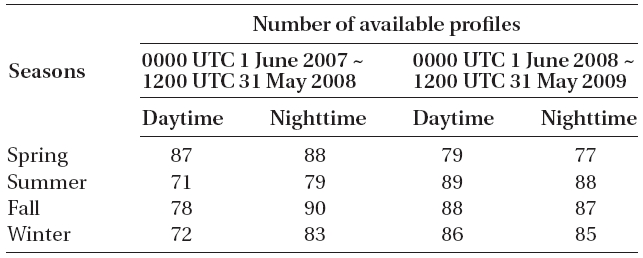
Fig. 1 shows the geological distribution of the GPS and radiosonde observatories, the GPS observation tower located at the Sokcho Observatory and the DFM-06 radiosonde, GRAW, Germany, (http://radiosondes.com/122.html, accessed October 1, 2010) which is the target of the analysis in this study. The nine GPS observatories are located in Daejeon, Mokpo, Milyang, Sokcho, Seoul, Jeju, Mt. Bohyeon, Mt. Sobaek and Goheung. The actual radiosonde measurement is also performed by the Korea Meteorological Administration at five locations including Sokcho, Baekryeongdo, Pohang, Heuksando and Jeju, and by the Korean Air Force at Osan and Gwangju. The employed PWV results calculated from the radiosonde data were the data provided by the Department of Atmospheric Science at University of Wyoming through the internet (http://weather.uwyo.edu/upperair/sounding.html).
The radiosonde measurement is carried out for two times per day (4 times depending on the weather condition) at 0000 UTC and 1200 UTC in the Sokcho meteorological observatory. The GPS observatory operated by KASI is located inside the meteorological observatory. In the Sokcho meteorological observatory, the 1524 Model of Jinyang Engineering had been used before 2000 and then the RS80-15L Model of Vaisala, Finland, was used. It was replaced by the DFM-06 Model of GRAW, Germany, from 0000 UTC, May 1, 2007. Since 0000 UTC, June 1, 2009, the RS92 Model of Vaisala has been employed until now.
2.2 Choice of events and analytical method
Radiosonde is floated usually at the elevating speed of 5-8 m/s by a balloon charged with hydrogen or helium gas. At such elevating speed, it takes about 40 minutes to reach 16 km of altitude and 1 hour and half to reach 30 km of altitude (World Meteorological Organization 2008). Thus, 30 minutes after the initiating the observation, a radiosonde is elevated to 12 km of altitude under which most of the atmospheric water vapor is contained (McMillin et al. 2007).
The radiosonde error and bias are divided into random error and systematic bias that are quantitatively expressed as root mean square error (RMSE) and mean bias, respectively. Reference data is required to calculate the radiosonde random error and systematic bias by comparing the radiosonde PWV; the GPS PWV data calculated by KASI in 30-minute interval were used in this study.
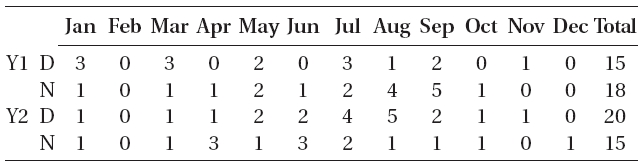
[Table 1.] Summary of radiosonde data sets.
Summary of radiosonde data sets.
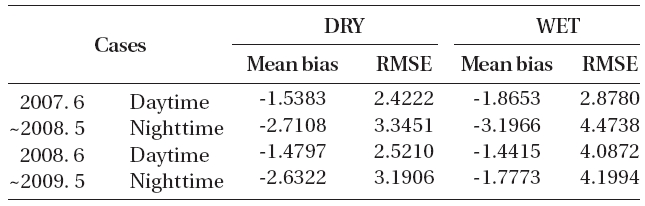
Summary of radiosonde monthly profiles in the event of 1-hour rainfall (>0.5 mm) maintained more than 30 minutes for two years.
The analysis was carried out in this study for the period from 0000 UTC, June 1, 2007 to 1200 UTC, May 31, 2009, when the DFM-06 Model was used, including the events when over 0.5 mm per hour of rainfall continued for more than 30 minutes in Sokcho. To analyze the difference between the daytime and nighttime rainfalls, the GPS PWV data calculated at 0000 and 1200 UTC, the radiosonde observation times, were respectively compared with the radiosonde PWV.
To choose the rainfall events, we employed the one-hour precipitation accumulation data observed by the automatic weather system to which a 0.5 mm tipping-bucket rain gauge is installed. Since a weak rainfall generally refers to the rainfall less than 0.2 mm of precipitation per hour (http://www.hrfco.go.kr/html/flood/floodClass_5.jsp, accessed October 1, 2010), the events in which the rainfall over 0.5 mm of precipitation per hour continued for more than 30 minutes from the radiosonde observation time were chosen in this study.
Table 1 shows the number of radiosonde observations at Sokcho Observatory used in the analysis, for daytime and nighttime and for each season. The total number of floating in the two years was 650 times in daytime (0000 UTC) and 677 in nighttime (1200 UTC) and the number did not include the cases when the radiosonde observation was failed or the necessary GPS PWV data was lacking.
Table 2 shows the number of radiosonde observation events in each month when the rainfall over 0.5 mm of precipitation per hour continued for more than 30 minutes from the radiosonde observation time. It can be known from Table. 1 and 2 that the number of rainfall events is relatively small when compared with the number of non-rainfall events, which is because there was only two times per day when the GPS observation and radiosonde observation were carried out at the same time since the radiosonde observation was performed two times a day although the GPS PWV data were generated at every 30 minutes. In addition, choosing the events when the rainfall over 0.5 mm of precipitation per hour continued for more than 30 minutes, the cases when there was even one minute of non-rainfall moment in the 30 minutes duration were all excluded from the choice.
3. COMPARISON AND ANALYSIS OF THE RESULTS
The GPS and radiosonde PWV pairs calculated in the events corresponding to Table 2 are denoted as WET and the pairs in other time period were denoted as DRY.
Based on this, the difference of the GPS and radiosonde PWV between the daytime and the nighttime was analyzed depending on the rainfall events in the two years from June, 2007 to May, 2009.
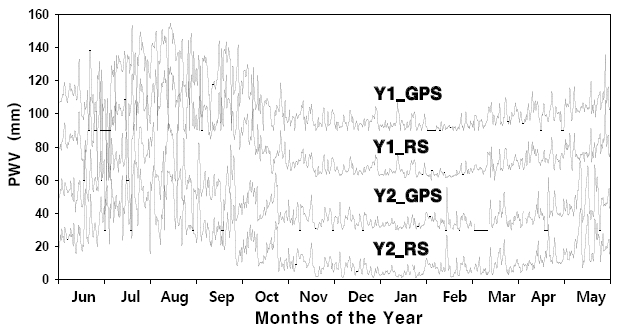
Fig. 2 shows the time series of the calculated GPS and radiosonde PWVs at Sokcho Observatory. The horizontal axis of the Figure refers to the time period from June 1 to May 31 of the next year, while the vertical axis refers to PWV. The time series show that the two measurements are well consistent with each other overall. The time se-
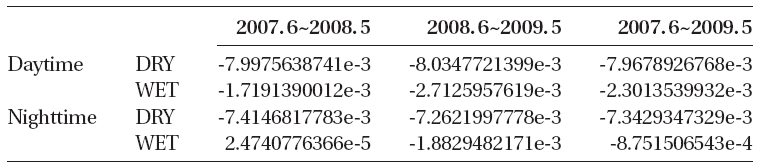
[Table 3.] Slopes of regression lines in Figs. 4-6.

Slopes of regression lines in Figs. 4-6.
series represents the seasonal variation of PWV. The drastic variation in the time series may be the increase and decrease of PWV caused by severe weather.
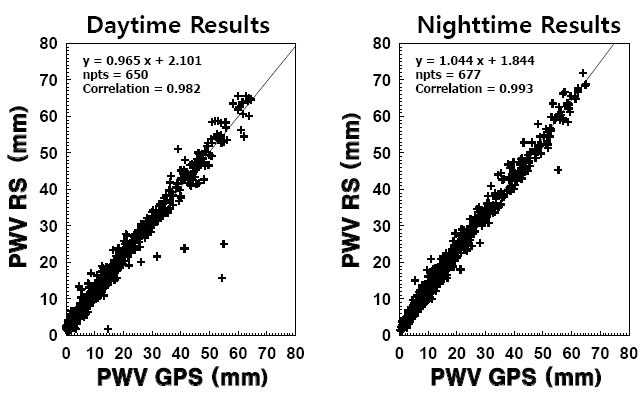
To investigate the difference of PWV depending on the time of radiosonde observation, the scatter diagram of the radiosonde and GPS PWV is shown in Fig. 3 for the daytime and nighttime. Here, the entire observation data mentioned in Table 1 were used. The Figure shows that the slopes of the regression lines of the daytime observation and nighttime observation are 0.965 and 1.044, respectively. As known by the previous studies, the dry bias was found in the daytime radiosonde observation. The nighttime observation showed the wet bias in the radiosonde observation and the correlation coefficient with the GPS PWV was higher in nighttime than in daytime.
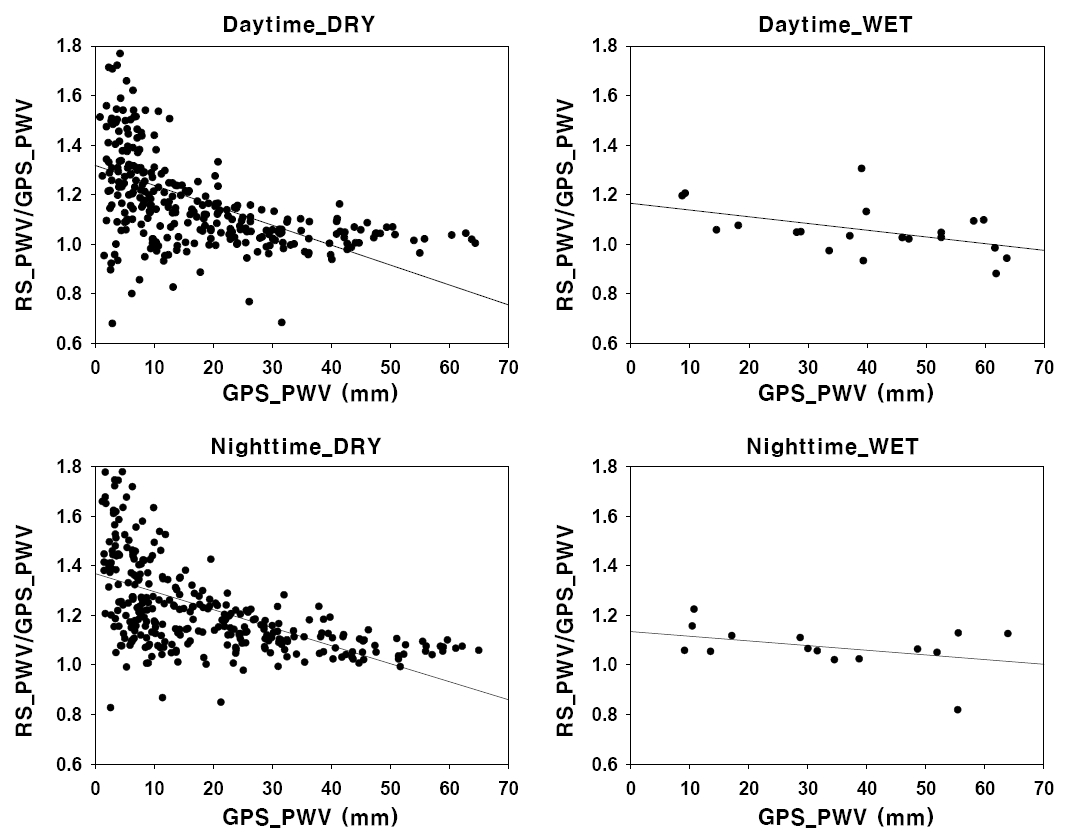
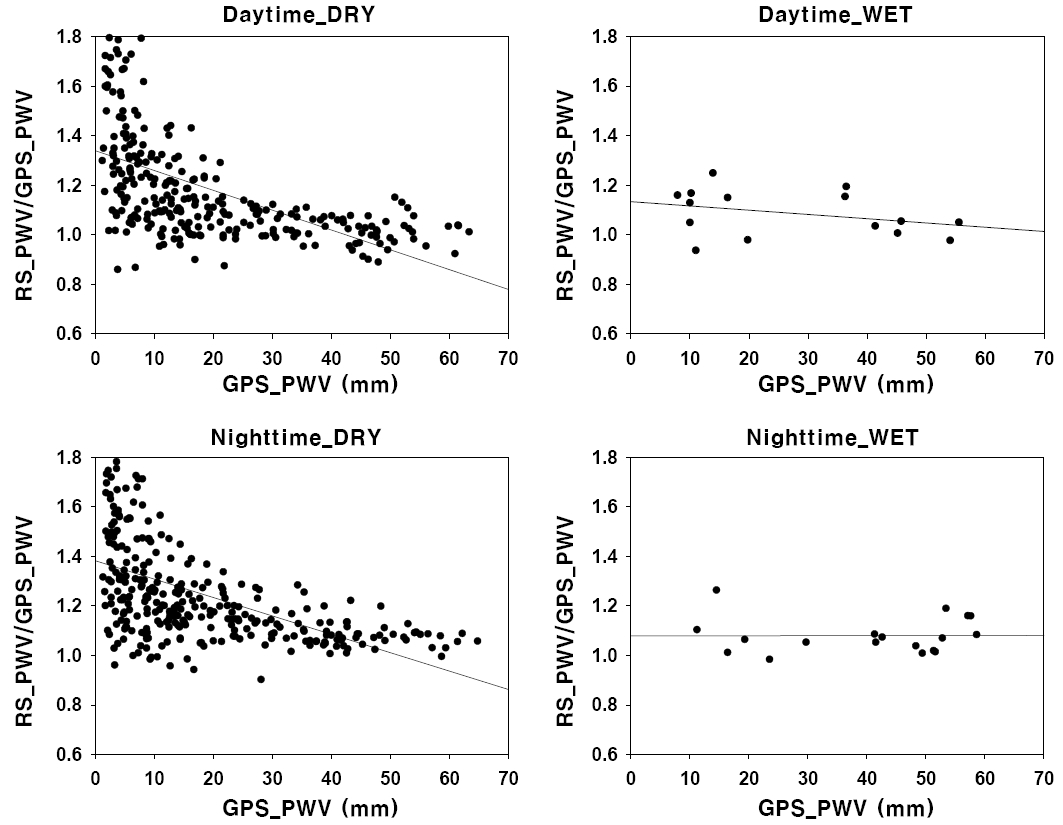
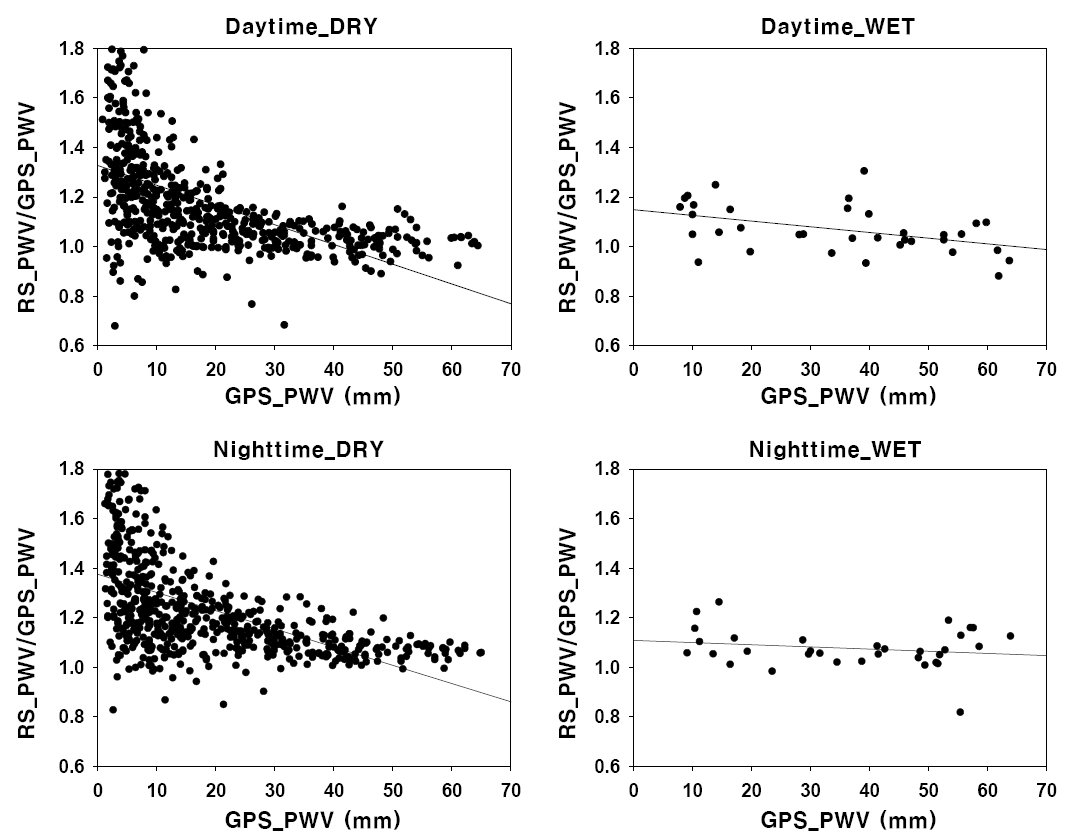
Dry bias can take place by the sun because the radiosonde sensor is exposed to the outside as shown in Fig. 1. To investigate the difference of the daytime and nighttime radiosonde PWV depending on rainfall occurrence, the GPS PWV was compared with the radiosonde PWV and the analysis results are shown in Figs. 4-6. In each Figure, the top part shows the change of the (radiosonde PWV)/(GPS PWV) ratio in the daytime observation depending on the GPS PWV and the bottom part shows the change in the nighttime observation. The analysis excluded the data that were assumed to be outlier as the radiosonde PWV was less than half of the GPS PWV or 2 times more than the GPS PWV.
Except the nighttime rainfall events in Fig. 4, the trend was found that the radiosonde PWV was changed from overestimation to underestimation when compared to the GPS PWV as the GPS PWV increased, which was similar to the analytical result by Kim et al. (2009). In addition, the difference between the daytime and nighttime observations showed that the trend shifting from overestimation to underestimation was more distinctive in daytime than in nighttime regardless of rainfall occurrence. Such a tendency can be also verified by the comparison of the slopes of the regression lines in Table 3. For the next, we performed the analysis of the daytime and nighttime data depending on the rainfall occurrence. With respect to all the rainfall events in Figs. 4-6, the tendency that
the wet bias of the radiosonde PWV increased as the GPS PWV decreased and the dry bias of the radiosonde PWV increased as the GPS PWV increased was significantly less distinctive in nighttime than in daytime. This result may be because the variation of the radiosonde PWV relative to the GPS PWV was decreased as the humidity sensor heating was reduced by cloud and water drops due to the solar radiation. Cady-Pereira et al. (2008) also showed that the radiosonde dry bias can be affected by the elevating speed and the appearance of cirrus and aerosol.
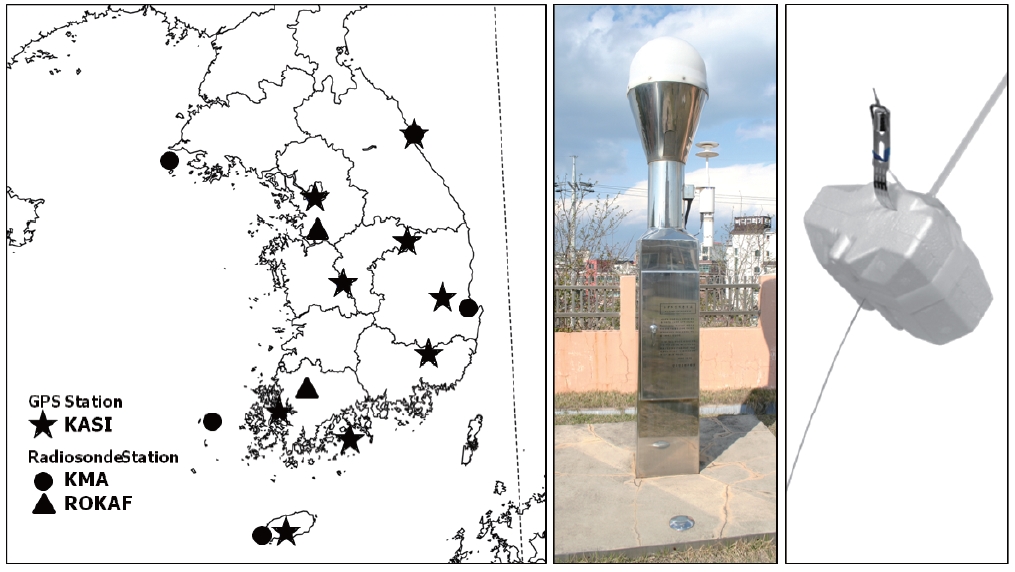
For the quantitative analysis of the radiosonde PWV bias and error, we calculated the mean bias and RMSE with the GPS PWV and presented the results in Table 4. The systematic bias that represents the degree of the sensor bias can be calibrated. The random error represents the range of the values irregularly varying within the uncertainty and thus small random error means high sensor accuracy (Kim et al. 2009). It was found that the mean bias was decreased in the second year regardless of rainfall occurrence both in the daytime and nighttime, which was also found in the study performed in the similar period by Ha & Park (2008). Since the maker of the radiosonde sensor updated the software in the spring of 2008 (Lee 2010), a further accurate analysis may be required.
[Table 4.] Mean biases and RMSEs of GPS and radiosonde PWV (unit: mm).
Mean biases and RMSEs of GPS and radiosonde PWV (unit: mm).
However, the RMSE was decreased in the nighttime, while it was increased in the daytime. The increasing rate of the RMSE was particularly high in the daytime during the rainfall events.
In a previous study, Ohtani & Naito (2000) reported that the RMSE between the GPS PWV and the radiosonde PWV was 3.7 mm using the six months of the observation data from ten radiosonde observatories located in the Japanese Islands. Compared to this result, the RMSE of our study was similar to that of previous studies in non-rainfall cases, but it was somewhat larger in rainfall cases. A long-term comparative study with more data is required to produce more objective results.
In this study, we compared the PWV data derived from the radiosonde observation data at Sokcho Meteorological Observatory and the PWV data at Sokcho GPS Observatory provided by KASI, from 0000 UTC, June 1, 2007 to 1200 UTC, May 31, 2009, and analyzed the radiosonde bias between the daytime and the nighttime. Through this, we investigated the characteristics of the daytime and nighttime radiosonde water vapor observation data depending on rainfall occurrence.
The time series show that the two measurements are well consistent with each other overall. The time series represents the seasonal variation of PWV. The drastic variation in the time series may be the increase and decrease of PWV caused by severe weather. As known by the previous studies, the dry bias was found in the scatter diagrams of the daytime and nighttime radiosonde PWV and GPS PWV. The nighttime observation showed the wet bias in the radiosonde observation and the correlation coefficient with the GPS PWV was higher in nighttime than in daytime.
To investigate the difference of the daytime and nighttime radiosonde PWV depending on rainfall occurrence, the GPS PWV was compared with the radiosonde PWV. An overall trend was found that the radiosonde PWV was changed from overestimation to underestimation when compared to the GPS PWV as the GPS PWV increased, and the trend shifting from overestimation to underestimation was more distinctive in daytime than in nighttime regardless of rainfall occurrence. In addition, for all the rainfall events, the wet bias of the radiosonde PWV was increased as the GPS PWV decreased, and the trend of the radiosonde dry bias increase was significantly reduced in nighttime than in daytime as the GPS PWV increased. For all the rainfall events, the tendency that the wet bias of the radiosonde PWV increased as the GPS PWV decreased and the dry bias of the radiosonde PWV increased as the GPS PWV increased was significantly less distinctive in nighttime than in daytime. This result may be because the variation of the radiosonde PWV relative to the GPS PWV was decreased as the humidity sensor heating was reduced by cloud and water drops due to the solar radiation.
For the quantitative analysis of the radiosonde PWV bias and error, we calculated the mean bias and RMSE with the GPS PWV. It was found that the mean bias was decreased in the second year regardless of rainfall occurrence both in the daytime and nighttime. The RMSE of our study was similar to that of previous studies in nonrainfall cases, but it was somewhat larger in rainfall cases.
The analysis of the radiosonde bias between the daytime and nighttime depending on rainfall occurrence may be provided as a reference material to use the corresponding radiosonde data. Since this study could include statistical error factors due to the shorter rainfall duration than the non-rainfall duration, a seasonal analysis as well as a comparative study with more data is required. It is expected that such comparative analysis of the GPS and radiosonde PWV may contribute to the improvement of the water vapor observation ability of a radiosonde.


![Scatterplot of (radiosonde precipitable water vapor [PWV]) / (global positioning system [GPS] PWV) ratio according to GPS PWV for the daytime (upper) and nighttime (lower) from 0000 UTC 1 June 2007 to 1200 UTC 31 May 2008.](http://oak.go.kr/repository/journal/10781/OJOOBS_2010_v27n4_367_f004.jpg)