The ionosphere, the atmospheric layer ionized by the extreme ultra violet radiation of the sun, is divided into the D, E and F layers in order from the ground surface according to the electron density distribution. Among these, the F layer is again divided into the F1 and F2 layers during the daytime. Particularly, the F2 layer plays an important role in high frequency radio communication,public broadcasting and ionospheric prediction. This layer has been the subject of many studies for a long time because it has the highest reflection ratio and is the thickest in the ionosphere and its electron density is highly variable (Kelley 1989, Davies 1990, Rawer 1993, Lilensten& Blelly 2002).
According to Rishbeth et al. (2000) the electron density variation (or anomaly) of the F2 layer can be divided into 3 types: seasonal variation (or winter variation), semiannual variation and annual or non-seasonal variation.Seasonal variation refers to the phenomenon that the NmF2, which is the maximum electron density in the F2 layer, is larger in winter than in summer usually in the day time in the middle latitudes. The annual variation refers to the phenomenon that the global NmF2 is larger in December than in June, which is because the seasonal variation is larger in the northern hemisphere than in the southern hemisphere, observed both at night and in day.Recently, in addition to these three variations, the NmF2 variations whose period is shorter than 27 days is also studied intensively (Lei et al. 2008a, b, c).
The electron density of the F2 layer is mainly determined by the [O]/[N2] ratio and diffusion (Rishbeth & Garriott 1969, Banks & Kockarts 1973, Richmond & Lu 2000). According to Rishbeth & Mendillo (2001), the factors that can influence on them are divided into four categories: the first is the variation in solar ionizing radiation by the solar rotation, variation in the solar active sites, flare activity and the solar cycle; the second is the variation in the solar wind and the geomagnetic activity by magnetic storms, substorms and interplanetary magnetic field (IMF)/solar wind sector structure; the third is the variation in the neutral atmosphere by the solar and lunar tides, vibration of the planetary wave, the interaction with the thermosphere and other phenomena taking place on the earth surface such as earthquake and volcano eruption; and the fourth is the electrodynamic variation by the plasma convection in the high latitudes and the electric field penetration from the magnetosphere.
The semi-annual variation of the F2-layer electron density is usually affected by the internal factors such as the global dynamic circulation in the thermosphere (Millward et al. 1996) as well as the external factors such as the variation in the geomagnetic activity and the solar wind energy (Lal 1992, Rangarajan & Iyemori 1998, Rishbeth 1998, Rishbeth et al. 2000). The variation of NmF2 can take place by the changes in the external factors such as plasma convection and the precipitating aurora particles in the high latitudes, and the equatorial electrojet generated by the E-W (dawn-dusk) electric field penetrating from the magnetosphere in the low latitudes. However, the NmF2 variation in the middle latitudes has the complex pattern, having the mixed features of the high latitudes and the low latitudes (Richmond & Lu 2000). Thus, the study of the semi-annual variation of the F2 layer in the middle latitudes is very important. The external factors are dependent on the solar activity. Particularly when the solar activity is high, the increase of the southward IMF Bz causes many geomagnetic changes such as magnetic storms and aurora by bringing in energy into the earth’s magnetosphere. During magnetic storms, the increase of the precipitating aurora particles and the increase of the electric field in the high latitude ionosphere bring about changes in the global circulation and composition between the thermosphere and the ionosphere and in the ionosphere electron density by letting the electric field penetrate along the middle and low latitudes (Richmond & Lu 2000). Therefore, in this study, we investigated the electron density variation of the F2 layer in the middle latitudes depending on the solar activity. Additionally, we studied more about the effect of the geomagnetic activity on the semi-annual variation of the F2 layer in the middle latitudes by investigating the relationship between the ionospheric variation resulting from the electron density variation and the geomagnetic activity.
For this study, we used foF2 observed by the ionosonde at Kokubunji in Tokyo, Japan (geographical location: 35.71N, 139.49E; location on the geomagnetic coordinate: 26.62N, 151.78W) (http://wdc.nict.go.jp/IONO/HP2009/ISDJ/index-E.html). Since foF2, the critical frequency reflected from the F2 layer, is proportional to the square root of electron density, the electron density variation in the F2 layer can be investigated through it. We also used the F10.7 index, Ap index, IMF Bz, and the speed, number density and dynamic pressure of the solar wind in the same period provided by OMNIWeb (http://omniweb.gsfc.nasa.gov/form/dx1.html). The F10.7 index, which is the intensity of the solar radio wave at the wavelength of 10.7 cm observed on the earth, is highly correlated with the sunspot number. Hence, it is commonly used as the index that indicates the solar activity instead of the sunspot number. The Ap index is the linearized Kp index through which the geomagnetic variation in the middle latitude can be well observed. When the IMF is southward, that is, Bz < 0, magnetic reconnection occurs and energy is supplied to the earth’s magnetosphere from the solar wind. Such southward IMF Bz is denoted as IMF Bs in this article. IMF Bs and the speed, number density and dynamic pressure of the solar wind are the factors that influence on the Ap index by affecting the geomagnetic activity.
3.1 Variation of foF2 depending on the solar activity
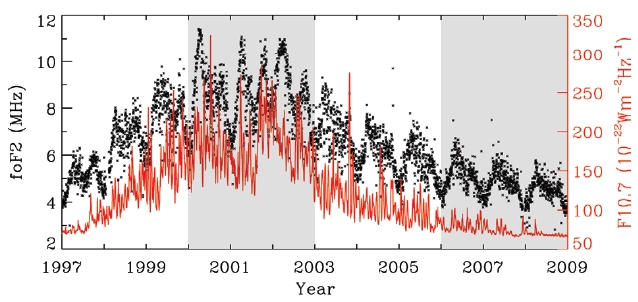
Fig. 1 shows the relationship between the F10.7 index and the daily average foF2 from 1997 to 2008. The black dots denote the daily average foF2 and the red line denotes the F10.7 index. The gray shaded boxes in the figure correspond to the years 2000-2002 and 2006-2008, respectively, where the daily average foF2 was higher and lower than that of other intervals. Different from the years 2006-2008 with low daily average foF2 when the maximum appeared only once a year, it appeared for two time in a year in the years 2000-2002 with high daily average
foF2. Comparing the two intervals with the F10.7 indices representing the solar activity, the interval between 2000 and 2002 corresponds to the period when the solar activity was high, while the interval between 2006 and 2008 corresponds to the when the solar activity was low. Thus, this result suggests that the cause of the different variations of the daily average foF2 in the two intervals may be related to the solar activity. The solar cycle 23 is from 1997 to 2007 and the interval between 1997 and 2008 includes one entire solar cycle. Hence, we set the years from 2000 to 2002 with the high F10.7 index as the high solar activity interval and the years from 2006 to 2008 with the low F10.7 index as the low solar activity interval, and examined the variation of the daily average foF2 accordingly.
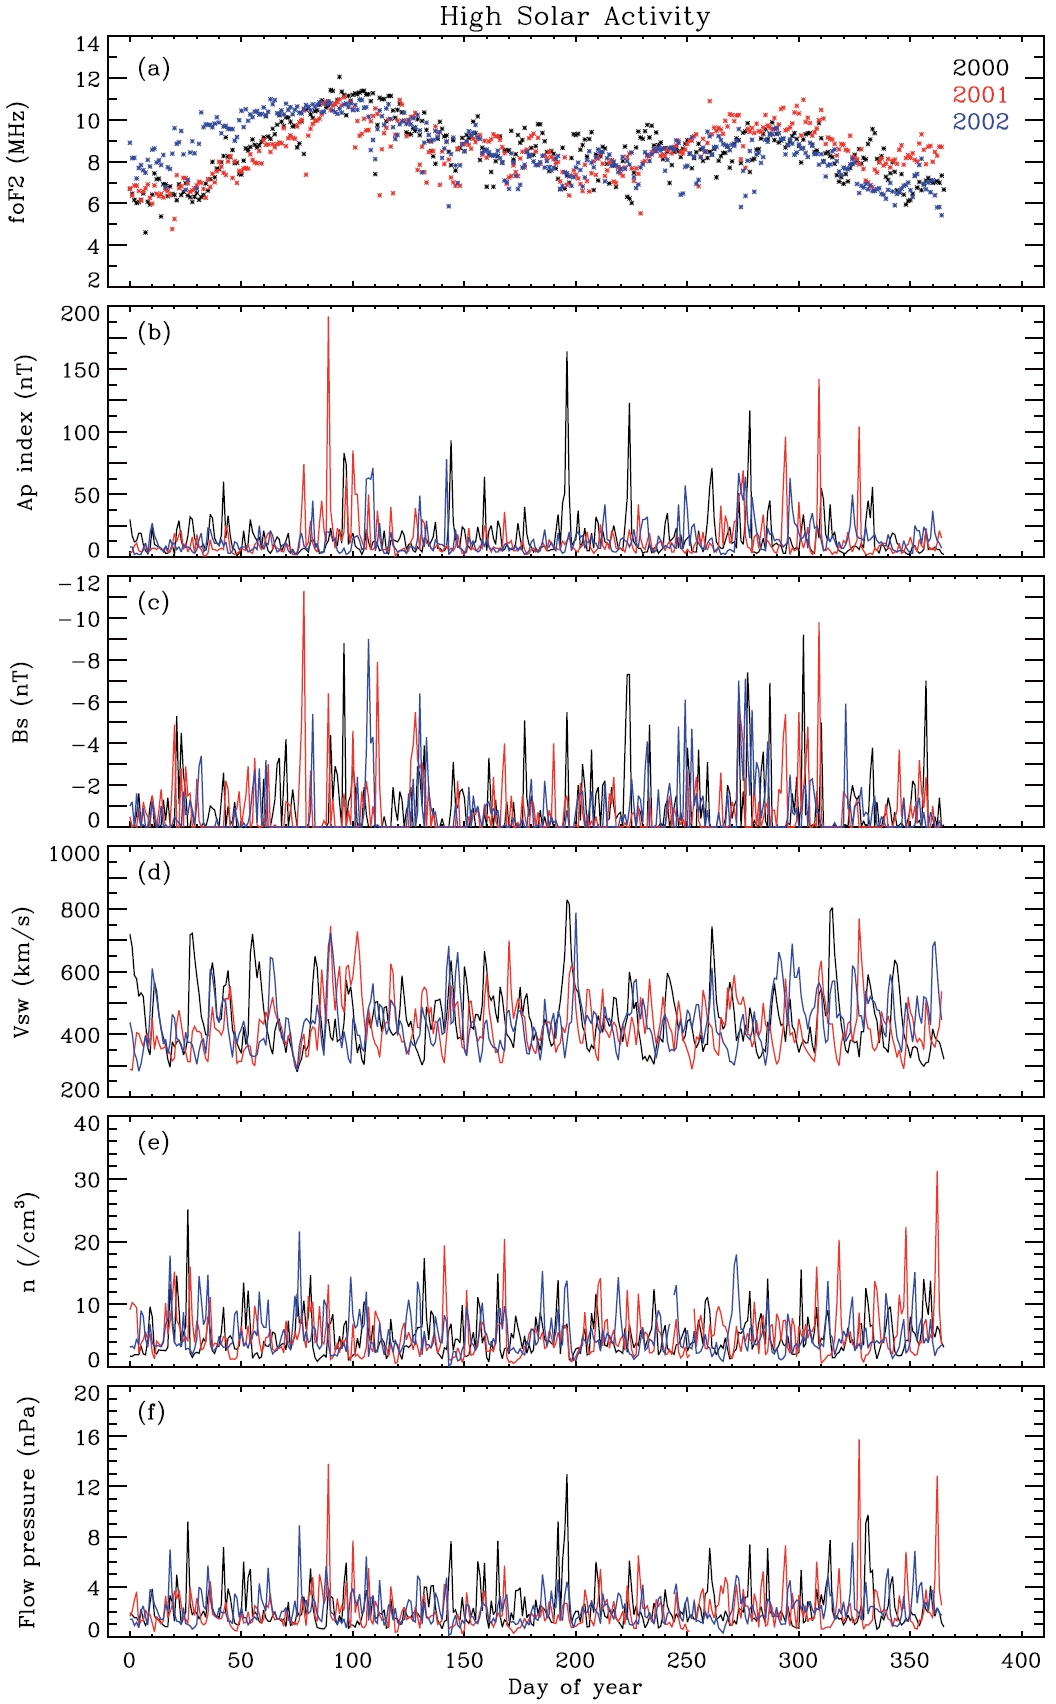
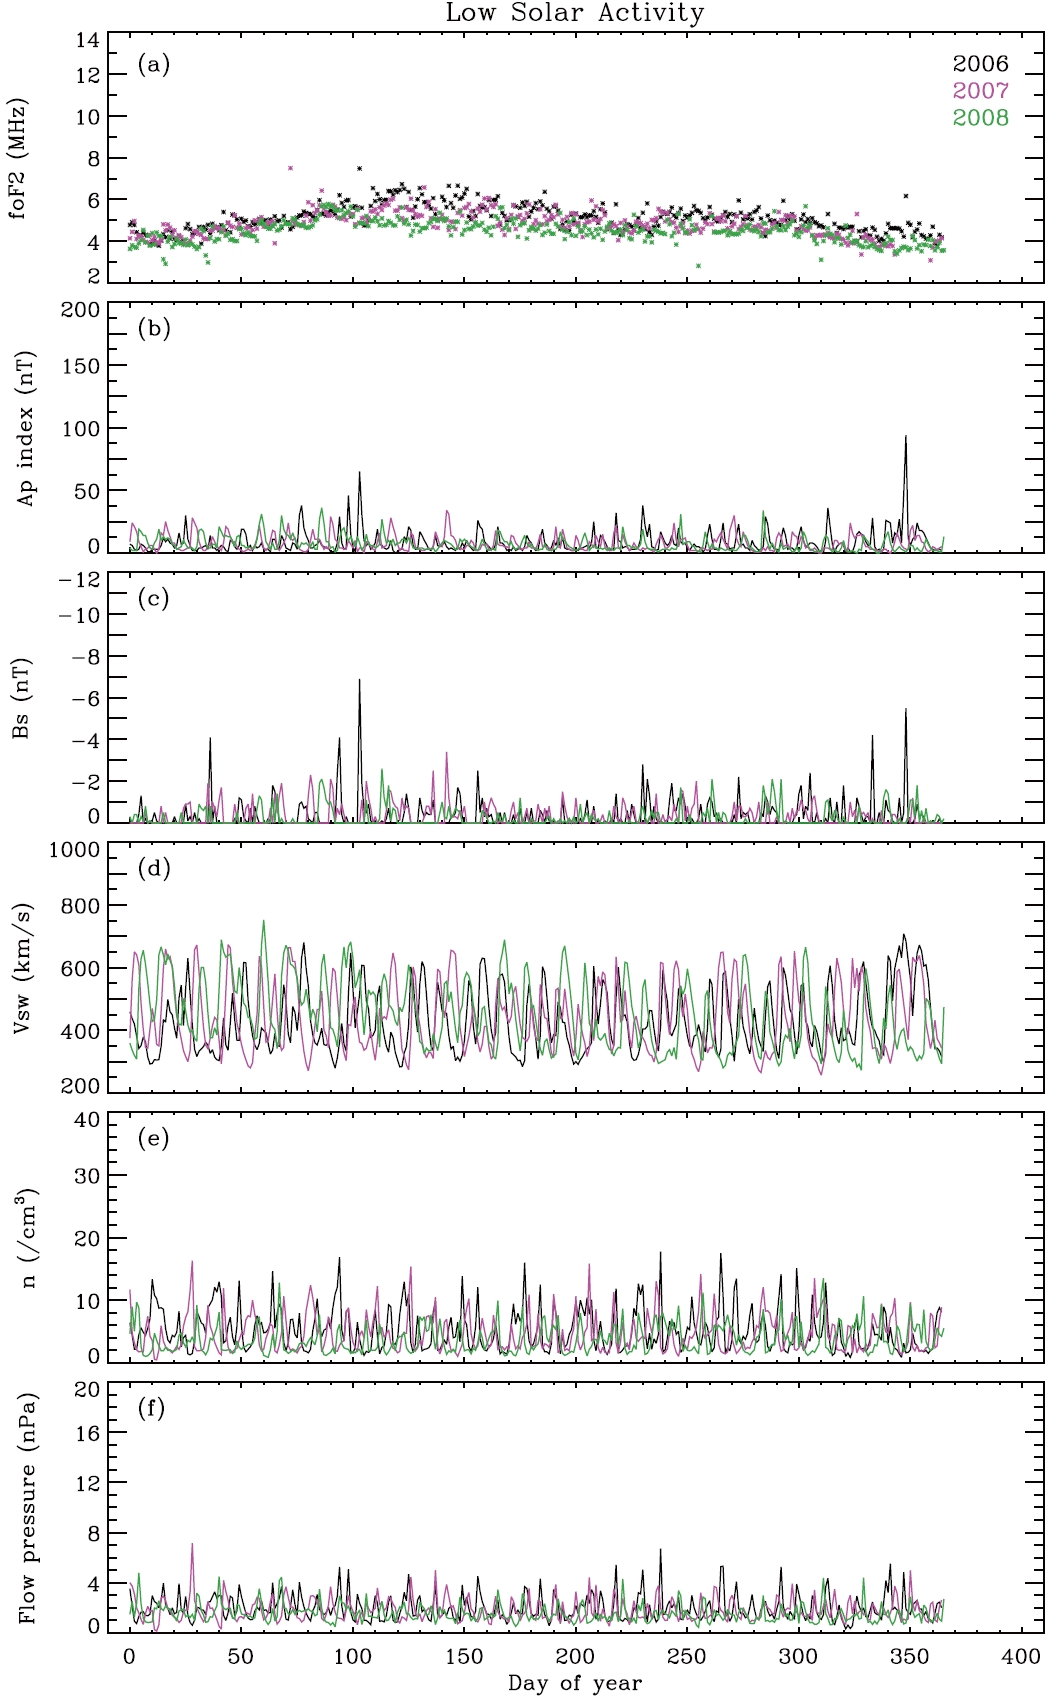
As shown in Fig. 2a, during the high solar activity interval, the seasonal averages of the daily average foF2 were 9.73 MHz in spring (March, April, and May), 8.14 MHz in summer (June, July, and August), 8.66 MHz in fall (September, October, and November) and 7.57 MHz in winter (January, February, and December), indicating the semi-annual variation with the maximum daily average foF2 in spring and fall. However, as shown in Fig. 2b, during the low solar activity interval, the seasonal averages of the daily average foF2 were 5.30 MHz in spring, 4.96 MHz in summer, 4.66 MHz in fall and 4.24 MHz in winter. Although the averages of the daily average foF2 in spring and fall were somehow higher than those of summer and winter, the semi-annual variation is not as distinctive as the high solar activity interval.
That the semi-annual variation of the daily average foF2 in the middle latitudes was more distinctive in the high solar activity interval than in the low solar activity interval, as shown in the Figs. 1, 2a and b, means that the cause is related to not only the meteorological changes in the thermosphere but also the solar activity. As mentioned previously in the introduction, because the geomagnetic activity by the solar activity affects the variation of the electron density of the ionosphere F2 layer, it can be predicted that the semi-annual variation of the daily average foF2 is considerably related to the variation of the geomagnetic activity depending on the solar activity. Therefore, we investigated the correlation between the semi-annual variation of the F2-layer electron density in the middle latitudes depending on the solar activity and the geomagnetic activity by comparing the Ap index representing the geomagnetic activity in the middle latitudes as well as IMF Bs, and the speed, number density and dynamic pressure of the solar wind that can affect the Ap index with the foF2.
3.2 Relationship between the foF2 variation and the geomagnetic activity
Figs. 2 and 3 show the variations of the daily average foF2, the Ap index, IMF Bs, the solar wind speed, the solar wind number density and the solar wind dynamic pressure in the high solar activity interval (2000-2002) and the low solar activity interval (2006-2008), respectively. The black, red and blue lines in Fig. 2 respectively denote the years 2000, 2001, and 2002, and the black, pink and green lines in Fig. 3 respectively denote the years 2006, 2007, and 2008. As shown in Fig. 2b, in the high solar activity interval, the seasonal averages of the daily average Ap index were 14.64 nT in spring, 12.76 nT in summer, 17.43 nT in fall and 10.15 nT in winter. As shown in Fig. 2c, the seasonal averages of the daily average IMF Bs were -0.83 nT in spring, -0.64 nT in summer, -1.04 nT in fall and -0.60 nT in winter. These two indices showed distinctive semi-annual variations with the maxima in spring and fall, as in the case of daily average foF2. On the contrary, in the low solar activity interval, as shown in Fig. 3b, the seasonal averages of the daily average Ap index were 8.70 nT in spring, 6.67 nT in summer, 7.13 nT in fall and 8.25 nT in winter. As shown in Fig. 3c, the seasonal averages of the daily average IMF Bs were -0.40 nT in spring, 0.23 nT in summer, -0.35 nT in fall and -0.25 nT in winter. Although the averages were a little higher in spring and fall than in summer and winter as in the case of the daily average foF2, the semi-annual variation was not as distinctive as that in the high solar activity interval. In addition, as can be known in Figs. 2d-f and 3d-f, the semi-annual variation was not distinctive in all the speed, number density and dynamic pressure of the solar wind, regardless of the solar activity.
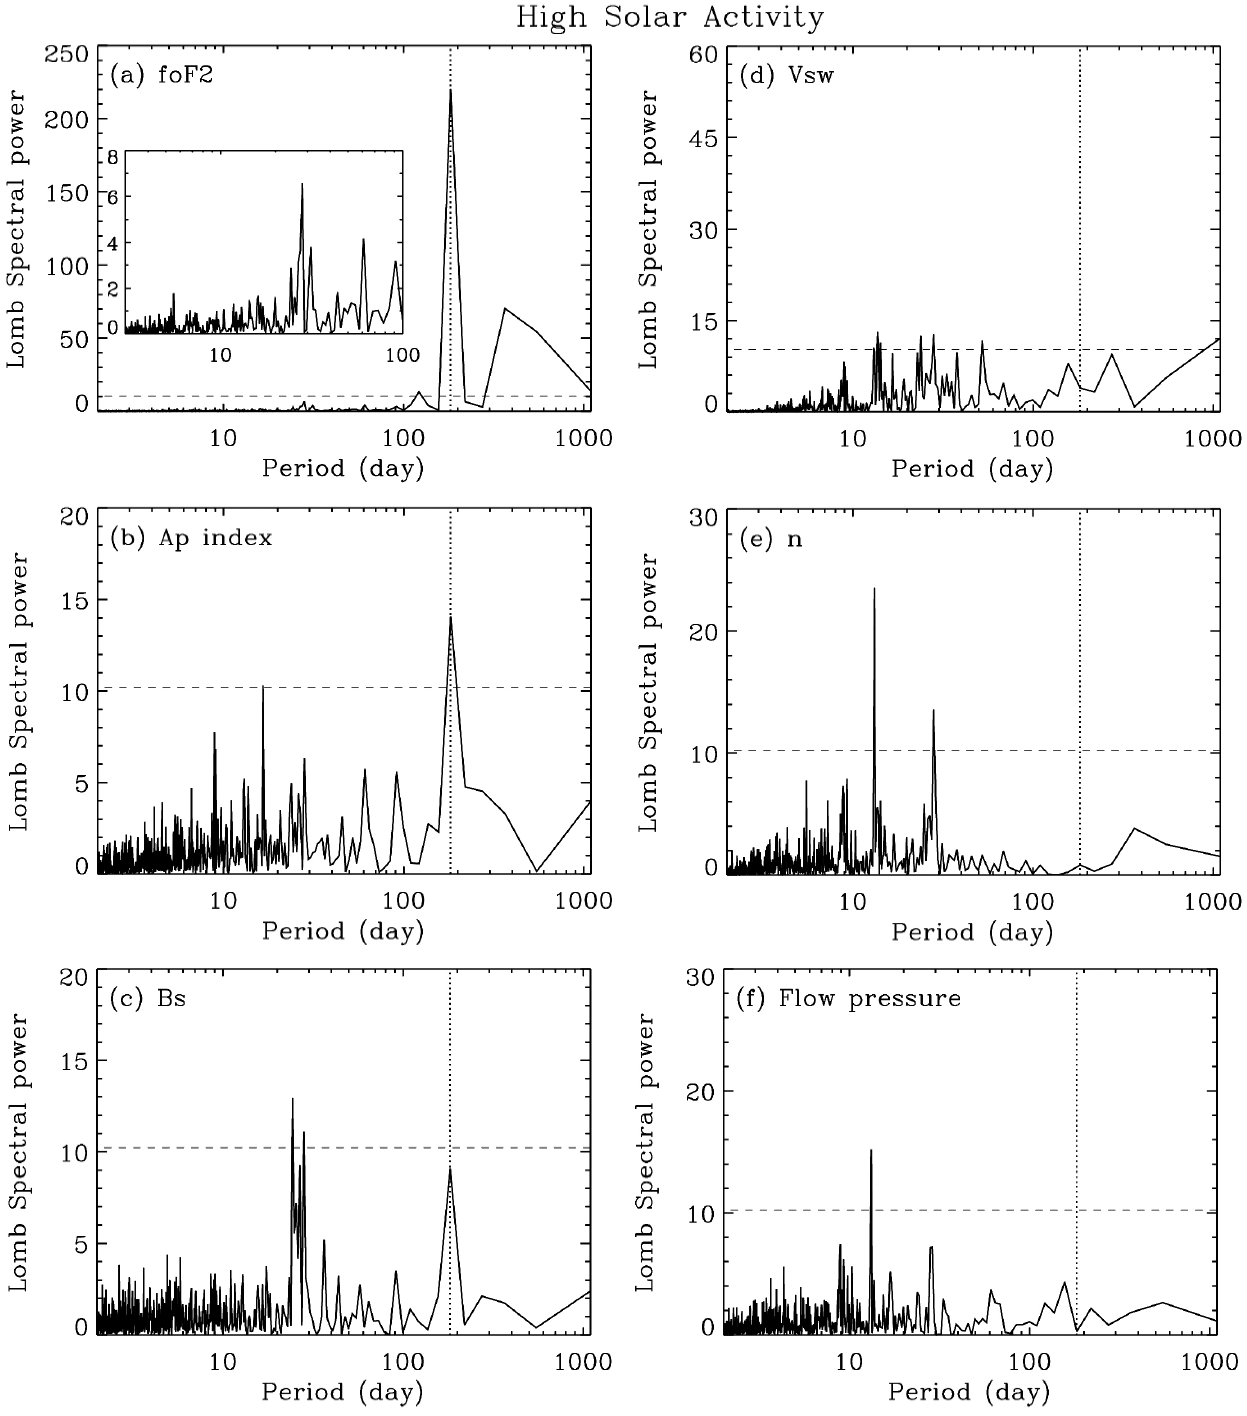
To investigate the periodicity of each variable more,
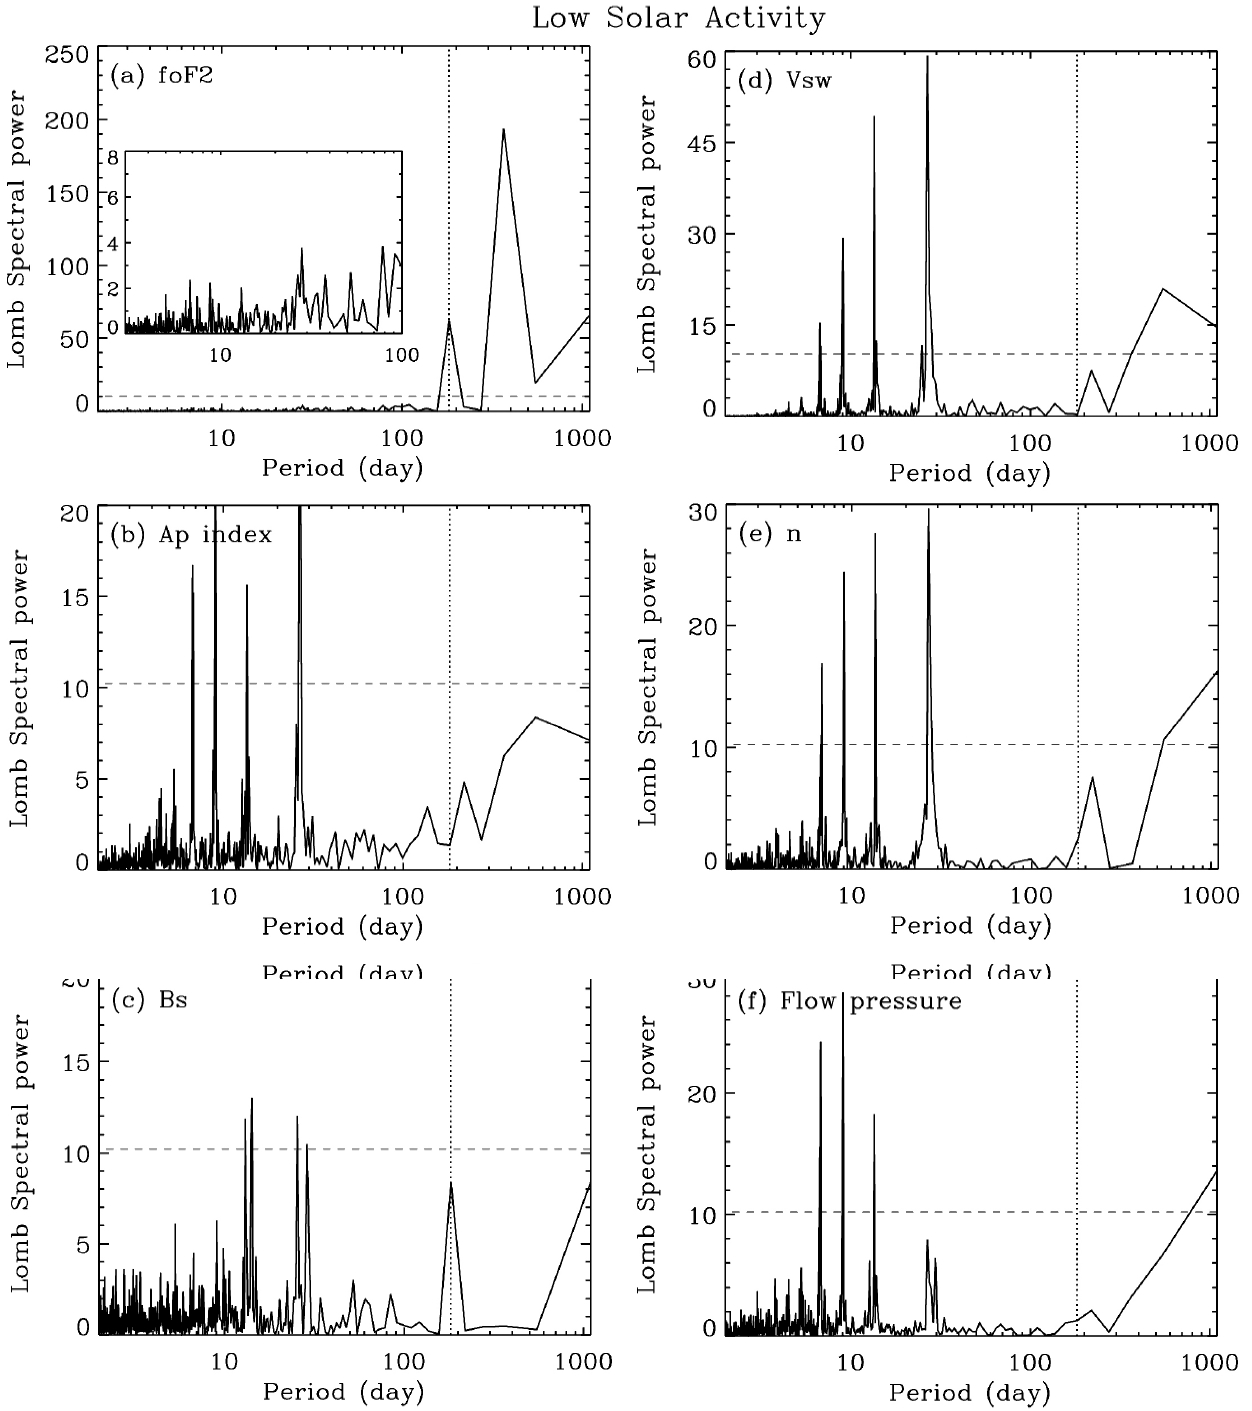
Lomb-Scargle periodogram analysis was performed with respect to the daily average foF2, Ap index, IMF Bs, the speed, number density and dynamic pressure of the solar wind in the high and low solar activity intervals, respectively, as shown in Figs. 4 and 5 (Lomb 1976, Scargle
1982). The small figures of Figs. 4a and 5a are the enlarged images of the regions of which period was up to 100 days. In each figure, the dashed line denotes 99% of significance level in the periodogram analysis and the dotted line denotes the semi-annual period. As can be known from Figs. 4a-c, distinctive semi-annual variation was found in all the daily averages of foF2, Ap index and IMF Bs in the high solar activity interval. However, the semi-annual variation was not distinctive in the daily average of the speed, number density and dynamic pressure of
the solar wind and, rather, variation of the period shorter than a half year was partially found. In the low solar activity interval, on the contrary, although semi-annual period was found in the daily averages of foF2 and IMF Bs, the period was not as distinctive as the high solar activity interval. Additionally, the daily averages of the Ap index, the speed, number density and dynamic pressure of the solar wind showed distinctive variation with the period even shorter than a half year.
When the solar activity is high, especially when the IMF Bz arrives at the earth while it is southward, the magnetic reconnection with the geomagnetic field lines takes place and many geomagnetic changes such as magnetic storms and aurora are brought about as energy is brought into the magnetosphere (Chapman & Bartels 1940). According to Russell & McPherron (1973), the IMF Bz offset becomes larger in spring and fall as a result of the seasonal geometric combination of geocentric solar ecliptic coordinate and the geocentric solar magnetospheric coordinate. Thus, as the southern component of the IMF is larger in spring and fall than in summer and winter, magnetic reconnection take place more frequently and, as a result, the geomagnetic activity becomes higher (Svalgaard et al. 2002). Because of this, the geomagnetic variation is stronger in spring and fall when compared to that of other seasons and this semi-annual variation of geomagnetic activity is called Russell-McPherron (R-M) effect. The effect is well demonstrated in Figs. 4c and 5c. Thus, it can be understood that the semi-annual variation of the daily average IMF Bs reflecting the R-M effect caused the geomagnetic variation, affecting the semi-annual variation of the Ap index, which eventually affected the semi-annual variation of the daily average of foF2. However, it was found that, during the high solar activity interval, the average of the daily average IMF Bs was -0.93 nT in spring and fall and -0.62 nT in summer and winter, and the average of the daily average Ap index was 16.04 nT in spring and fall and 11.46 nT in summer and winter. During the low solar activity interval, the average of the daily average IMF Bs was -0.38 nT in spring and fall and -0.24 nT in summer and winter, and the average of the daily average Ap index was 7.92 nT in spring and fall and 7.46 nT in summer and winter. It is understood that, although R-M effect is reflected to all the IMF Bs regardless of the solar activity, the semi-annual variation of IMF Bs by the R-M effect in the high solar activity interval might have been reflected more distinctively to the Ap index, as shown in Fig.4b, because the IMF Bs values were larger in the high solar activity interval than in the low solar activity interval. In other words, it means that semi-annual variation of the geomagnetic activity by the R-M effect in the high solar activity interval was distinctively reflected to the Ap index and the variation of the geomagnetic activity affected the semi-annual variation of foF2 in the high solar activity interval. Therefore, it can be understood that the semi-annual variation of the F2-layer electron density in the middle latitudes during the high solar activity interval is greatly affected by the geomagnetic activity by the magnetic reconnection of the IMF and the geomagnetic field lines in addition to the meteorological variation of the thermosphere.
On the other hand, because the IMF Bs values were smaller in the low solar activity interval than in the high solar activity interval, the semi-annual variation of the IMF Bs reflecting the R-M effect was not effectively reflected to the geomagnetic variation which is represented by the Ap index, as shown in Fig. 5b. Thus, it is assumed that the semi-annual variation of the daily average foF2 might have not been as distinctive as in the high solar activity interval. Rather, during the low solar activity interval, short-period variations of the speed, number density and dynamic pressure of the solar wind by the changes of the corona holes, the solar rotation and the high-speed solar wind stream were more distinctive when compared with those of the high solar activity interval. These variations of the geomagnetic activity were effectively reflected to the Ap index as shown in Fig. 5b. Additionally, it can be known that the short-period variation of the daily average Ap index also affected the short-period variation of the daily average foF2, shown in Fig. 5a, although the effect was lower than the significance level. This is in agreement with the result of Lei et al. (2008a, b, c) that the changes of the corona holes by the solar rotation and the changes in the geomagnetic activity related to the high-speed solar wind stream affected the short-period variations of the neutral atmospheric density in the thermosphere and the total electron content in the low solar activity interval.
Using the foF2 observed by the ionosonde at Kokubunji in Tokyo, Japan, in the high solar activity interval (2000-2002) and the low solar activity interval (2006-2008), we investigated the F2-layer electron density variation in the middle latitudes depending on the solar activity. The result showed that the semi-annual variation of the daily average foF2 was more distinctive in the high solar activity interval than in the low solar activity interval. The contribution of the geomagnetic activity to the F2-layer electron density variation in the middle latitudes was investigated by the time series analysis and Lomb-Scargle periodogram analysis of foF2, the Ap index representing the geomagnetic activity in the middle latitudes, the IMF Bs (IMF Bz <0) that can affect the geomagnetic activity, the speed, number density and dynamic pressure of the solar wind, depending on the solar activity. The result showed that the semi-annual variations of the daily average foF2, Ap index and IMF Bs were more distinctive in the high solar activity interval than in the low solar activity interval. It is understood that the semi-annual variation of foF2 was more distinctive in the high solar activity interval than in the low solar activity interval because the semi-annual variation of the IMF Bs reflecting the R-M effect in the solar activity was distinctively reflected to the variation of the geomagnetic activity especially in the high solar activity interval, and the semi-annual geomagnetic variation greatly contributed to the variation of foF2. On the contrary, the short-period variations related to the solar rotation, changes in the corona holes and the high-speed solar wind stream were reflected to the variation of the geomagnetic activity more distinctively in the low solar activity interval than in the high solar activity interval. In addition, it is assumed that the short-period variation of the geomagnetic activity might have affected the short-period variation of foF2, although the effect was lower than the significance level. Through this study, we investigated the effect of the geomagnetic activity on the F2-layer electron density variation in the middle latitudes, especially on the semi-annual variation of the F2 layer, depending on the solar activity. However, the ionospheric changes depending on the geomagnetic activity can be varied by not only the solar activity but also by the latitudes. Therefore, in the next study, the relationship between the geomagnetic activity depending on the latitudes including the middle latitudes and the F2-layer electron density variation will be investigated.