Many filtered CCD measures form the basis of six new light curves of the eclipsing system SW Lyn. From these measures and additional observations for eclipse timing, 47 new times of minimum light over the time-interval of about 13 years have been calculated. The complex period variability can be sorted into a linear period improvement with 5.8-year and 33.9-year periodic terms. The shorter cyclic term of these is ascribed to a cool companion of the eclipsing pair but the longer one has no testable interpretation at present. The new light curves are synthesized by the 2003 version of the Wilson-Devinney differential corrections computer code. The results incorporate a source of "third light" which comes from the cool companion star that had been identified by the cycling of the period of the eclipsing pair and also had previously been identified spectroscopically. There is a measure of satisfaction with current understanding of the SW Lyn eclipsing system because of consistent syntheses of all historical light curves. This agreeable convergence, however,comes partly at the expense of an unanticipated temperature of the hot star and of a photospheric spot that has no obvious basis in the detached character modeled for the binary. We offer predictions of changes in the stellar parameters if the modeled detached-configuration should be wrong. The SW Lyn stellar system is still difficult to understand.
More than 60 years have passed since the light variability of SW Lyn (BD+42o1811, HD 67008, HIP 39771, and TYC 2976 85 1) was discovered by Hoffmeister (1949).The characterization by Huth (1958) placed it among the limited group of short-period close binaries which show continuously-varying light curves with component stars of appreciably different temperatures.
A set of ultraviolet, blue, and yellow light curves was presented and analyzed by Gleim (1967) with a now-outdated model. These data were subsequently synthesized by Wilson (1979) with his own gravitational model but with an inappropriate mass ratio. Assorted photoelectric data sets have been studied by Vet?snik (1968), Predolin et al. (1980), Kaluzny (1985), Liu et al. (1991), Kim et al.(1995), Ogloza et al. (1998) and, most recently, Kreiner et al. (2003). Convergence among these to a common parameter set has not been impressive in part because of the variety of models that were used and in part because of seeming intrinsic variability of the light curve. Still another light curve, that by Kim (2001), has not yet been analyzed. For all these light curves, the amplitudes of the primary and secondary eclipses fail to repeat as faithfully as might be hoped.
The radial velocity results by Vet?snik (1977) have been supplanted by the measures of Lu et al. (2001, LRO hereafter), which also show conclusive evidence for a third star spatially-unresolved from the SW Lyn eclipsing variable. On the basis of the spectroscopy alone, the gravitational binding of this companion to the close pair is not so evident as could be wished but a companion star had already been convincingly inferred on the basis of several period studies by Kim & Han (1993), Kreiner et al. (1997), Ogloza et al. (1998), Kim (1999) and Li & Qian (2005). Kim (2001) has also obtained 16 medium-dispersion Hα scans sampling, in part, the rising branch of the primary eclipse. These show modest line profile and depth variability (as well as orbital motion of the hot star) but the spectra have not yet been analyzed further.
Some confusion exists about even so basic a datum as the spectral type of the hot eclipsing star. Gleim's and Vet?snik's spectral type of F2 repeats the HD classification but cannot be verified by the unstandardized color index of either author. SIMBAD gives spectral classifications of F1 V and F2 V (see also Hill et al. (1975)). Also from SIMBAD, (B - V) is purported to be +0.23, but this number is actually (BT - VT), which can be calibrated into (B - V) = +0.20. When it is remembered that this is likely a composite color index, the hot star's spectral class must be not later than A7 and the short period assures that it will be not too far evolved from the main sequence. These seemingly small discrepancies (which will re-appear in this text) are not understood at present but they are likely not caused by any confusion from interstellar reddening since the galactic latitude is +31.2o. Only an upper limit could be found for the RASS count rate for this object (
Beginning 20 years ago, Shaw (1990, 1994) has progressively defined two groups of near-contact close binaries with SW Lyn a member of the group characterized by a semi-detached condition but showing near-contact for the hot component star. That group's light curves show light levels at phase 0.25 never to be brighter than light levels at phase 0.75. Even though the group seems well-defined, its membership remains only 6 certain members in the latest tabulation.
Finally, an interpretation of all this history and many of the results yet to be presented in this paper have been given by Kim et al. (2002).
The capability of obtaining red CCD observations of SW Lyn to supplement the historical UBV coverage, as well as the hope of defining a more credible parameter set, impelled some of us to undertake new observations. These were made on 11 and 6 nights during the 1995-1996 and the spring, 2001 observing seasons, respectively, at the Sobaeksan Optical Astronomical Observatory (SOAO) in Korea with a 61-cm reflector. A PM512 CCD imaging system of Photometric Instruments cooled with liquid nitrogen and a standard BVR filter set were used. No check star was used to validate the comparison star (BD+42o1816) and this is obviously a mistake. Our comparison star was also subsequently used by Kreiner et al. (1997) but, when chosen by us, had essentially no history known to us. The SIMBAD database shows for it a spectral classification of K0 and (
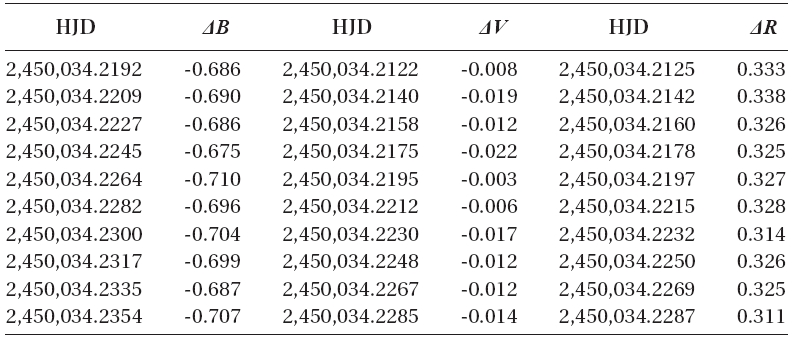
A total of 2,971 individual observations was obtained in the three colors (983 in blue, 1,000 in yellow and 988 in red) and a sample of them is listed in Table 1 which is available in its entirety in machine-readable at the web page1. The light curves of the two seasons are not identical and it is necessary to adjust the later data to those of the earlier season by zero-point corrections of -0.m026, -0.m002, and -0.m026 for the blue, yellow, and red bandpasses, respectively. It is possible that these zero-point changes reveal comparison star variability that we were
[Table 1.] CCD photometric observations of SW Lyn.

CCD photometric observations of SW Lyn.
unable to document from the extinction determinations but the totality of information indicates this not to be the case. The zero point corrections were actually obtained by Fourier fittings to the intervals between the eclipses through assorted harmonic orders. The higher-order
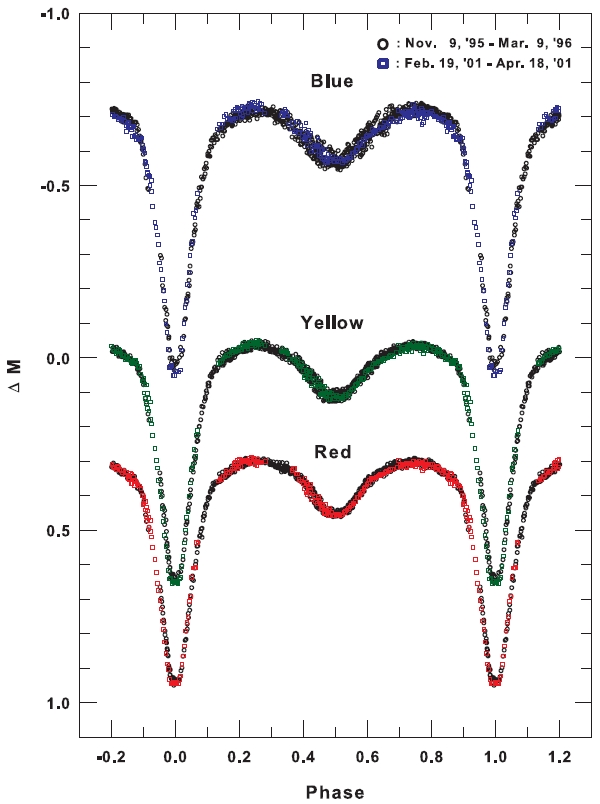
terms of these expansions, that are smaller than the zero-point corrections, are evidence of low-level intrinsic light variability of SW Lyn that is phase-dependent. Although this intrinsic variability is smaller than for cool contact binaries, one can see it clearly in Fig. 1. For our comparison star, the standard errors of a single 1995-1996 measure are ±0.m012 in blue, ±0.m009 in yellow, and ±0.m008 in red. The errors for 2001 are very similar to these values (±0.m010 in blue, ±0.m008 in yellow, and ±0.m006 in red).
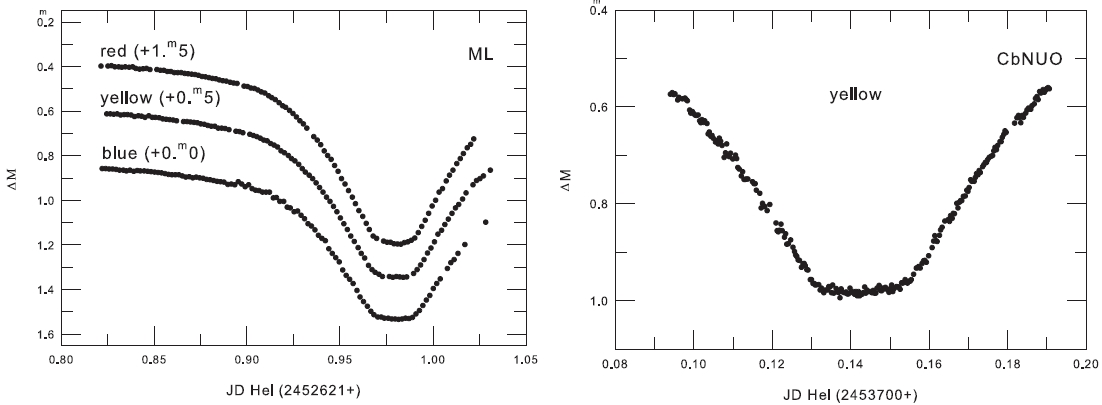
In addition to the complete light curves, additional observations for eclipse timing were made at two other locations-the Mt. Lemon (ML) observing site of the Korea Astronomy & Space Science Institute and the campus station of the Chungbuk National University Observatory (CbNUO). The ML facility has a 1-m reflector equipped with a 1 K Apogee CCD camera electronically cooled and a standard
1http://binary.cbnu.ac.kr/bbs/zboard.php?id=lab_photometry 2IRAF is distributed by the National Optical Astronomy Observatory, which is operated by the Association of Universities for Research in Astronomy, Inc., under cooperative agreement with the NSF.
3. VARIABILITY OF THE ECLIPSING PERIOD
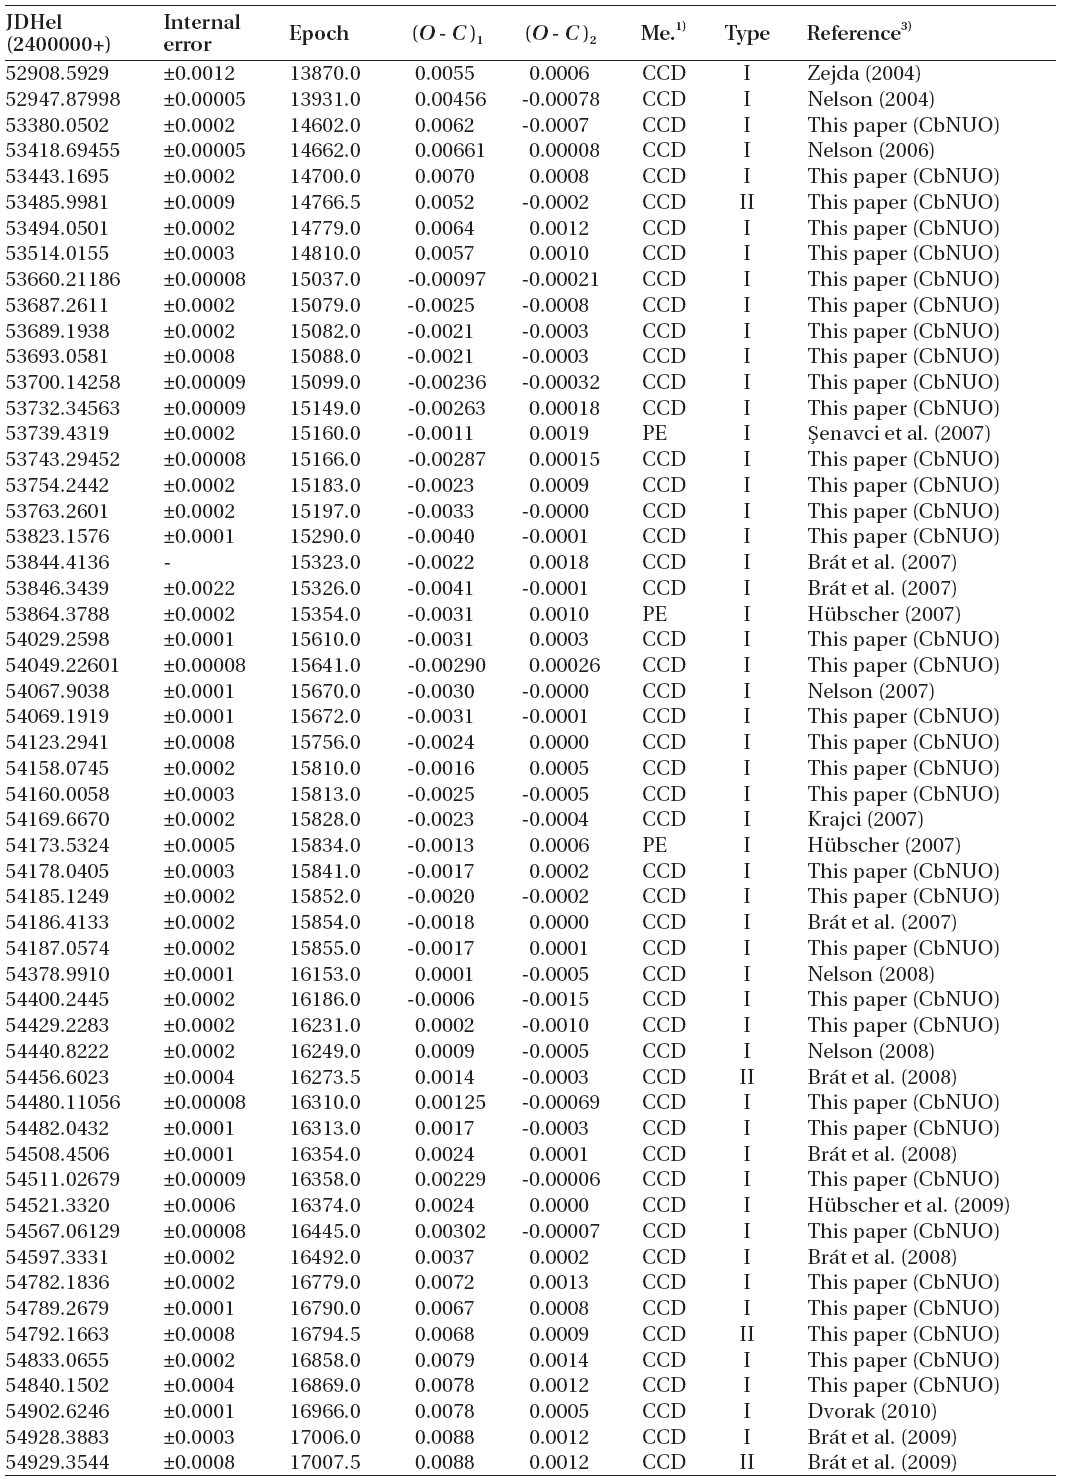
From our observations, 47 additional timings of minimum light were determined by the Kwee & van Woerden (1956, hereafter KW) method. These were spread over the time-interval of about 13 years. A total of 190 times of minimum light (48 patrol plates, 14 visual, 1 photographic,and 127 photoelectric & CCD timings), including ours, have been collected into a modern database (Kreiner et al. 2001).
Because of the great noise in the earliest timings, we decided to use only the photoelectric and CCD ones in order to study period stability. Among them, six timings(HJDs 2451177.3359, 2452642.9195, 2453375.5356, 2454150.3488, 2454199.2905, 2454491.3841) were not used in our subsequent analysis because their (O-C) residuals are unreasonably large compared with those of neighboring ones. The chosen 121 timings appear in Table 2 where the second column contains the internal errors of individual timings except for ten of them. The errors of another ten timings with a double-dagger mark in the same column were determined by us with the KW method from the published individual measurements because their errors were not published. Inversely squared values of these errors were assigned to the weights of individual timings. Mean internal errors for the primary and secondary eclipse timings were separately calculated to be as ±0.d0004 and ±0.d0008, respectively, of which the inverse-squared values were used as the weights of the rest of the ten timings without their errors.
Our starting point was the non-linear light-travel-time (LTT) ephemeris of Ogloza et al. (1998). It was instantly clear that this representation would not do justice to the timings after about 2000. Our improvement used the Levenberg-Marquardt algorithm from Press et al. (1992).
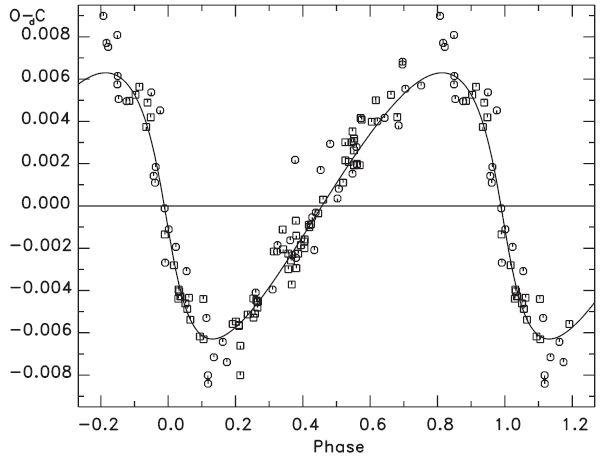
Without undue difficulty, the ephemeris was improved so as to lengthen both the eclipsing and the 5.8-year periods and to change appreciably two other parameters associated with the period history developed by the earlier workers. The direct interpretation of the 8.0 cycles of the 5.8-year period is that of a LTT effect due to a bound third star or star system. Even so, the residuals from our improvement were not satisfactorily at random and showed an apparently cyclic pattern requiring the addition of another non-linear term (
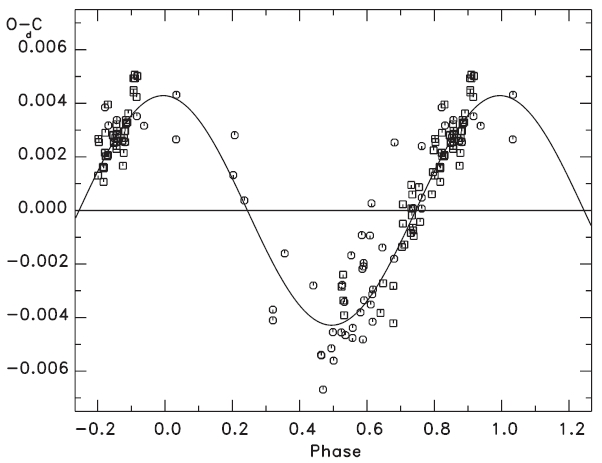
As an exercise, the long period may also be ascribed to another (fourth) bound companion and this representation appears in the table although there is no independent confirmation of its reality. The upper panel of Fig. 3 shows the residuals ((
Finally, the residuals displayed in the lowest panel
[Table 2.] Old and newly-observed photoelectric and CCD times of minimum light for SW Lyn.
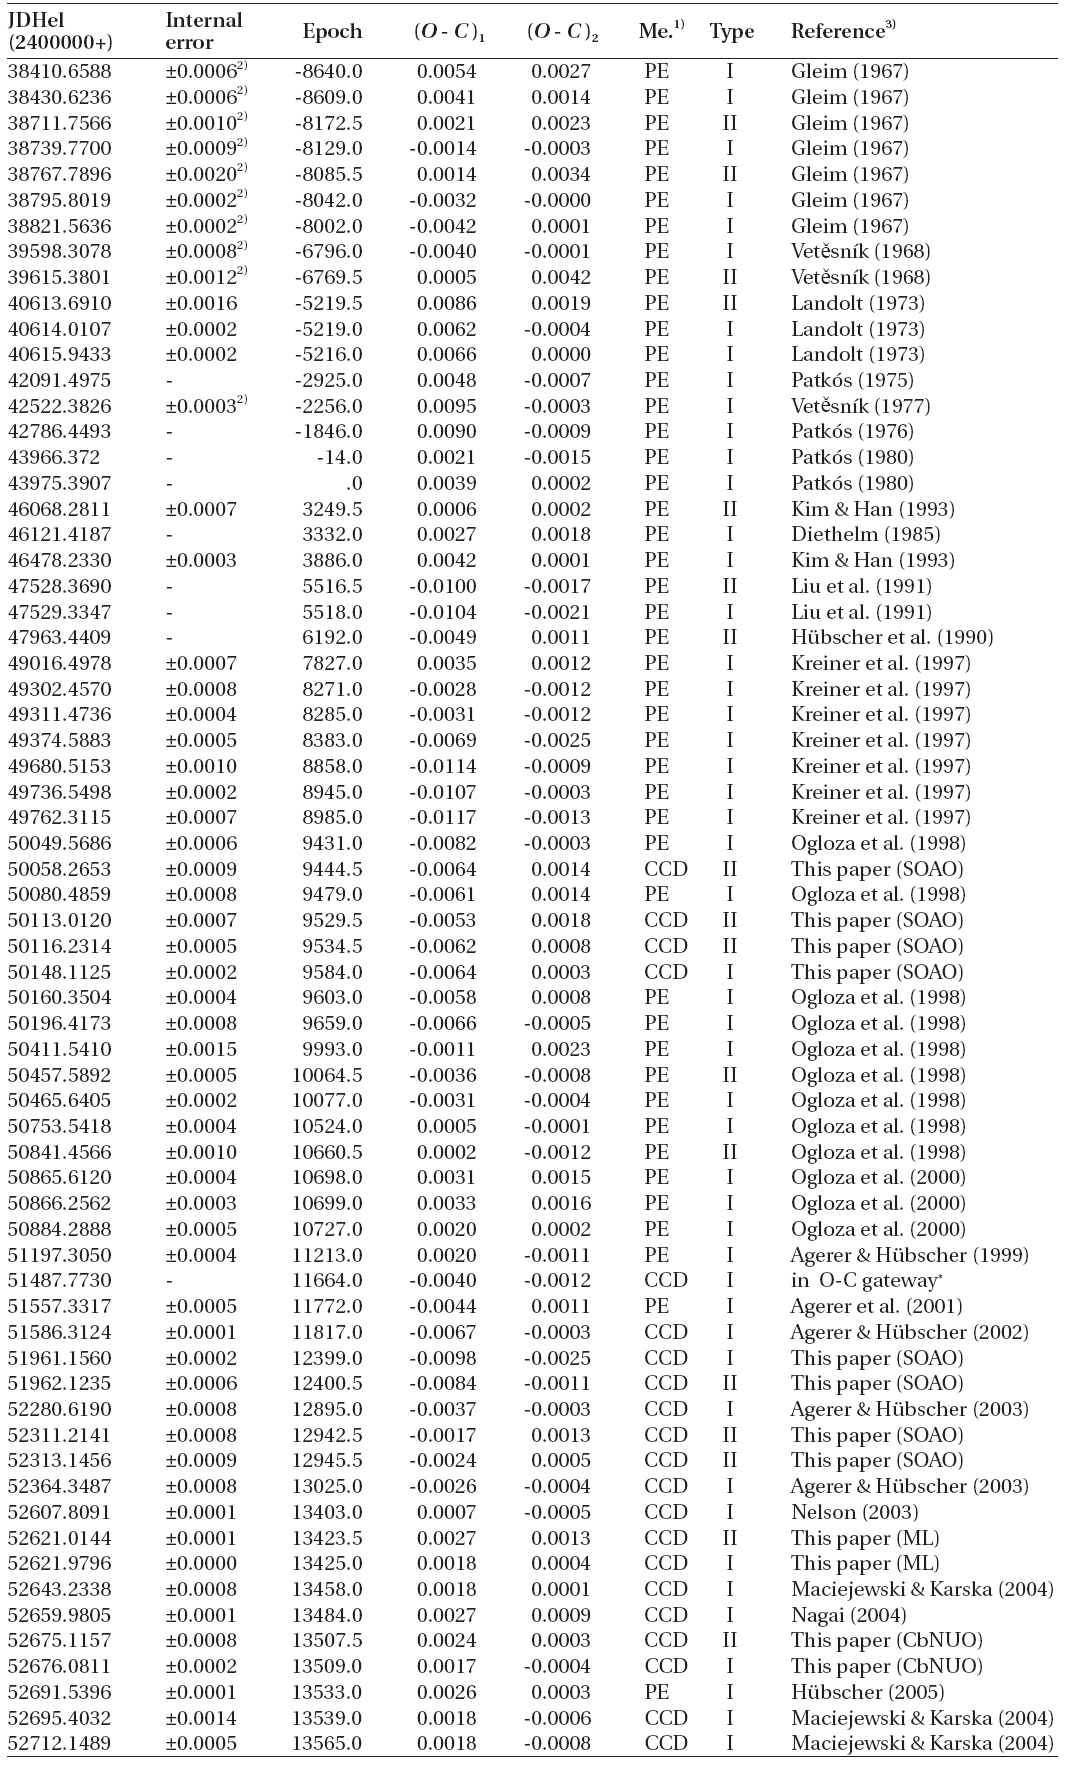
Old and newly-observed photoelectric and CCD times of minimum light for SW Lyn.

(Continued)
[Table 3.] Elements of all ephemeris terms for the SW Lyn system.
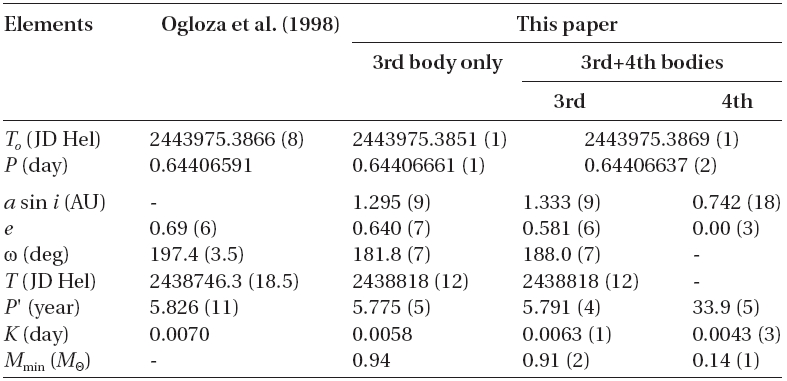
Elements of all ephemeris terms for the SW Lyn system.
systems which we have studied previously and may therefore be considered to be only noise. Nonetheless, they were delivered to the Scargle's (1982) periodogram code which showed some power (at a level of about 10% of the 33.9-year cycle) for a period of about 6.5 days. Further minimum timings are necessary to test whether this short periodicity is real and also to verify that no parabolic term exists.
It may be noted that Table 2 does not contain the time (2,451,400.1795) of primary eclipse given by LRO. Their value represents a calculated extrapolation and is somewhat noisy with respect to the photometric timings.
4. THE THIRD STAR AND ITS ORBIT
The accumulation of 8.0 cycles of the 5.8-year period leave no doubt that this period is an enduring feature of this system. In addition, the stable amplitude conveys the idea that it must be caused by a substantial mass rather than by, say, an ephemeral gas cloud or stream. The obvious interpretation, that of a LTT effect caused by a third star bound to the eclipsing pair, demands further evidence for this possibility.
In the
Reduction of the spectra taken by LRO revealed a third star's signature by a sharp spectral broadening function contributing a minor fraction of the system's absorption features. These authors forbore to attribute the 5.8-year oscillations (of which they were well aware) to this source because of several limitations of their material. (a) The broadening function for the cool eclipsing star is never strong and this shows up in very noisy velocity measures for that star, propagating into weak orbital velocity parameters.(b) If there is really a bound, widely-separated companion to the eclipsing pair, the barycenter of the latter must show seasonally variable velocity as the third star and the eclipsing pair pursue their absolute orbits. Since the spectroscopic phase coverage was not uniform over their two observing seasons, the radial velocity observers were unable to determine a value of
In what follows we adopt the interpretation that the spectroscopic third star is the cause of the 5.8-year period.The alternative - the third star is a background one and the cause of the period variation is so faint as not to be seen, in essence a white dwarf or M-type dwarf-is hardly an economy of hypotheses.
Because photoelectric and CCD history is not much longer than 34 years, it is possible that this interval of time refers only to a small-scale and bounded mass-transfer episode and is not representative of any cycling effect at all. Since we eventually conclude that SW Lyn is not semi-detached, we will ignore this possibility in what follows but it could actually be the correct understanding of this time interval if our interpretation is wrong.
In principle, there is nothing to prevent ascribing this cycle to the presence of a fourth star,
In principle, there exists a more than marginal possibility that the magnetic modulation, described by Applegate (1992) and later modified by Lanza et al. (1998), could operate in a star which has a convective envelope and thus may be magnetically active. As a test, the Applegate model parameters for both hot and cool eclipsing components were calculated for both the 5.8-year and 33.9-year periods. The results (not shown here) demonstrate that this mechanism cannot explain the 5.8-year modulation at all because it requires unreasonably large
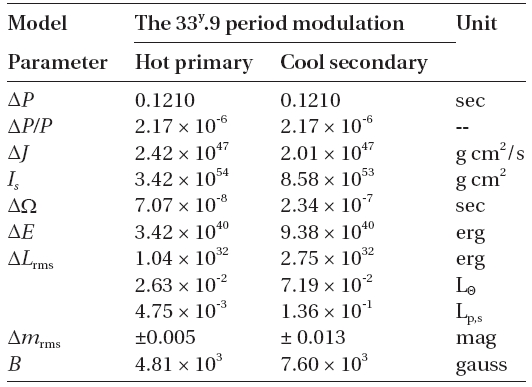
[Table 4.] Model parameters of magnetic activity for SW Lyn.

Model parameters of magnetic activity for SW Lyn.
rms luminosity variations exceeding the luminosities of each star. In principle, however, the longer period could be caused by the mechanism if it is occurring in either star. These results appear in Table 4, where Δmrms denotes a bolometric magnitude difference relative to the mean light level of SW Lyn converted to magnitude scale with Eq. (4) of the paper of Kim et al. (1997). The calculated light variation due to the hot primary star is about a factor of 20 lower than the value proposed by Applegate for an observable period change. The cool star’s light modulation is, however, quite close to his predicted value and suggests that Applegate's mechanism could function in the cool secondary star and could explain the observed 33.9-year period modulation of SW Lyn. Of course, the predicted bolometric light variation of the cool star is quite small and, for any filtered light curve, would be smaller than ±0.m013. It would be smaller still because some of the transferred energy is expected to be uniformly dissipated in the boundary between the radiative interior and the convective envelope. This model requires period changes to be in phase with the magnetic cycling of the star and light-level changes to be in phase as well so, in principle, it is a testable proposition. But at present, the test is not operable because all the light curves have accidentally been obtained near or at the minimum of the long-term period variation and there is none of them at the maximum of this modulation.
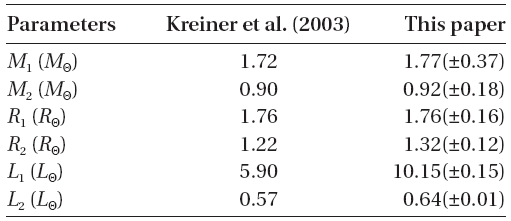
Although evidence for a magnetic field on the cool eclipsing star cannot be adduced from the period history, there seemed to be another opportunity in spectra obtained on March 10, 2001 at the Bohyun Optical Astronomy Observatory in Korea where a 1.8-m reflector is equipped with a medium dispersion spectrograph and a 1K CCD camera cooled with liquid nitrogen. The linear dispersion of the spectrograph at the Hα region is about 56 A/mm (3 A/pixel). A montage of spectral images, la-
labeled by phase according to the full non-linear ephemeris developed above appears in Fig. 6. As may be seen, the images cover the rising eclipse branch when the outer hemisphere of the cool star is turned toward the observer and when the contribution from the hot star is minified (only about 50% of that star’s light contributed to the top 3 images). The weak absorption at λ 6495 is due primarily to Fe I. Apart from the expected Doppler shifting, the most conspicuous detail of Hα is the seeming emission feature red-shifted from the absorption core in the image at phase 0.0. Should this be real, it could signify plage activity on the cool star and thus inferentially some level of magnetic activity for that star. It is evident, however, that this cannot be the case for the seeming emission represents only 2 pixels over a time scale that is much too brief. Although it is not obviously similar to the other image defects that may be easily seen across the raw images, there is no reason to believe it to be real. This effort - phased as favorably as possible - then also failed to support the hypothesis of a magnetic cool eclipsing star and the cause of the long-term period variation remains unknown currently.
For further use, we establish our notation as
Although in the main, the light curves are afflicted by noise levels appropriate for the technologies of their times, there is one exception to this uniformity. The 1997BVRI light curves all show short-term variability skewed with respect to the canonical light curve shapes. We tried to attribute the short-term variations to pulsation, presumably of the hot eclipsing star but were not successful.
All previous studies of SW Lyn have led to high inclinations. We believe these to be realistic and this circumstance should mitigate problems with parasitic solutions in the multi-parameter space. It was also clear that "third light" would have to be evaluated although this parameter would not resolve individual contributions between the third star and a possible fourth one. The variable light curve asymmetries, both ours and those from published data, are not excessively large but suggested that recourse to spot modeling would eventually be necessary. From experience by us and many other workers with numerous binaries and from the fact that the hot eclipsing star cannot have a substantial convective envelope, we expected the cool star to be the seat of any spot activity. Some previous light curve analyses had led also to the understanding that the cool star fills its Roche lobe so that mass transfer to the hot companion had also to be considered a possibility. This situation is familiar for many Algol-type pairs and an impact site on the hot star might be supposed to be the location of a spot of some kind. Since the period study failed to find evidence for a significant secular period variation, however, mass transfer was expected to be at low ebb.
In this section, we pretend that we separated the stellar fraction of the light curve synthesis from the fraction of it that developed the evidence for spots. In reality, the two efforts were eventually accomplished together and we separate their results here only to make more emphatic the distinction between the high-weight results for the global stellar parameters and the low-weight results for the spots.
We applied the 2003 version of the Wilson-Devinney synthesis code (Wilson & Devinney 1971, Wilson 1979, 1993, hereafter WD) and began with our own light curves examining four different synthesizing modes: mode 2 (detached), mode 3 (contact), mode 4 (semi-detached with the primary filling its inner Roche lobe) and mode 5 (semi-detached with the secondary filling its limiting lobe). In the differential correction (DC) portions of the WD code, the method of multiple subsets (Wilson & Biermann 1976) was used because of the correlations among the adjustable parameters. The albedo and gravity parameters were varied so as to see the effects of making them either unique or dissimilar for the two stars and van Hamme's (1993) limb darkening coefficients were used. There was little difference among the fits if these secondary parameters were changed so they had to remain poorly determined. Several test runs showed that the spin parameter should be set at 1:1 synchronism with orbital revolution. The Kurucz model atmosphere option (Kurucz 1993) was chosen rather than the black body one. Our tactic for the light curve work was to evaluate "third light" before searching for any spot or gas motion behavior because there could be little doubt that it would be found whereas the other activities could remain conjectural. Furthermore, a spot or other contributions to the light curve should be only a fraction of the "third light" contribution if LRO were correct in their evaluation of the latter. Another much more important distinction had to be investigated: a temperature of 6,700 K for the hot star would be inferred from the spectral type but the color index commended a value of the order of 7,800 K. To take the understanding of SW Lyn further, we also analyzed separately the Gleim, Vet?snik and Kreiner et al. light curves, using our own binary parameters as initial values.
Our experience showed that the differences of fittings of the assorted observations were never large no matter the choices of modes or hot star temperatures. To resolve these degeneracies, we set up a number of tests that a parameter choice should satisfy for all 5 seasons in order to be acceptable. These are as follows. (a) Because of the understanding of the period variability, the light curve fitting mode could not suggest large mass transfer to be a possibility. (b) The eclipsing pair light ratio could not conflict with the obviously large ratio that is spectroscopically valid. (c) The photometric determination of "third light" could not disagree significantly with its evaluation by the spectroscopists. This criterion was modified so as to set the photometric threshold at about 20%, the value subsequently improved (from the published 33%) and privately communicated to us by one of those authors. (d) The sums of the residuals squared for a chosen parameter set should at least formally be a minimum value. (e) The eventually calculated mass of the hot star could not violate the temperature and near main sequence position assigned to it.
The following results emerged. (a) Modes 2 and 5 were always better than modes 3 and 4 so the contact and over- contact conditions were denied as was Case A mass exchange. (b) No choice of mode or temperature could be preferred because the hot star's light always dominated that of the cool star by a large factor, as the spectroscopic evidence demands. (c) For the hotter temperature of the hot eclipsing star, the values of "third light" were not different for the two modes but the values were more accordant (by about a factor of 2) with the spectroscopic results than were the results if the hot star’s temperature was assumed to be 6,700 K. (d) Mode 2 always led to smaller (by 1%) sums of residuals squared than did the alternate possibility. (e) No matter what the evolutionary mode, the mass of the hot star cannot be made small enough to satisfy the F-type spectral classification but is appropriate for the temperature of an middle-to-late A-type star. This means that the F2 assignment must be wrong and this may be understood to be the result of many neutral metal lines from the atmosphere of star 3 appearing in the same spectrum as the A-star's Balmer and metal lines.
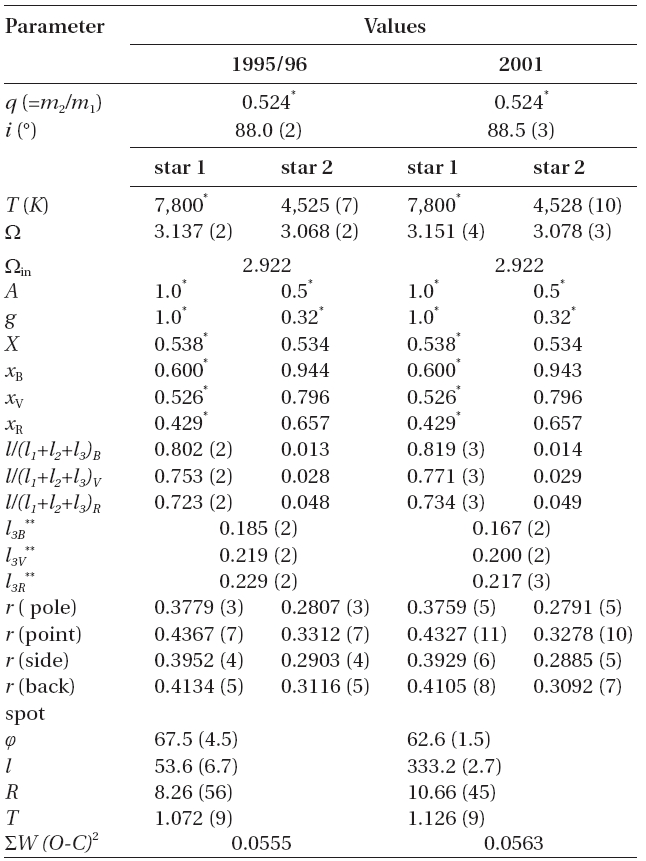
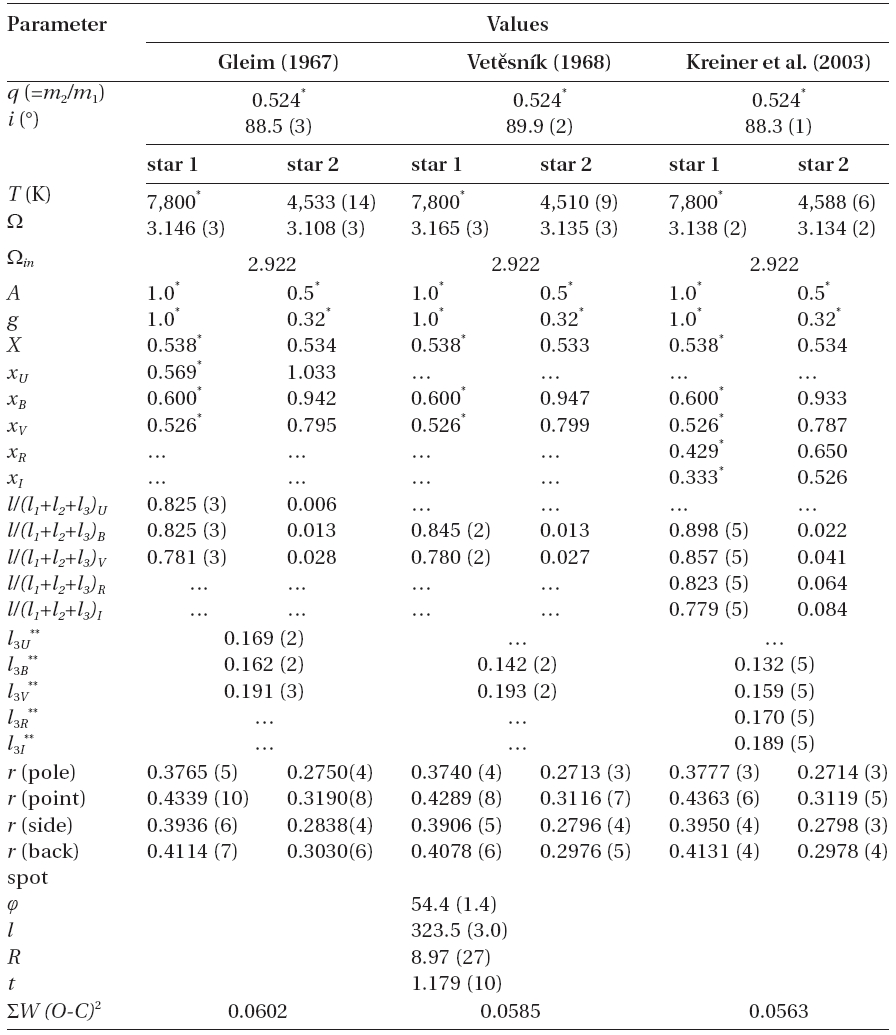
The net effect of these tests is a definite choice of a 7,800 K hot star but the preference for a detached binary rather than a semi-detached one has not been conclusive. The tradeoff between modes 2 and 5 is not extreme and, should it happen that increasing minimum timings eventually validate a secular period increase, this configuration could be changed. In this line the eclipses are complete, with the primary being annular and about 50% of the hot star’s area eclipsed at phase 0.0. With the total eclipse at 0.50 phase, it might be possible to determine one or more radial velocities of the hot star during secondary eclipse despite the blending with the broadening function of the third star. The final stellar parameters for mode 2 and 7,800 K (and after eventually incorporating a photospheric spot) appear in the upper portions of Table. 5 and 6.
We first examine the geometrical parameters. Despite the differences from one season to another and the asymmetries of the light curves, the radii and shapes of each eclipsing star appear to be established to three significant figures. The mean stellar radii are, therefore, also well founded. The same remark is true for the very deep orbital inclination, leading to the consequence that
[Table 5.] Model parameters of SW Lyn for 1995 and 2001 SOAO light curves.

Model parameters of SW Lyn for 1995 and 2001 SOAO light curves.
the orbital dimension and the masses and radii of the stars are accurately freed of the projection effect in Table 7 also. These are impressive concordances particularly since there do exist systematic differences from one light curve to another.
The radiometric stellar parameters are a somewhat different matter. In general, the light contribution of the hot star diminishes with wavelength but the 1997BVRI values are systematically high by about 0.07 compared to all other results. This effect has a mirror consequence in that the value of excess hot star light is lost from the contribution of star 3 making the non-eclipsing star appear systematically faint when compared to the results from the other light curves. The temperature of the cool star is very well defined and the inferred spectral type of that star is K2-K3 or K0 for Luminosity Classes III or V, respectively. Table 7 shows this star to have a radius appropriate for Luminosity Class IV. The color indices can be derived from the light contributions due to stars 1 and 2 and "third light". For the 1997BVRI data, the color indices for the "third light" are, within errors, the same as for the cool eclipsing star. For the other seasons, their
[Table 6.] Model parameters of SW Lyn for the nine historical light curves.

Model parameters of SW Lyn for the nine historical light curves.
[Table 7.] Absolute dimensions of the SW Lyn eclipsing stars.

Absolute dimensions of the SW Lyn eclipsing stars.
mutual agreement is very high for the cool eclipsing star, but the "third light" contributions for these seasons are somewhat noisy and signify a temperature somewhat hotter than that of the cool eclipsing component.
Should there arise conclusive evidence that mode 5 (semi-detached configuration with the lobe filling secondary component) is really the correct description, we predict that (for the present mass ratio) the cool star will show a radius larger by 11%, the hot star a radius smaller by 2%, and the orbital inclination a diminution of about 7o compared to the averages of the values in Table. 5 and 6. There will be consequent changes in the individual luminosities and light ratios.
All of the foregoing conclusions were actually drawn after the final light curve fittings were satisfied by star spot contributions when this was necessary.
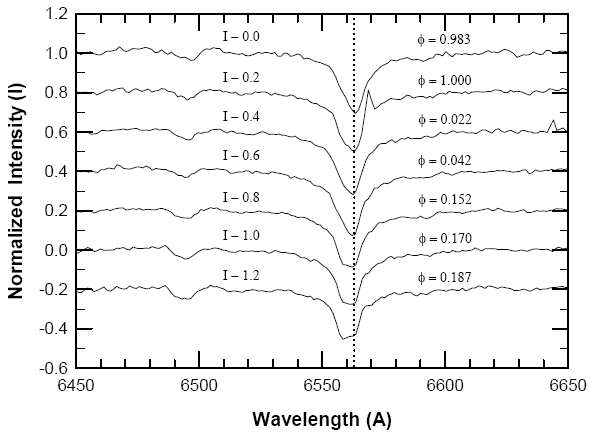
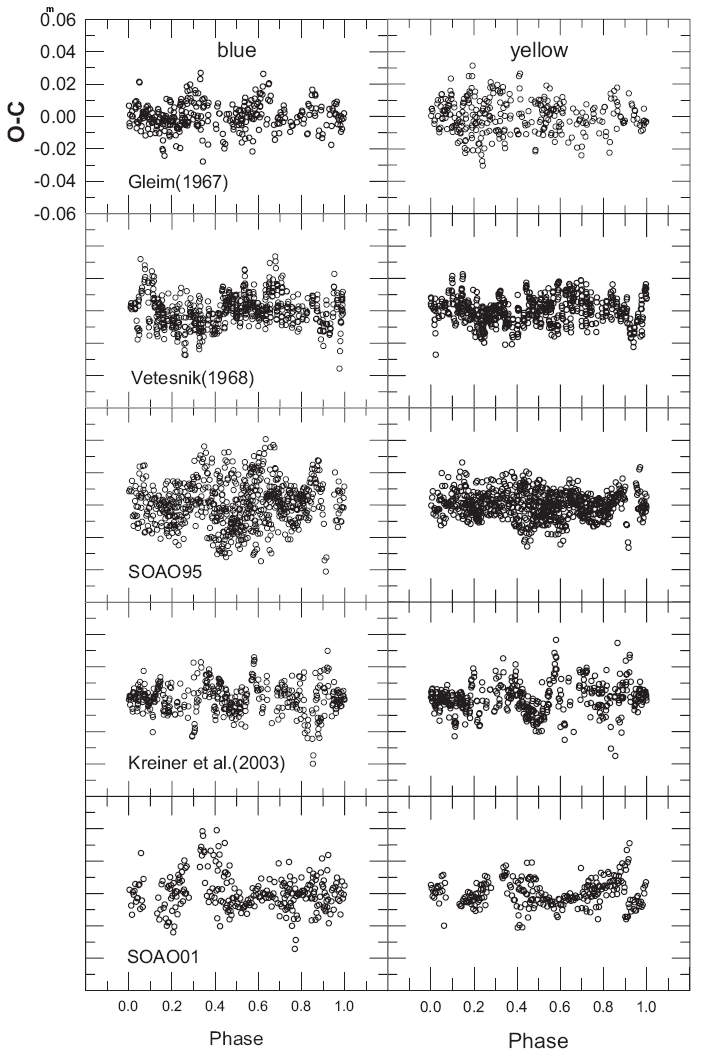
Some of the model light curves did not fit the observed ones as well as desired because of systematic runs of light residuals that were phase- and bandpass-dependent. Such discrepancies have been reported commonly for contact and over-contact binaries and ascribed to surface inhomogeneities, such as photospheric spots (
An initial belief was quickly formed that the 2001BVR residuals could be understood by appeal to one photospheric spot and that the 1963UBV residuals might need none at all. In the case of cool contact or over-contact binaries which have only a small temperature difference, a unique-temperature spot model has frequently been found sufficient to explain light curve asymmetries. For SW Lyn, however, the temperature difference is more than 2,400 K and the situation is different. A spot cooler than the cool star makes a monotonically decreasing contribution to systemic light as wavelength decreases and a spot hotter than the hot star makes a monotonically decreasing contribution to systemic light as wavelength increases.
We first analyzed the 2001BVR light curves incorporating model spots for both modes 2 and 5 and permitting single hot or cool spots on each component star. The hot-spot model on the primary star for each of modes 2 and 5 always gave a smaller weighted sum of the squared residuals and a better fit than other spot configurations. To generalize beyond this special case, we considered all spot possibilities for each seasonal light curve: hot or cool spot(s) on each component star and a hot spot on one star and a cool one on the other. With regard to the possibility of only one star supporting spots, iteration led to improved light curve fitting only if the hot star were spotted. These results are shown at the bottom of Table. 5 and 6 from which it may be recognized that the spot longitude changed significantly over the observing history. No matter what the character of the seasonal spot, its latitude remained distant from the hot stellar equator so it seems unlikely that it can have any reference to low-level mass transfer. As expected, the 1963UBV light curves supported no spots and the 1997BVRI ones were satisfied in the same way.
Light residuals for 10 of the light curves appear in Fig. 7. The six earliest patterns appear satisfactorily at random but that is not true of the last four of them. It may appear at first glance that at least a second spot could usefully be invoked to diminish the systematics for the 1997BV and 2001BV light curves but this does not work. Tests showed that adding a second spot did not improve the fits but rather significant problems arose in the fitting attempts. Ordinarily, one would think that adding more degrees of freedom to a complex function will fit the function closer and closer. This did not happen for these light curves for the simple reason that invoking the four unique spot parameters will not remove the differences among the filtered light curves of a given season. Indeed, the fitting attempts diverged if we attempted to evaluate more than one spot.
Some new understanding is necessary. Because the cool star contributes only a few percent of the systemic light, it seems unreasonable to suppose that its light contribution is the cause of these systemic 2% discrepancies. For this to be the case, a significant fraction of the cool star photosphere would have to be structured in some very complex way. Rather, an easier entry into the problem would appeal to minor structuring on the hot star which dominates the light balance. It is possible that the small discrepancies could be traceable to line radiation anomalies. LRO show velocity anomalies for this star which are clearly phase-dependent but we cannot know if these are accompanied by line strength anomalies. Plausibility for this idea basically rests in the recognition that the blue bandpass has more lines than the yellow or red ones but, even so, the blue part of the spectrum of an A7-8 star still shows intervals of real continuum. We would like to implicate anomalies of continuum radiation in explaining the light curve discrepancies but this leads back to something like the concept of spots. In view of the failure of our attempts at spot elaboration, the argument would be a circular one.
Some advances in understanding this star can be claimed: the 5.8-year period oscillation is assigned to the light-time effect due to the third star; that star’s temperature and luminosity have been approximated; the temperature of the hot eclipsing star has been corrected; and the stellar and orbital geometries are now demonstrably recoverable despite a certain range of light curve complexities. At the same time, some failures and limitations are conspicuous: the evolutionary and binary dynamical state of the close binary and triple systems are not de-
fined; the 34-year period modulation does not have an identifiable cause; the characterization of the star spot is only a partial formal success; and final light curve residuals are not always so small nor so random as desired. This is not a particularly impressive record of accomplishment but in the following final paragraphs we offer a few speculations.
Lynx is a small constellation not near the galactic plane and so there may possibly be objects within its boundary which have some uncommon property with respect to the usual Pop I close binaries. We assume here that the triple barycentric velocity is +32 km/s, but the exact value is not very significant. With the conventions and formalism of Johnson & Soderblom (1987), the U, V and W components of the velocity of SW Lyn become -51 km/s (away from the galactic center), -25 km/s (in the solar antapex direction) and -19 km/s (toward the Milky Way plane), respectively, without correcting for solar motion. These are not small velocity components and they suggest an orbit not shared by most other close binaries. It is worth wondering if the third star is an object captured during a close approach of the eclipsing pair to the galactic bulge.
What might be done in the near future? This object is not a detected radio or X-ray source so it is possible that one has already learned most of what it is capable of revealing. There seems no obvious need for new light curves until a new maximum of the long-term period variation is attained but new radial velocity curves might usefully be accumulated when the eclipsing binary and the third star approach their alternating greatest velocity separations. Probably the best use of observing time is diligent attention to minimum timings for both eclipses, and this suggests that there is another way to look at the confusing long-term oscillation. Its semi-amplitude is only 0.0043 days, thus 0.0067 in phase. The eclipses are seen to be complete, and a time excursion of this dimension translates into only about 0.002 in magnitude or light scale. Even a small asymmetry of the eclipse branches is sufficient to lead to an apparent deviation of a minimum timing from the value predicted by the linear and 5.8-year terms of the ephemeris. An inhomogeneity of photospheric brightness not on the stellar line of centers can easily create such an apparent time deviation so one may not need to seek a dynamical explanation for the long-term oscillation if cycling of eclipse branch asymmetry can be established. Obviously, such a discovery would not lead directly to an understanding of the seeming long-term period variation but it could focus ideas on how to distinguish among a stellar magnetic cycle or gas streaming episodes or convective motions in the envelope of the hot star.