Increasing demands on the safety of public train services have led to the development of various types of security monitoring systems. Most of the surveillance systems are focused on the estimation of crowd level in the platform, thereby yielding too many false alarms. In this paper, we present a novel security monitoring system to detect critically dangerous situations such as when a passenger falls from the station platform, or when a passenger walks on the rail tracks. The method is composed of two stages of detecting dangerous situations. Objects falling over to the dangerous zone are detected by motion tracking. 3D depth information retrieved by the stereo vision is used to confirm fallen events. Experimental results show that virtually no error of either false positive or false negative is found while providing highly reliable detection performance. Since stereo matching is performed on a local image only when potentially dangerous situations are found; real-time operation is feasible without using dedicated hardware.
Trains are an important means of transportation in modern metropolitan areas. The top priority goal of railway systems is to ensure safe departure and arrival of passengers.Screen doors or detection mats may be used in subways to prevent falling accidents; however, the cost of installation is very high, and the screen door is not appropriate for outdoor stations. A number of vision based surveillance systems have been proposed to confirm safe railway operation [1-8]. These systems are focused on measuring the level of crowding on the passenger platforms of train services. If overcrowding is detected, the system will notify the station operators to take appropriate actions to prevent dangerous situations such as people falling off or being pushed onto the tracks [9-14]. Background subtraction is commonly used to locate passengers and thereby to estimate the crowd density [1-5, 7] Edge information may be used to measure the regions occupied by passengers [1,4]. In addition, motion information may be utilized to detect and track moving objects in Ref. [5,6,8]. To detect abrupt and dangerous situations, object tracking has been implemented using a combined method of background subtraction, edge detection and motion detection [9-14].An infrared camera was found to be useful to locate passengers [10]. A public dataset known as CREDS [15]has been provided to encourage the development of surveillance systems for monitoring train stations.
The visual surveillance system based on crowd estimation may be useful for detecting potentially dangerous situations.The system, however, may yield too many false alarms because it is not designed to determine critically dangerous situations such as (1) when a passenger falls from the station platform, (2) when a passenger walks on the rail tracks, and (3) when a passenger is trapped by a door of a moving train. Especially passengers who have fallen from the station platform cause serious safety problems.
The track zone is initially set up to detect dangerous situations. If object evidence obtained by either background subtraction or motion tracking, indicate that the object is inside the track zone, an alarm is generated. In the 2D image analysis, the existence of the object evidence inside the dangerous region does not necessarily mean that the object has really fallen down to the railroad tracks since 3D coordinates cannot be retrieved from a 2D image. It is well known that 3D depth information can be computed using stereo vision [16-18].A stereo camera was adopted in Ref. 19 to verify that a passenger has fallen. Also the use of stereo cameras has the advantage of being capable of removing unexpected false alarms due to the change of operating conditions such as shade and reflected light.Matching stereo images is a time-consuming process, so that dedicated hardware is required for real-time processing.For example, pipeline processors were employed to compute the 3D depth information in Ref. [19].
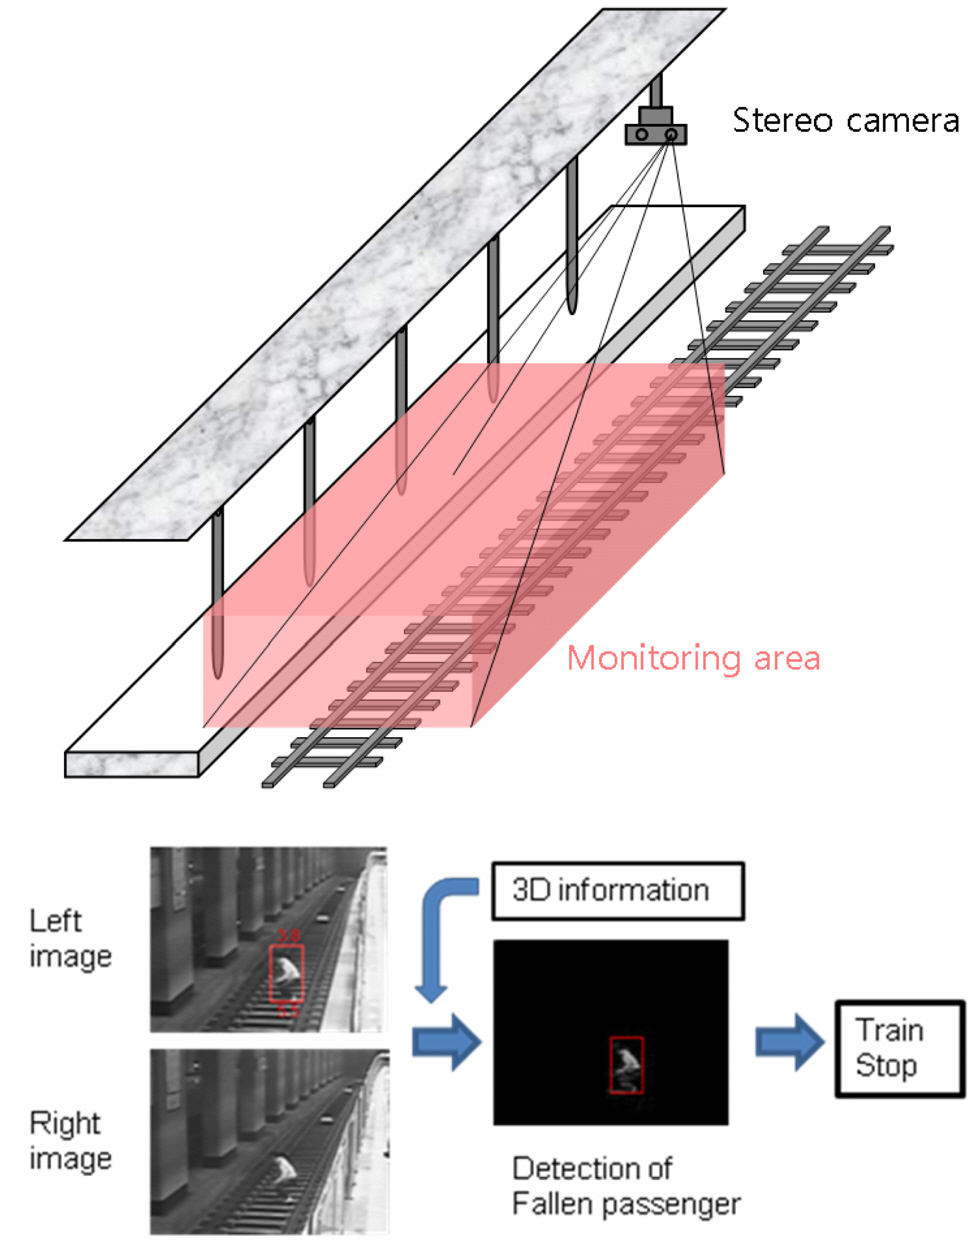
We present a new scheme for detecting critically dangerous situations in real-time without using additional hardware.A stereo camera is installed below the ceiling of the platform to view the railroad region as illustrated in Fig.1. Image sequences from one channel (either left or right)are processed to find movement information. Once movement evidence is found inside the danger zone, the image of the evidence region is matched with the image from the other channel. The depth information obtained by the stereo matching provides a criterion to decide whether the object has really fallen down to the railroad tracks. Since the stereo matching is performed on a local region only when a suspicious falling event has occurred, real-time processing is possible without using expensive hardware. Also the use
of 3D information permits highly reliable performance. We describe the details in the following sections.
II. ORGANIZATION OF THE PROPOSED METHOD
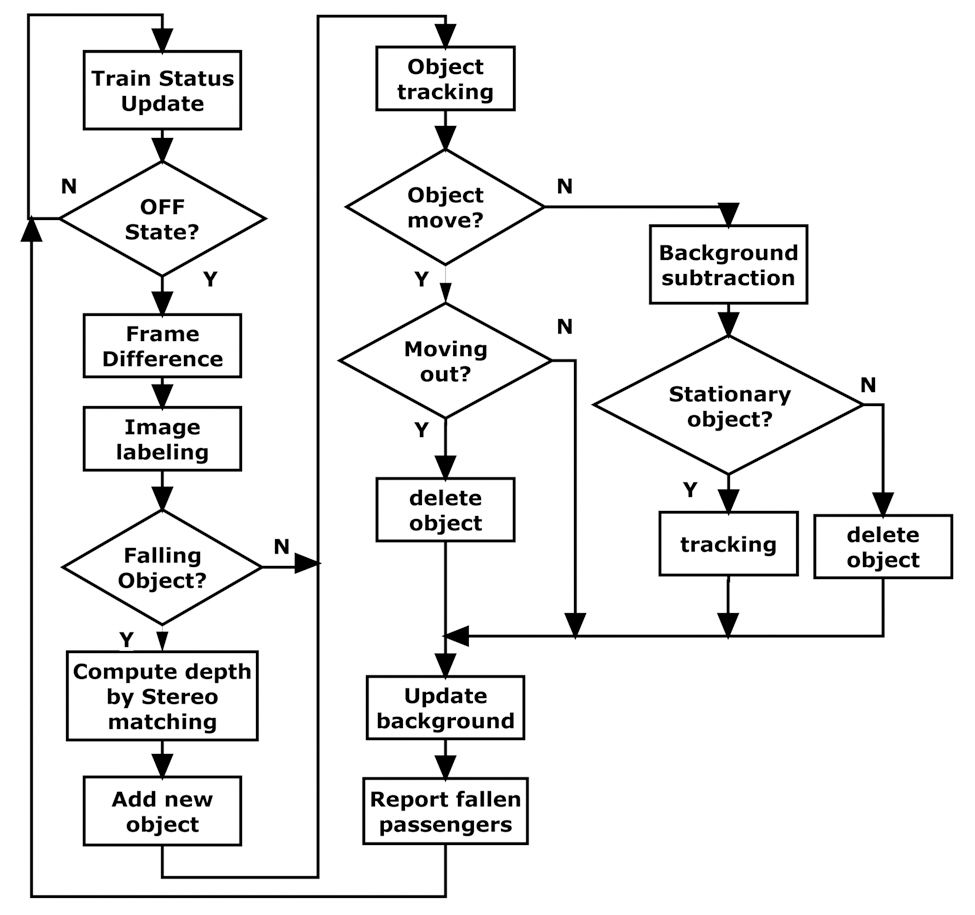
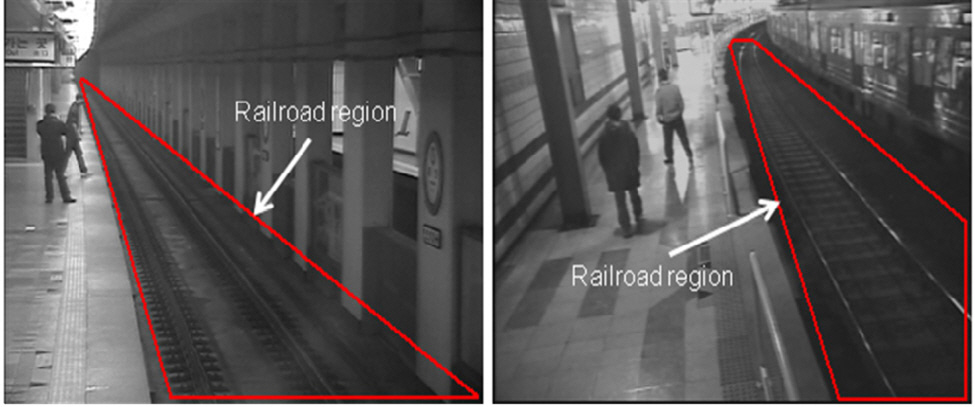
Overall scheme of our method is shown in Fig. 2. The monitoring region is set up to cover the railroad platform as pictured in Fig. 3. The monitoring system is aimed at detecting passengers and large objects in the danger zone automatically to ensure safe operation of train services.Security monitoring is required only when the train is not present on the railway platform (i.e., OFF state). The train ON and OFF states are determined by a shape analysis of the railroad platform. In the OFF state, frame difference information is utilized to detect objects falling from the passenger platform
Falling objects are detected by finding the region moving into the railway platform at successive frames. To remove false alarms associated with small objects, big objects having
considerable three dimensional volumes are discriminated from small objects by using stereo vision. Depth information is retrieved by stereo matching. If the depth is sufficiently deep and the three-dimensional volume is sufficiently large,the detected object is recorded as an obstacle that might cause an unexpected accident; thereby an alarm is reported and the object is tracked at the next frames until it disappears. If the object falls down to the floor, further movement information may not be found in the next frame.To track such a stationary object, we use the background image. If clear evidence of the object obtained by the background subtraction is found at the object region, the object is determined to remain at the same location. Otherwise the object is deleted. If a fallen passenger climbs up to the passenger platform, the alarm should be reset automatically.To realize such functionality, the object moving toward the passenger platform at successive frames is deleted. We describe the details in the following sections.
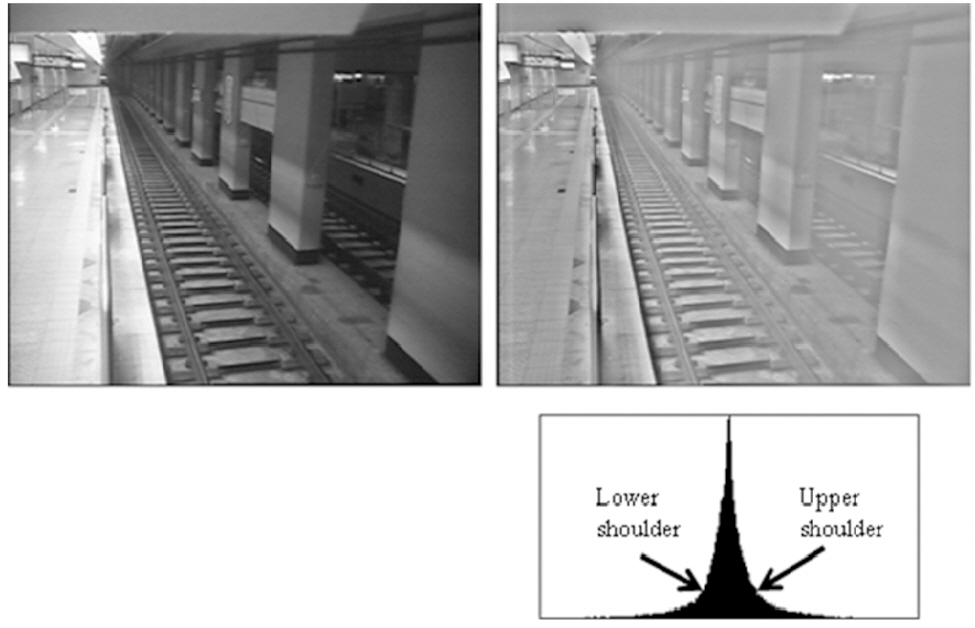
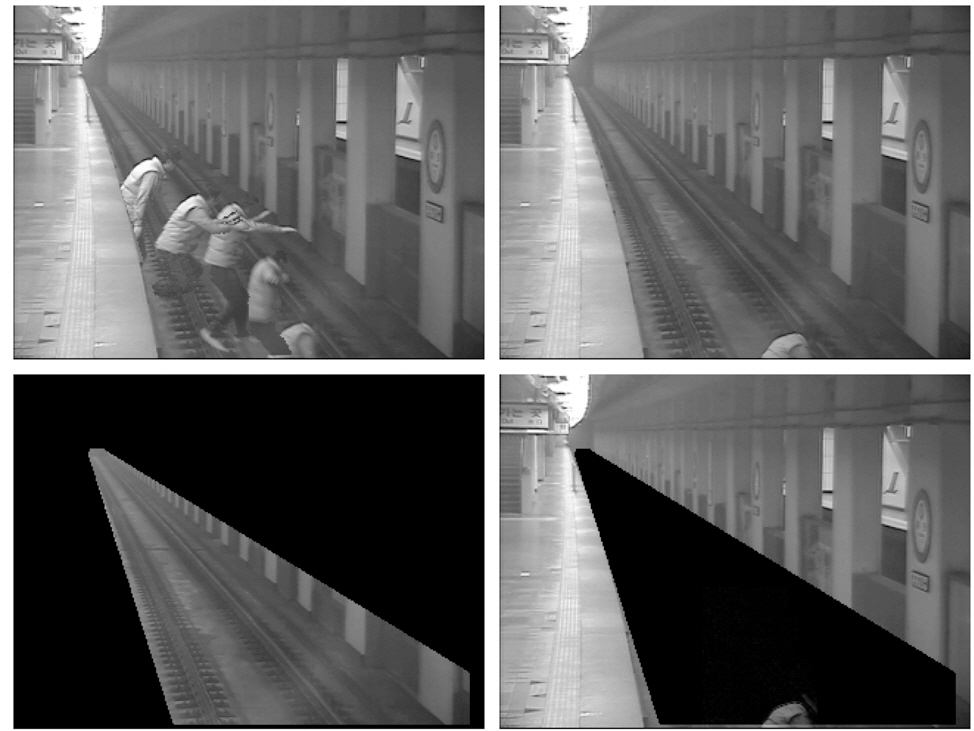
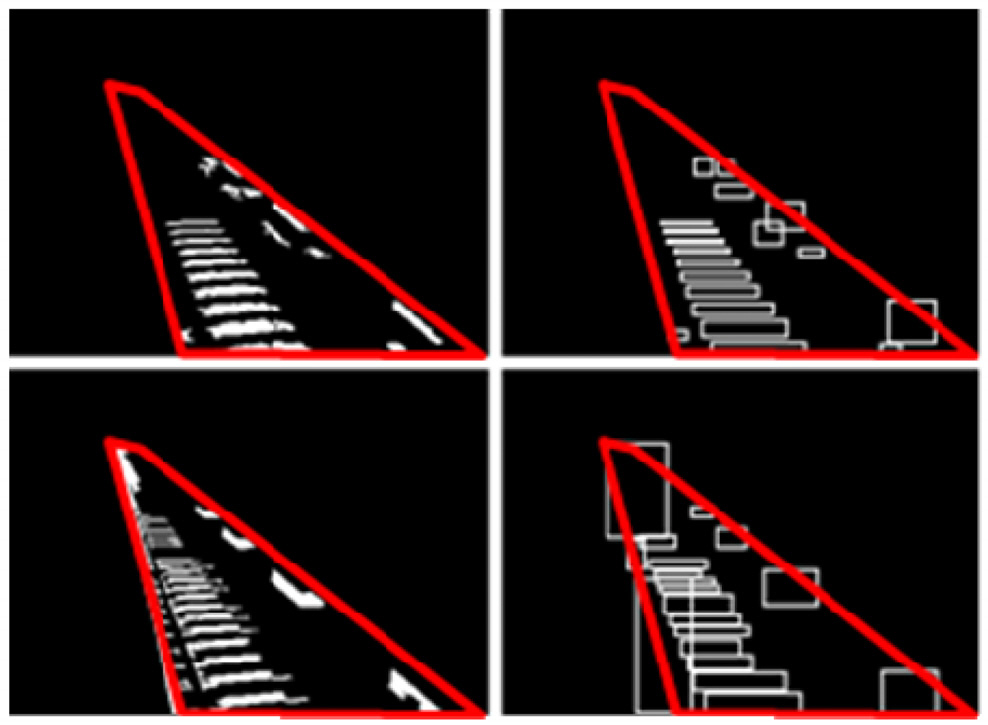
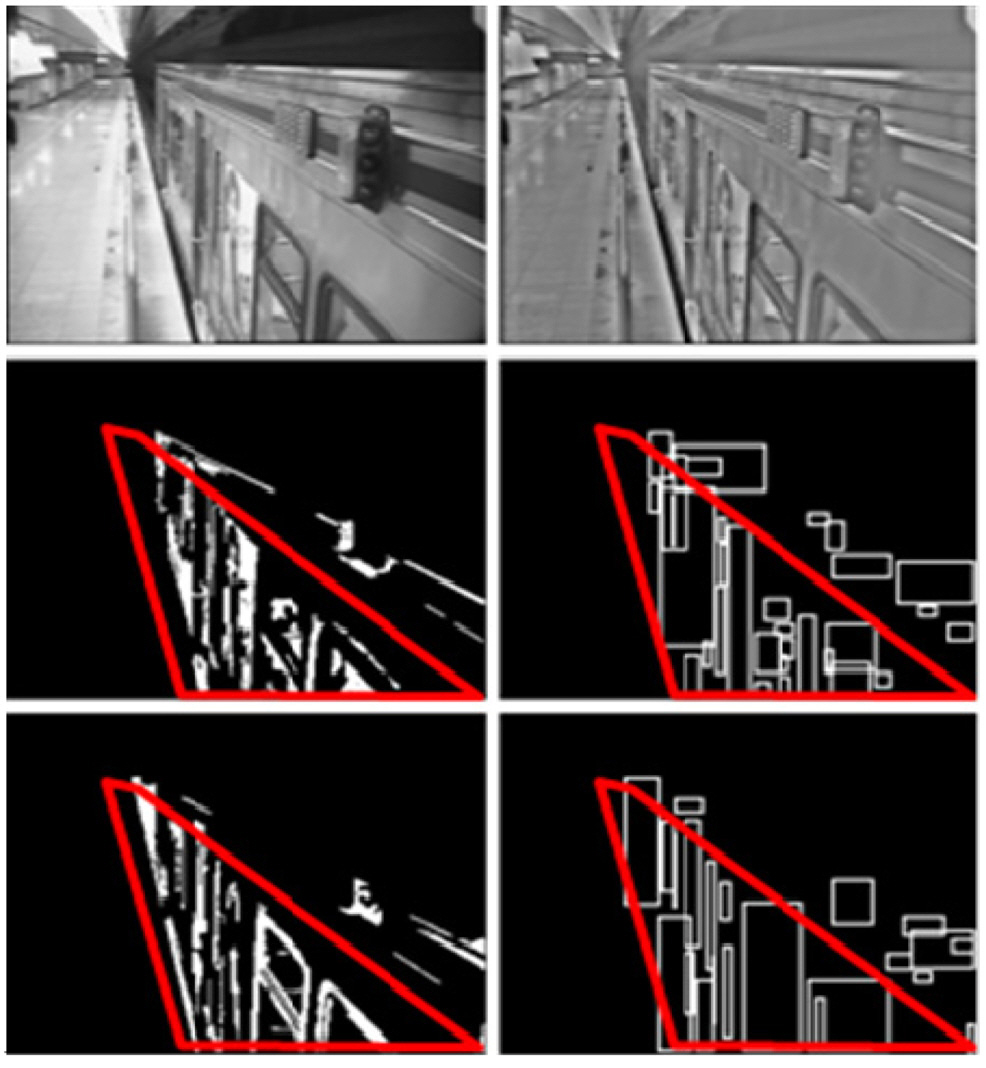
The monitoring region of the OFF state has unique image characteristics different from the ON state. A number of railroad timbers are visible in the OFF state, while a number of door evidences are found in the ON state. To retrieve the structural evidences both bright and dark regions are extracted from the DC-notch filtered image.The local change of illumination conditions can be compensated by the DC-notch filter; thereby the histogram of the filtered image is characterized by a unimodal distribution as shown in Fig. 4. Bright evidence is subtracted by binarizing the filtered image with the threshold at the upper shoulder of the histogram. Also dark evidence can be extracted using the lower shoulder of the histogram.Railroad timbers are characterized by horizontally long regions after the image labeling. The doors and the windows of the train exhibit vertically long evidences.Examples of the evidences are shown in Fig. 5 and Fig. 6
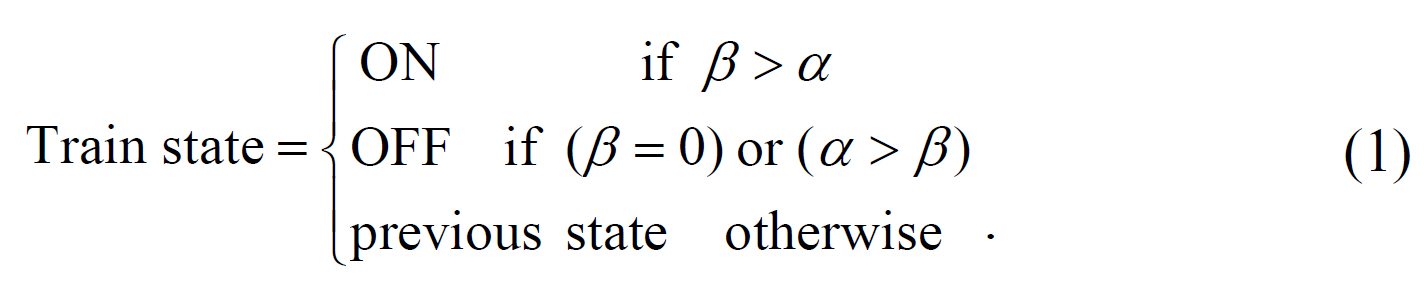
for the case of the OFF state and the ON state, respectively.It is to be noted that virtually no vertical evidence could be found in the OFF state. Let α denote the number of horizontal evidences in the railroad region and β the number of vertical evidences. Based on this observation,the train state is updated by the following simple rule:
IV. DETECTION OF FALLING OBJECTS
Movement information obtained from the frame difference may be too sensitive to the object motion. Thus, we use accumulated frame difference defined by
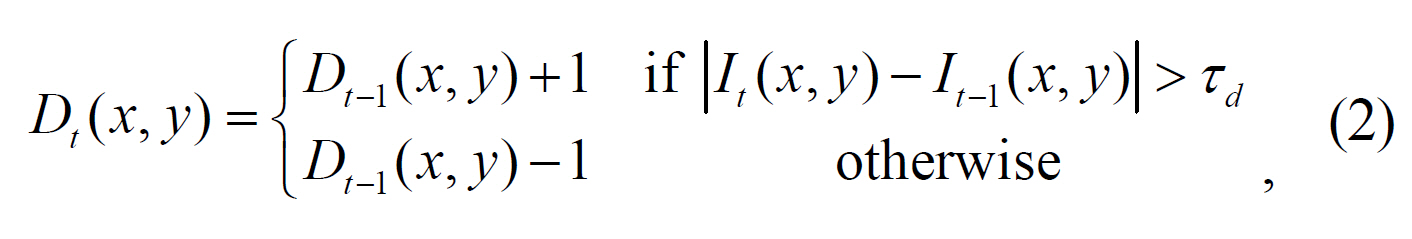
where
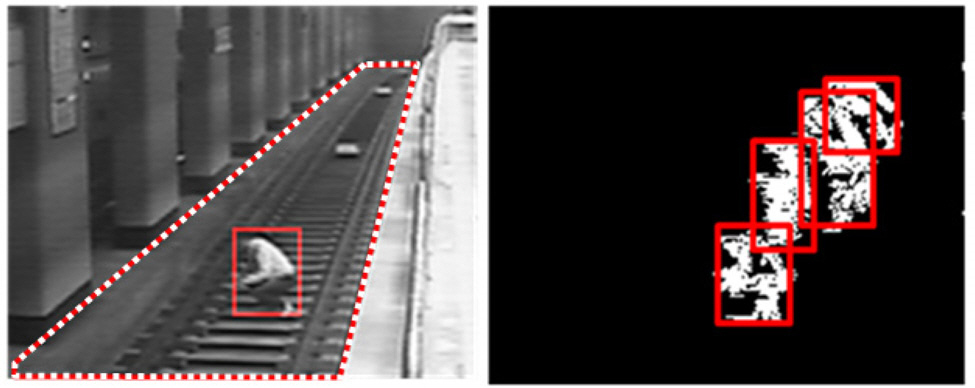
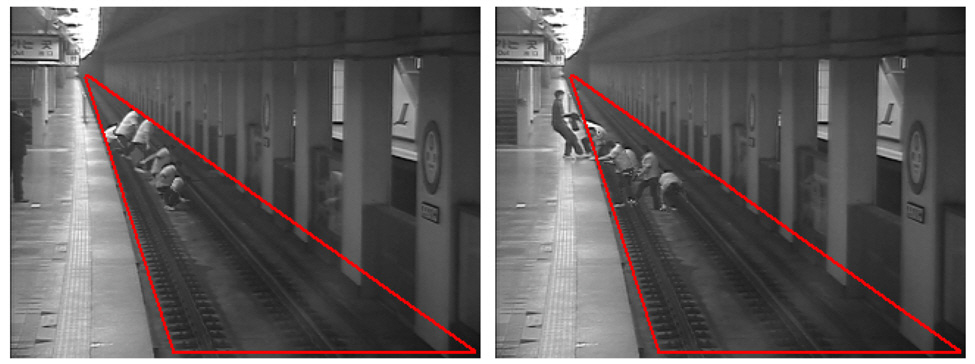
If a movement region is enclosed in the railroad region(illustrated by the dotted boundary in Fig. 7), the object may be determined to be fallen down to the floor. Let
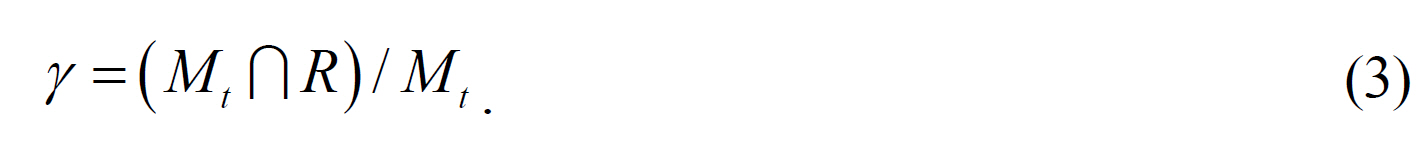
Specifically, the object is determined to be fallen when
V. USE OF STEREO VISION AND BACKGROUND IMAGE
The detection of falling objects using the movement information alone may cause unexpected false alarms when passengers on the platform loiter near to the boundary of the railroad region. Since 3D information is not available in the two-dimensional image, it is not feasible to confirm that an object really fell down to the floor. To remove this false alarm, the 3D depth information is retrieved using the stereo vision.
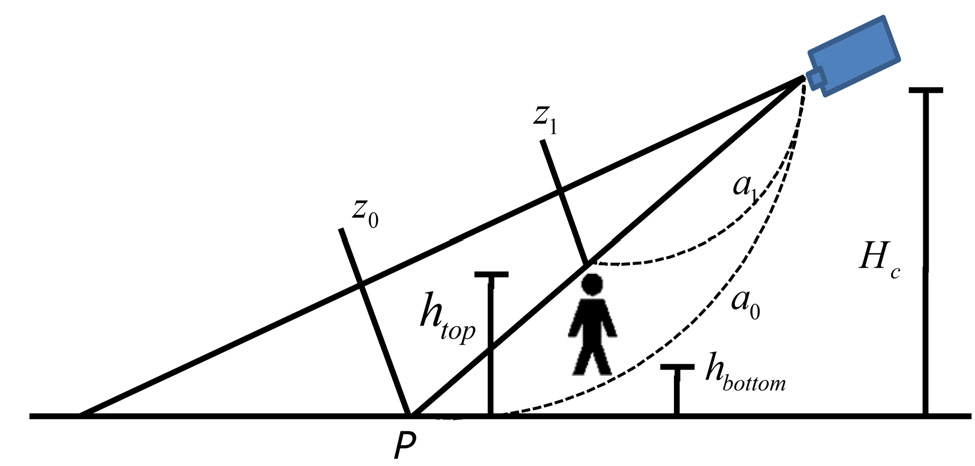
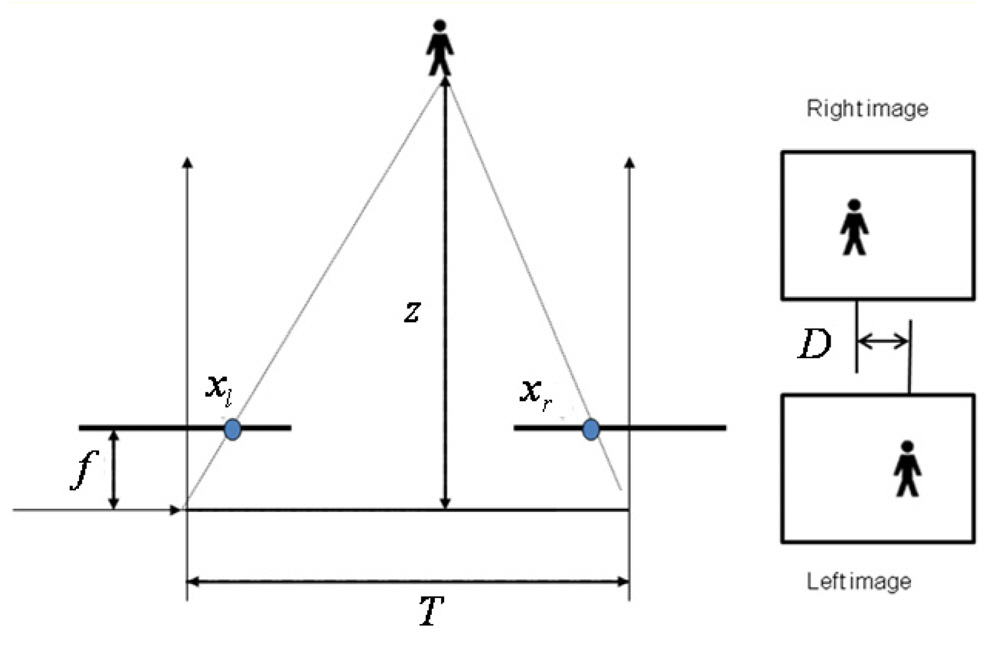
A stereo camera is installed below the ceiling where the entire rail track can be viewed as shown in Fig. 1. It is well known that 3D depth information can be retrieved by computing the correspondence between left and right images. Let
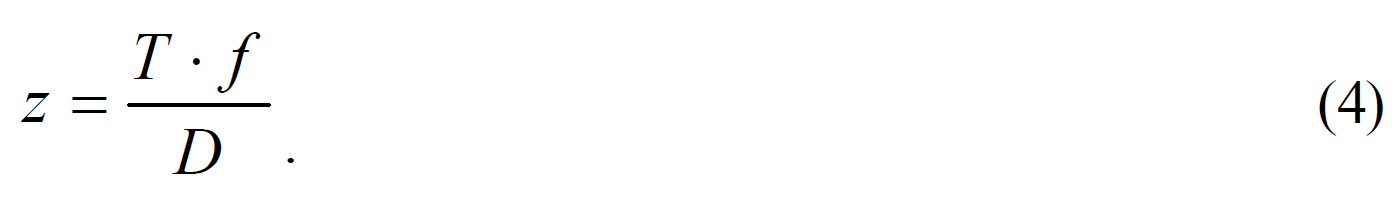
Once the 3D depth is computed by Eq. (4), the top vertical coordinate
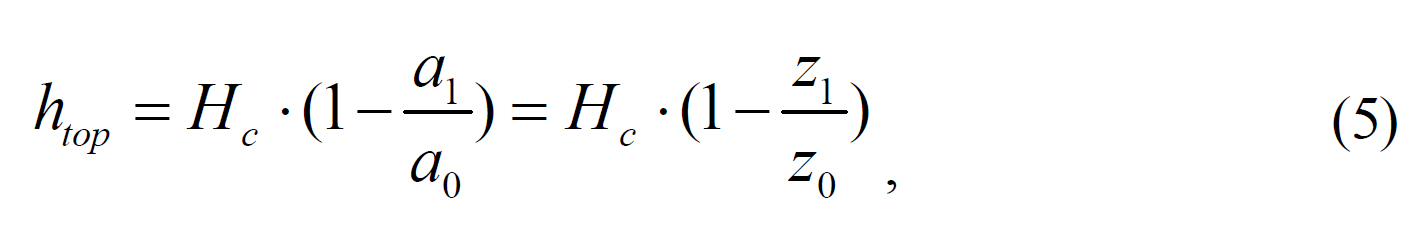
where
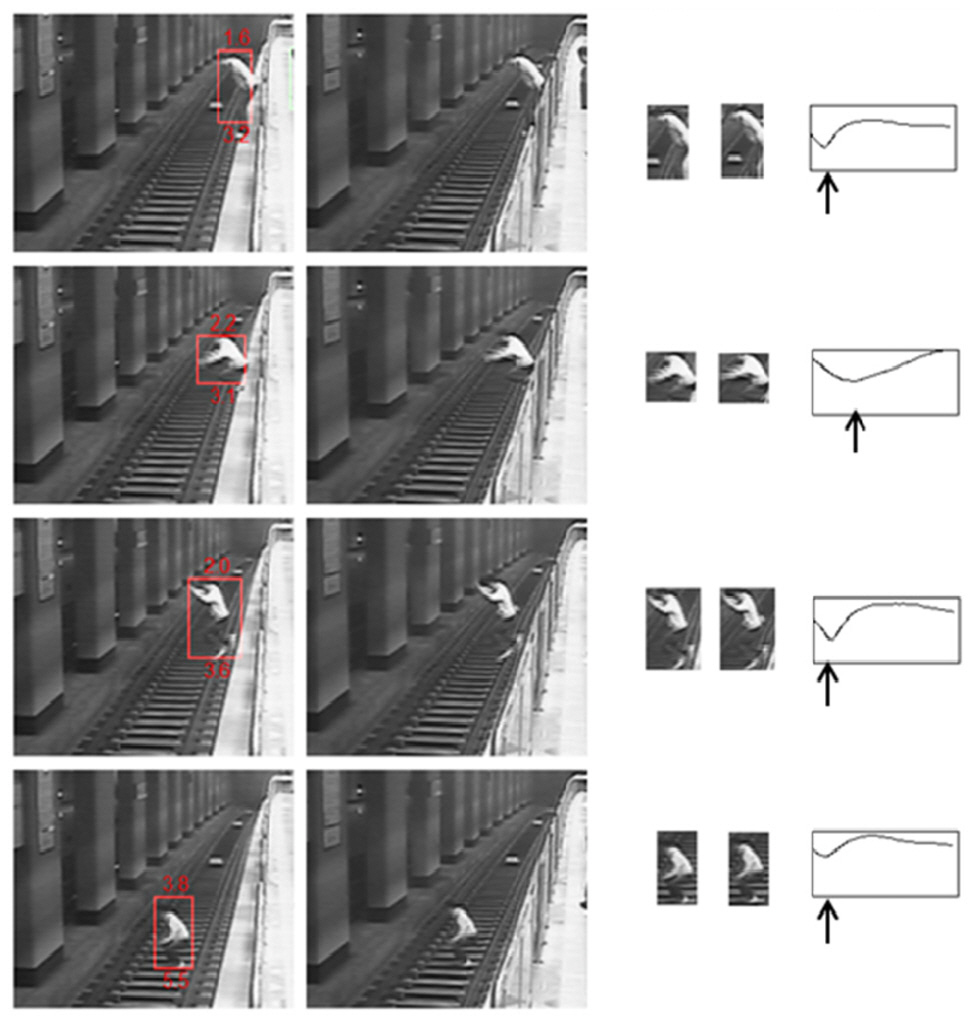
The use of 3D information is illustrated in Fig. 11,where the images in each row show left, right images,matched images, and the graph of disparity matching score.
The score at the displacement
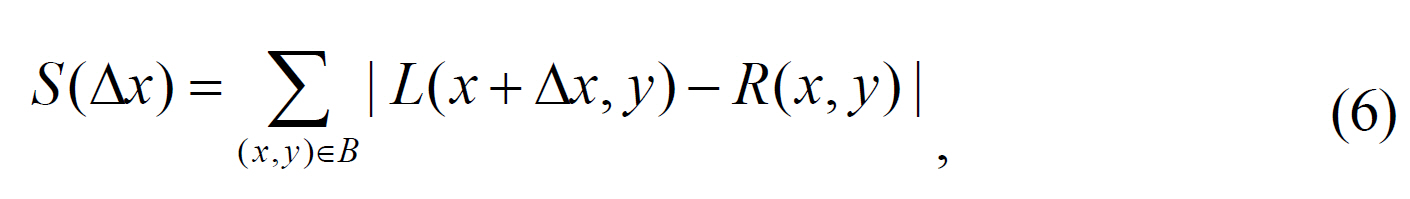
where
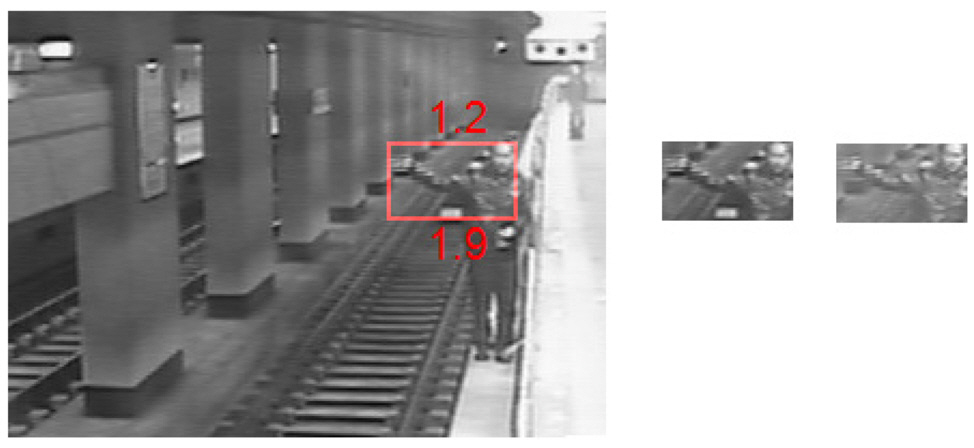
Without the 3D information, passenger movement near to the edge of the platform may result in false alarms as exemplified in Fig. 12. The 3D depth computation shows that the vertical distance at the bottom of the object rectangle is 1.9 m. The distance is not enough to confirm the fallen object, thereby the alarm is rejected.
To suppress the alarms due to small falling objects such as baggage or newspapers, information of the 3D volume is required. Unfortunately, however, the 3D volume acquisition is not feasible in the framework of stereo vision.Instead, 2D object size information is utilized as the following: The distance
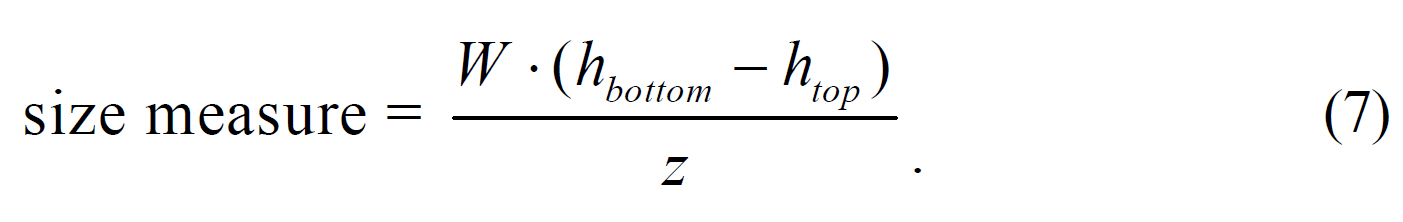
If the size measure of a falling object is smaller than a predefined threshold, the alarm is ignored.
When a passenger falls down and stops movement, the frame difference will disappear. In this case the object rectangle is updated using the background subtraction instead of the movement tracking. Each pixel of the background image is updated only when the pixel is neither associated with the movement, nor included in the object rectangle.
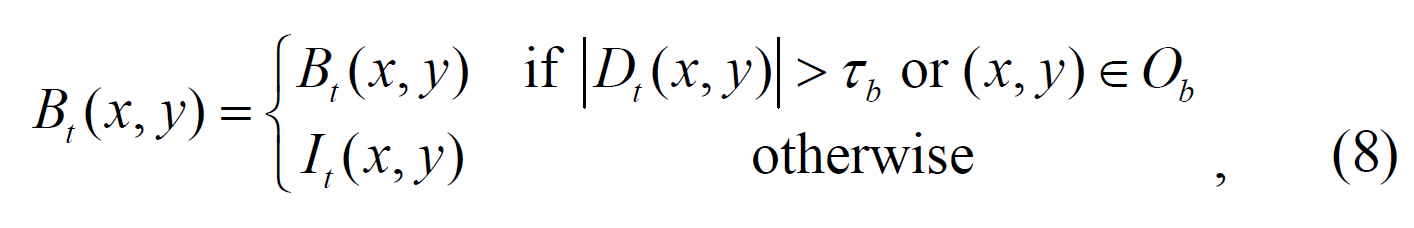
where
rectangle remains unchanged, otherwise it is deleted.
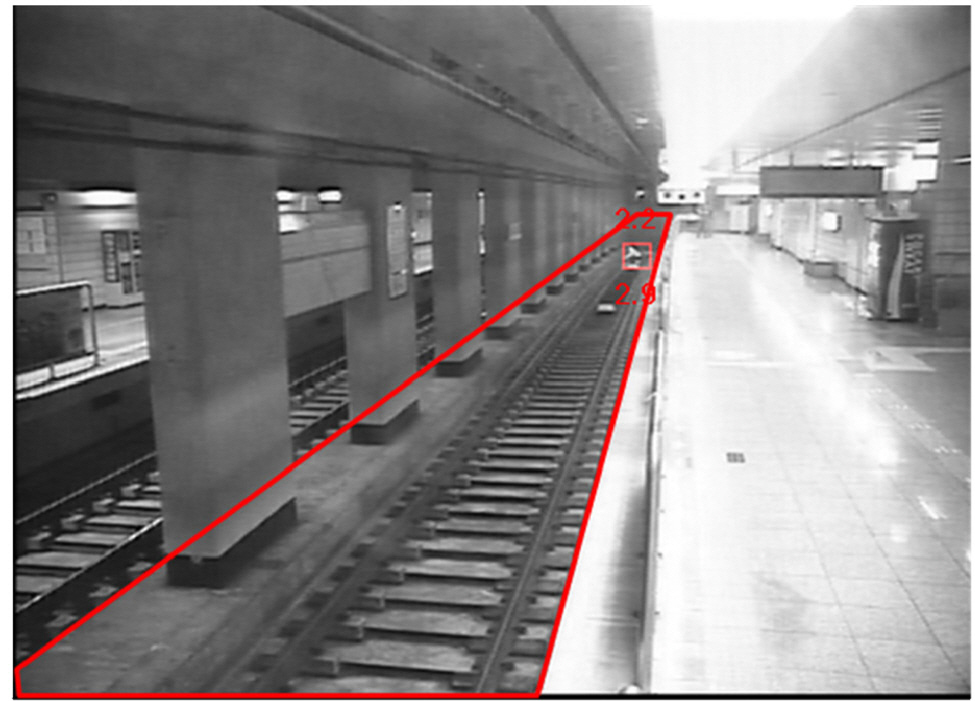
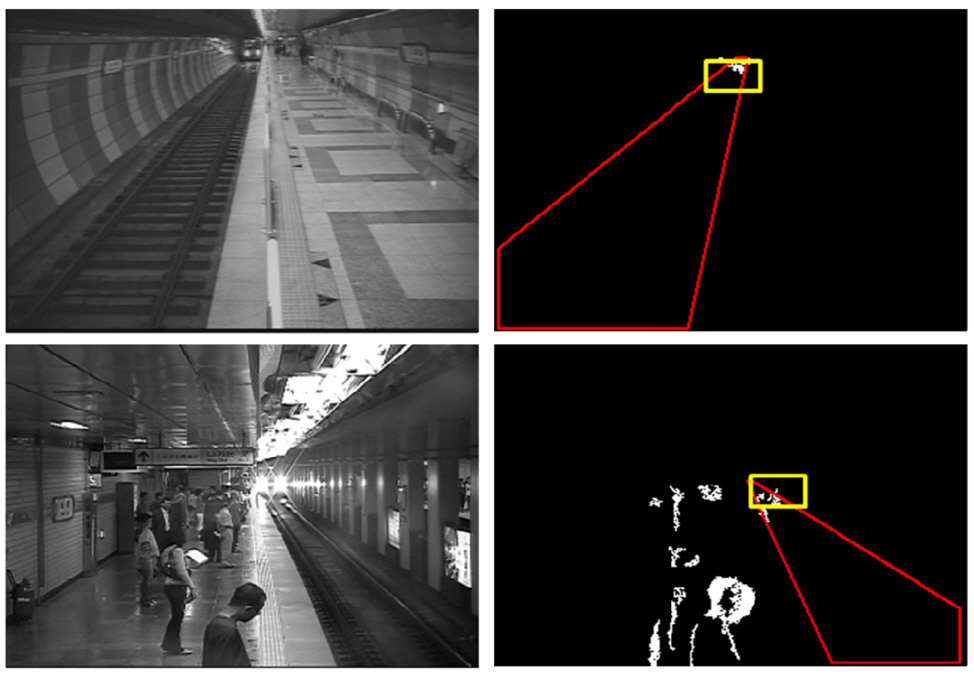
The proposed scheme was implemented in Visual C++,and tested on a Pentium PC (Core™ 2 Duo, 3.0GHz). The image resolution is 640×480. In the epipolar geometry,there exists a vanishing point. Since objects near the vanishing point do not yield significant disparity, the three-dimensional acquisition using the stereo vision may cover only a limited angle of view. Since reliable 3D depth information is required to suppress false alarms, the entire platform cannot be covered using a single stereo camera. Fig. 14 shows an example of the computed depth information of the object far from the stereo camera. The vertical distance is computed as 2.9 m, which is not enough to ensure detecting the fallen object. The maximum distance of coverage was found to be 35 m in our experiments in subway stations. A number of stereo cameras need to be installed depending on the length of the platform.
When a train enters into the station ,a bright headlight may cause evidence of irregular movement, yielding false alarms. To prevent a train from being mistaken for a fallen passenger, the frame difference near the top of the railroad region is ignored as illustrated in Fig. 15.
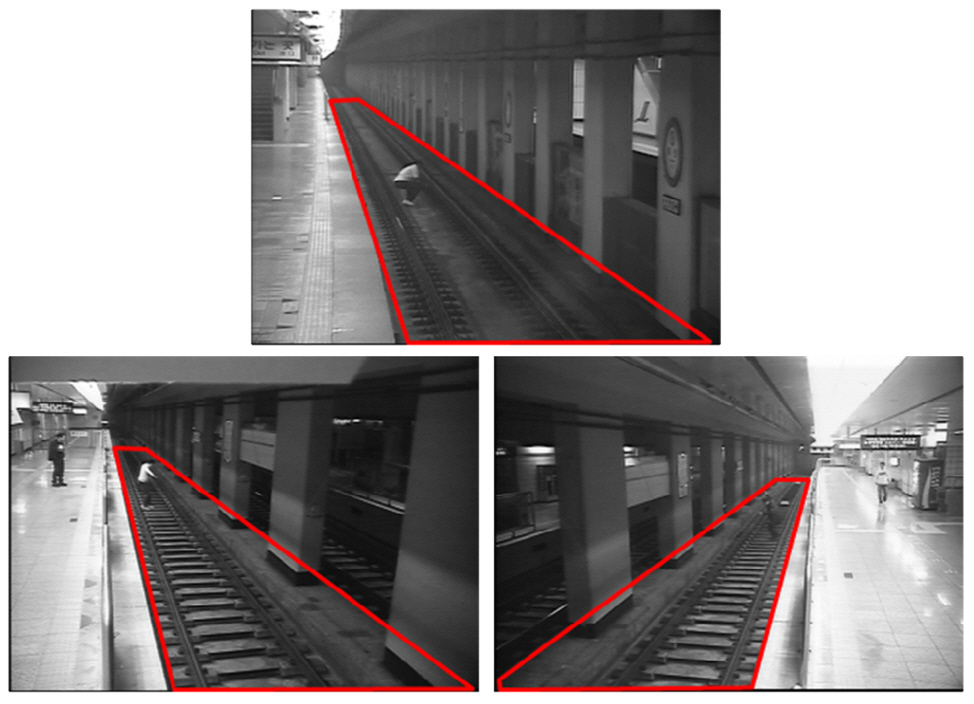
Our security monitoring system was installed and tested at three subway stations in Seoul, Korea. The test environment is illustrated in Fig. 16. Fallen passengers are rare, so that we created an intentional scenario for fallen passengers in subway stations. A passenger falls down to the floor, moves around the track, and then climbs up to the passenger platform. 10 falling events were produced at each station. Also passengers performed loitering and waiving their hands near the boundary of the platform, as shown in Fig. 12. The video sequences thus created were used to test our method.
All of the 30 events of falling down and climbing up
were detected correctly regardless of the distance within 35m. Also, moving passengers who had fallen were tracked correctly until they climbed up to the platform.False alarms due to the passengers loitering near the platform edge were not reported.
For a long term test in the real operation of train services, our system was installed in one of the subway stations in Taegu, Korea (November, 2009), and has been tested. False alarms that might be caused by small objects such as falling baggage, garbage, or newspapers, have not been reported yet. Thus far virtually no error of either false positive or false negative was found. Further tests will be performed and reported before commercial use of our system.
A limitation of our approach would be the possibility of a false alarm when a large piece of paper falls over onto the railroad. In this case, a false alarm might be reported temporarily, since the 3D volume estimation is not feasible with stereo vision. After falling down, however, the alarm will be reset automatically because the object height will be measured as too small.
A new scheme of security monitoring systems for railroad stations is presented. The method is composed of motion-based detection of dangerous situations followed by verification using stereo vision. The use of 3D depth information is shown to be useful in suppressing false alarms that might cause unwanted interruption of train services. Since stereo matching is performed on local imagse only when potentially dangerous situations are found, the processing time is fast enough for real-time operation.