The acoustic properties of anti-inflammatory egonol were investigated by using micro-Brillouin scattering spectroscopy, by use of a 6-pass tandem Fabry-Perot interferometer and an optical microscope specially modified for spectroscopic purposes. The measured Brillouin spectrum was composed of a central peak centered at zero and a Brillouin doublet arising from the longitudinal acoustic waves, i.e. propagating density fluctuations. For the first time, the glass transition of egonol was identified to be about 5℃ at which the Brillouin peak position and the half width showed abrupt changes. The substantial damping of acoustic phonons of egonol near the glass transition temperature indicated that the contribution of internal relaxation processes such as small-amplitude librations of side chains to the damping of acoustic phonons may be substantial depending on the internal structure of molecules.
Brillouin spectroscopy has been a conventional experimental method for studying low-energy excitations such as long-wavelength acoustic phonons, spin density waves, and soft modes in condensed matter. Since the energy scales of these excitations are located in the frequency range of GHz ~ THz, conventional grating-based spectrometers cannot be used to probe this low-frequency range. The Fabry-Perot etalon is the most suitable optical component for this purpose and comprises an essential part in the Brillouin spectrometer [1, 2]. The etalon, consisting of two parallel mirrors with high reflectivity, transmits light when the mirror spacing is a multiple of half of its wavelength. Scanning the mirror spacing with, for example, piezoelectric devices enables one to measure a certain frequency range of a light spectrum. The one-pass Fabry-Perot interferometer(FPI), along with the advent of coherent laser light sources, played an important role in the early history of Brillouin spectroscopy, but the measured spectra were characterized by a low contrast and a narrow free spectral range (FSR). The development of a multi-pass tandem Fabry-Perot interferometer (T-FPI) made it possible to get a contrast higher than 109 and a wide FSR up to 1 THz [3].
However, there have been two deficiencies in applying T-FPI to condensed matter. First, it takes a relatively long acquisition time to get a spectrum due to the limited usage of the scattered light in T-FPI. This makes it almost impossible to monitor acoustic properties in a real-time manner. Second, it is difficult to investigate small samples of which the size is the order of ㎛. The first problem can be overcome by using the so-called angular dispersiontype Fabry-Perot interferometer combined by an area detector [4, 5]. The second difficulty can be solved by adopting an optical microscope in the T-FPI [6]. By using this micro-Brillouin spectroscopy, it is possible to probe microheterogeneity of condensed matter [7], surface elastic waves on inhomogeneous opaque materials [6], or eigenvibrations of nanospheres [8]. Recently, compact temperature chambers developed for optical microscopes are commercially available. They can be used to cover a wide temperature range from liquid He-temperature to higher than 150 0℃. The combination of the micro-Brillouin spectroscopy and these temperature stages opens a new possibility for investigating elastic properties of various types of condensed matter with various thermal histories.
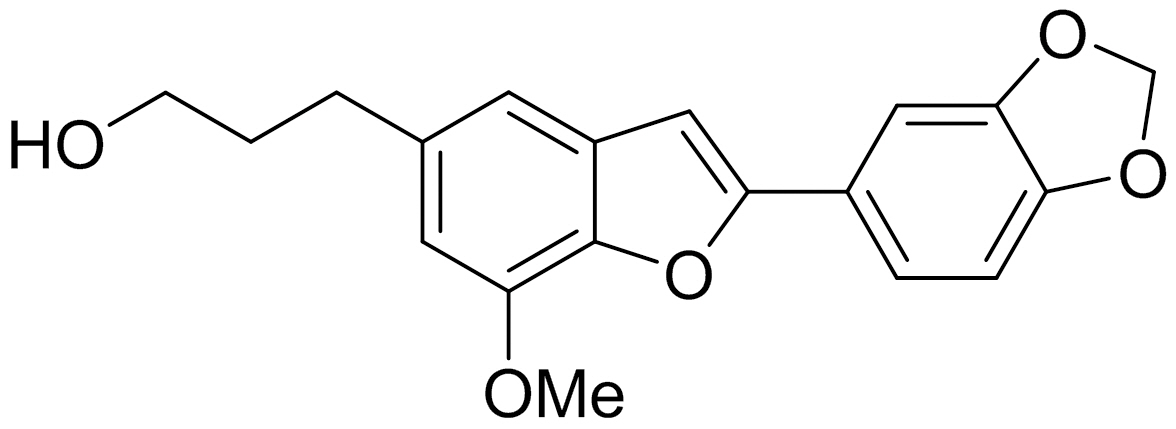
The present study is devoted to reporting the setup of the micro-Brillouin spectrometer and its application to the glass-transition process of anti-inflammatory egonol (5-(3-hydroxypropyl)-7-methoxy-2-(3,4-methylenedioxyphenyl)be nzofuran) molecules. The study of glass transitions of pharmaceutical materials such as egonol has attracted great attention from the viewpoint of fundamental physics as well as applications[9]. The glass transition is one of the fundamental phenomena that are not understood clearly due to various structural and dynamic complexities [10-11].The detailed studies of various materials including pharmaceuticals may give us more insight into universal features of the glass transition. In addition, glassy pharmaceutical materials have recently been studied intensively because a vitreous state is regarded as more effective than the crystalline state due to the higher dissolving speed and thus higher bioavailability [9]. Egonol has been known to show variety of biological properties including insecticidal,fungicidal, antimicrobial, antisweet, antiproliferative, cytotoxic and antioxidant properties. However, systematic investigation of its physical properties, including its elastic properties,is quite incomplete. The present study reports on the change in the elastic properties during the glass transition process of egonol and determination of the glass transition temperature for the first time by using high-resolution micro-Brillouin scattering spectroscopy.
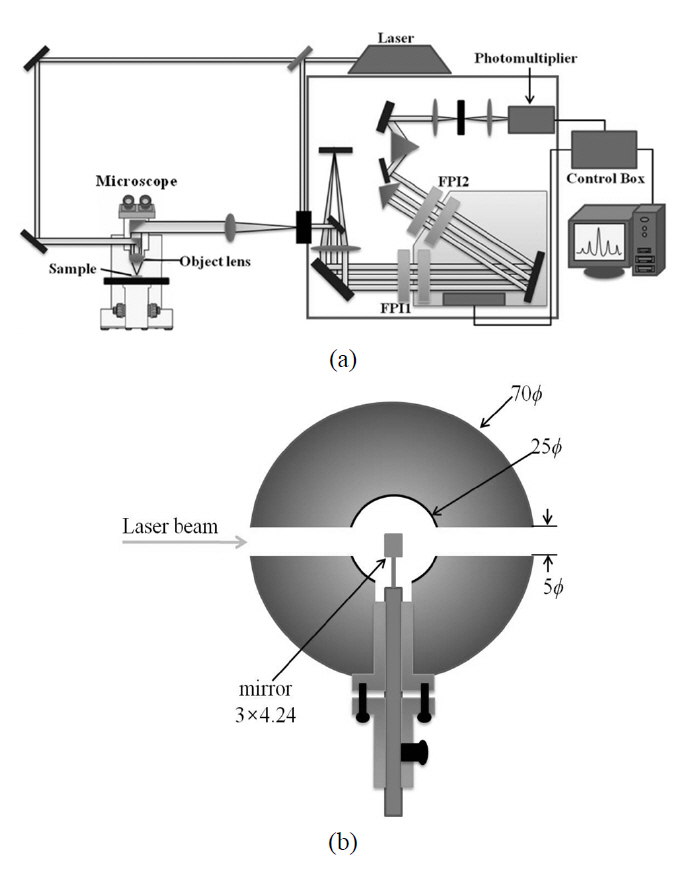
Figure 1 shows the schematic diagram of the micro-Brillouin spectrometer consisting of a 6-pass tandem Fabry-Perot interferometer (JRS Sci. Instrum.) and an optical microscope (BX41, Olympus). The T-FPI consists of two FPIs (FPI1 and FPI2) which are inclined to each other by a certain angle, resulting in slightly different FSRs. Complete dynamic synchronization between the two FPI’s is maintained over a large scanning range. This condition enables one to suppress neighboring transmission peaks other than the synchronized one, and thus to effectively increase the FSR up to 1 THz [3]. The interferometer is scanned by means of a piezoelectric transducer. In addition, the distance between the two mirrors is sensed using a capacitive displacement transducer. In order to check the correctness of the frequency scale of the transmission spectrum, one of standard samples of which the correct sound velocity is reported is selected, depending on FSR. The measured Brillouin spectrum is used to calculate the sound velocity,which is compared to the exact value. In the present case,the Brillouin spectrum of high-purity ethanol (purity of 99.9 %) was measured at 24℃, and the calculated sound velocity was found to be consistent with the literature value. Since the incident light passes through these two FPIs 6 times before it reaches the photomultiplier tube as is shown in Fig. 1(a), the contrast can become extremely high, much higher than 109.
A commercially available microscope was specially modified to carry out the micro-Brillouin scattering experiment. A metal hollow cylinder of 70-mm diameter and 40-mm thick was inserted between the objective lens and the binocular part of the microscope. This cylinder has three side holes with a diameter of 5 mm, through which a small coated mirror of 3.00×4.24 mm2 was inserted in the hollow space of 25-mm diameter. Fig. 1(b) displays a horizontal cross-sectional view of the hollow metal disk inserted in the microscope for micro-Brillouin spectroscopy. A laser beam coming from a diode-pumped solid state laser (Monopower-532-100-SM,Alphalas) at a wavelength of λ= 532 nm enters one of the three holes, is reflected from the inserted mirror downward to the sample via an objective lens. The scattered light from the sample is collected by the same objective lens and then is headed to T-FPI. A compact cryostat (THMS600,Linkam) was installed on the stage of the microscope to
cover a wide temperature range between -200 and 600℃.The spot diameter
The molecular structure of egonol is shown in Fig. 2.Benzo[
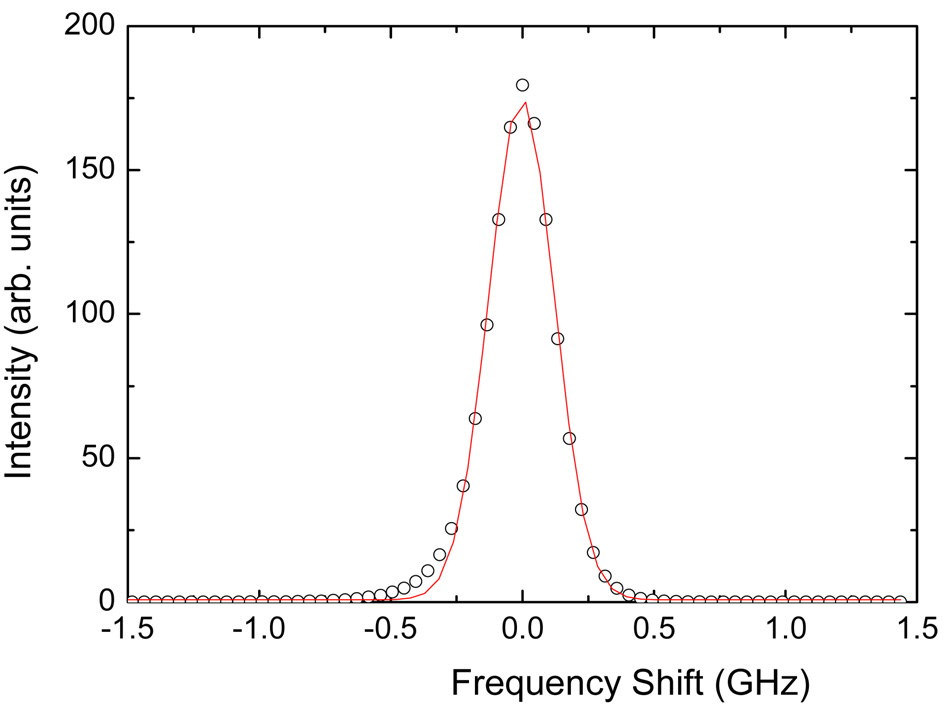
Figure 3 shows the spectrum of the laser beam measured at FSR = 25 GHz by inserting weak laser light directly into T-FPI and recording the spectrum. Since the laser linewidth is only 10 MHz, the spectrum of the incident laser beam can be regarded as a delta function in T-FPI,and the recorded spectrum can safely be considered as the instrumental transmission function of the interferometer.The measured spectrum is theoretically 3-times-3-pass Airy
function which can be well approximated by a Gaussian function. The solid line of Fig. 3 denotes the best-fitted result by a Gaussian function, from which the full-width at half-maximum (FWHM) was obtained to be 0.29 GHz.This means the finesse of T-FPI at this FSR is about 85.
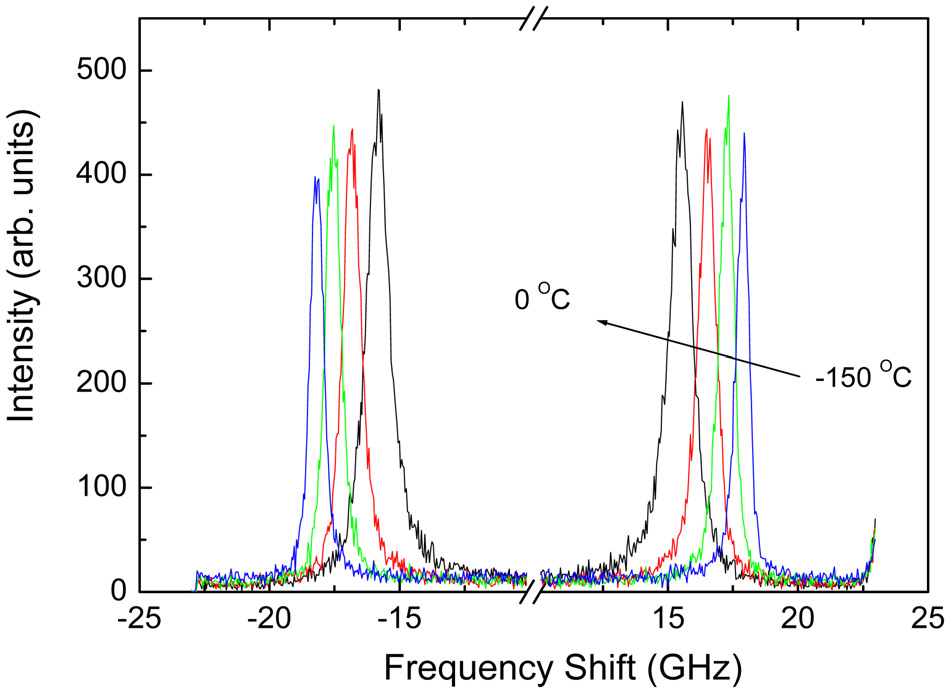
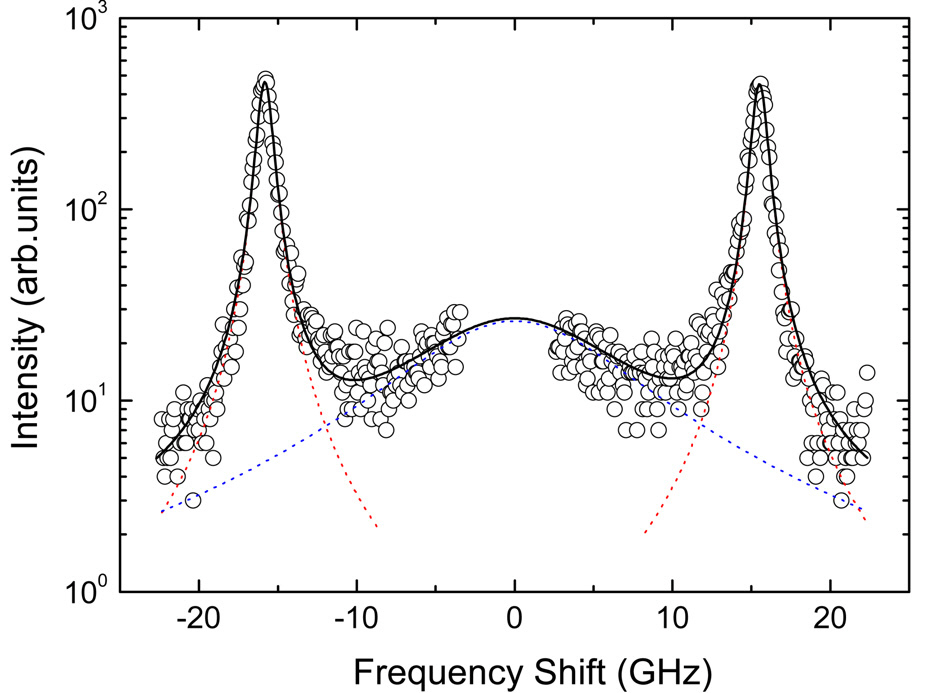
Figure 4 displays the measured Brillouin spectrum of egonol as a function of temperature. The Brillouin spectrum consists of one Brillouin doublet corresponding to the propagating longitudinal acoustic (LA) waves and a weak central peak centered at zero frequency. The peak position shifts to lower-frequency and the linewidth increases upon heating. The scattered spectrum due to LA waves can be approximated by that of a damped harmonic oscillator as follows.
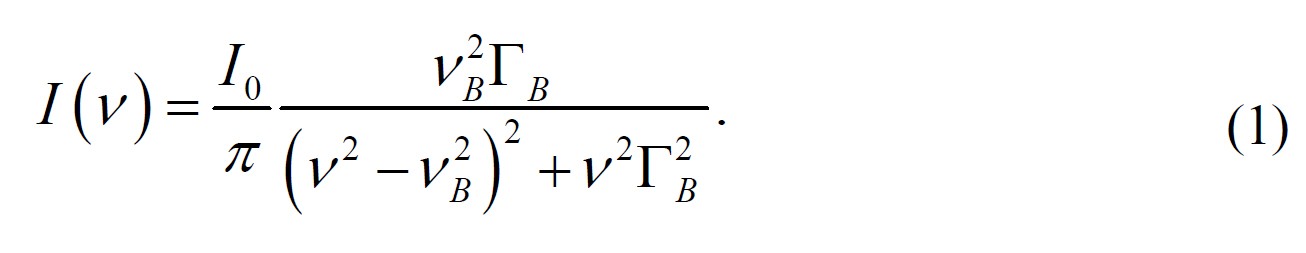
In this expression,
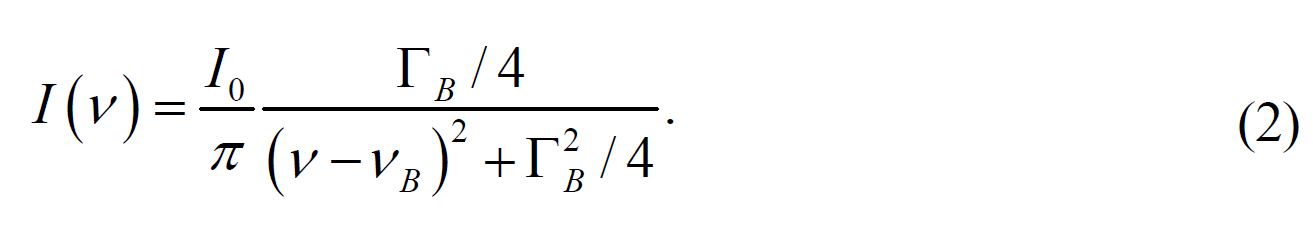
This Lorentzian function should be convoluted to the instrumental function in order to fit the experimental data.The experimental data were finally fitted by using the following Voigt function, which is a convolution of the Lorentzian and the Gaussian functions.
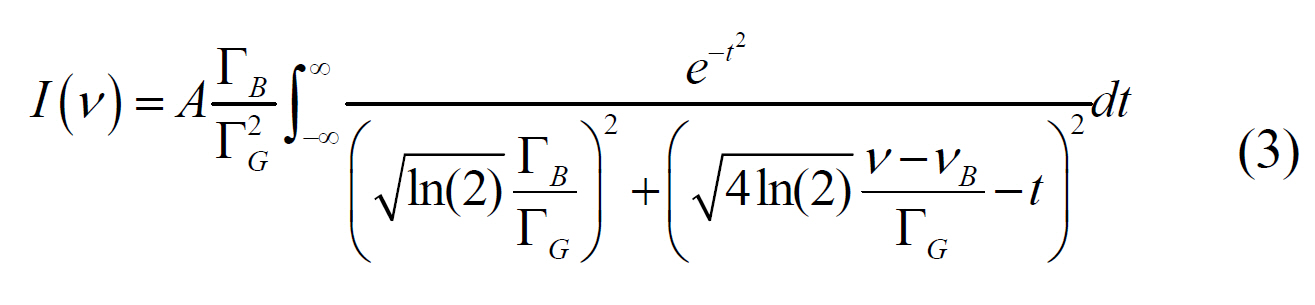
In this equation,
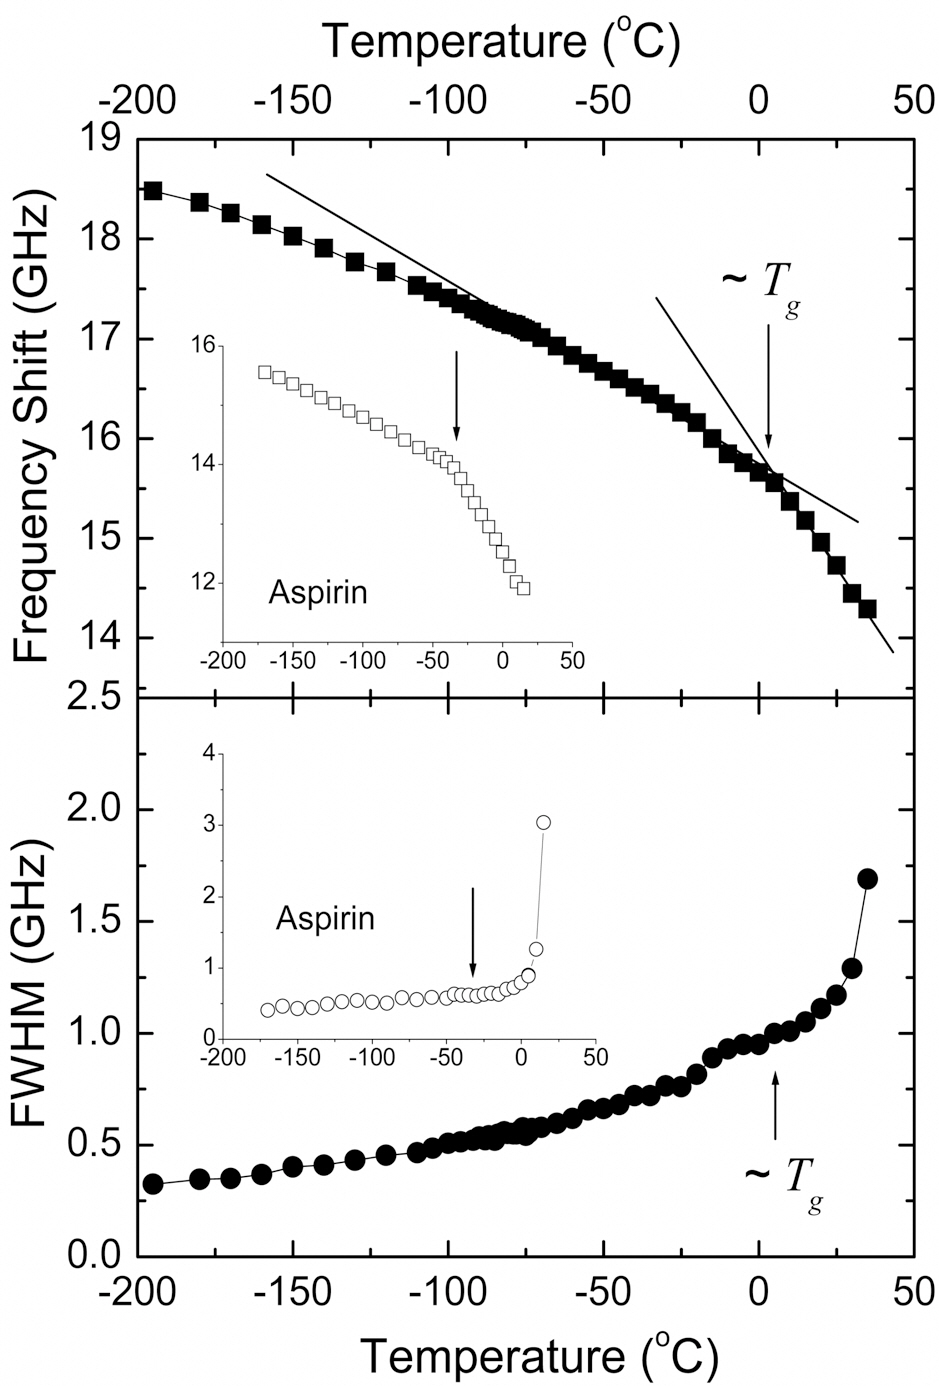
From the fitting procedure, the Brillouin peak position
dependences of
and the supercooled egonol gradually became opaque, indicating the onset of cold-crystallization near this temperature.
Vitreous pharmaceuticals have attracted high attention due to their higher bioavailability. Moreover, vitreous drugs do not have the problem arising from different effects of crystalline pharmaceuticals due to polymorphism. In this context, the stability of the vitreous state of pharmaceuticals is very important from the viewpoint of application.
Finally, the acoustic properties of egonol will be briefly compared to those of aspirin and the differences will be discussed. For these two pharmaceuticals, both
The acoustic properties during the glass transition process of anti-inflammatory egonol material were investigated by using micro-Brillouin scattering spectroscopy with a 6-pass tandem Fabry-Perot interferometer and a optical microscope specially modified for spectroscopic purposes. The vitreous state of egonol was prepared by quenching the liquid egonol to liquid nitrogen temperature, and the Brilloun spectrum was recorded in both glass and supercooled liquid phases upon heating. The Brillouin frequency shift (proportional to the sound velocity) showed a sudden change in the slope while the half width (related with the acoustic damping)began to increase remarkably at around 5℃, which was defined as the glass transition temperature of egonol. The half width of egonol at and below the glass transition temperature was larger than that of aspirin, indicating that the contribution of internal relaxation processes to the damping of acoustic phonons is sensitive to the molecular structure and more substantial in egonol than in aspirin.


![The temperature dependence of (a) the Brillouinfrequency shift and (b) the full-width at half-maximum(FWHM) of egonol. The lines are guide to the eyes. The glasstransition temperature (Tg) is indicated by downward arrows.The insets show the same data of aspirin which were takenfrom Ref.[18].](http://oak.go.kr/repository/journal/10750/E1OSAB_2010_v14n4_403_f006.jpg)