Automatic license plate recognition (ALPR) is used in various applications for vehicle identification, e.g., traffic enforcement, parking management and electronic toll collection,in intelligent transportation systems (ITS) [1, 2]. In ALPR systems, car images are acquired from a camera,and the images are processed by various image processing and optical pattern recognition methods [3]. Commonly, an ALPR system consists of three main processes: detection of plate regions, character isolation and character recognition.Prior to the character recognition step, the license plate (LP) regions must be detected and the character regions must be isolated. Since overall performance and processing speed are influenced by these tasks, they are the most significant step in ALPR systems [3].
In the literature, there are a large number of methods to detect LPs, where features such as texture, frame edges and color are used [4]. The texture-based methods use distinctive gray levels such as local variances [5], gradient density[6-8], frequencies [9] and uniformity [3]. These methods show high detection performance, but many non plate regions are detected. To overcome this drawback, combined methods with morphological steps were proposed in[10-12].
The methods using frame edges [13-17] detect frame boundaries by edge or line information. These methods may detect frame regions correctly; however the plates which have boundaries with low contrast cannot be detected.
The color-based methods [18-22] use a unique color or color sequence of the plate regions. These colors vary greatly due to different illumination conditions, and vehicles may have a color similar to that of the LPs. Thus, color information cannot be directly employed to detect LP regions.
In most applications, character isolation is performed by projections [8] or connected region analyses [22, 23] of a binarized LP image after the LP detection. So, even if LPs were correctly detected, characters may not be isolated.
To develop the best appropriate LP detection method for ALPR, we propose a novel method which can detect LP regions precisely. In the proposed method, we detect LP regions by locating main characters (MCs), which are printed with large font size. To detect MCs, we binarize an input image with multiple thresholds by a criterion of size and compactness. MCs are, then, grouped as candidates, and a neural network using the relation of the MCs and the intensity statistics is employed to reject non LP regions.Therefore, our method can detect LP regions precisely, and is the most appropriate method for character recognition because MC regions are isolated in the detection process.
II. ORGANIZATION OF PROPOSED METHOD
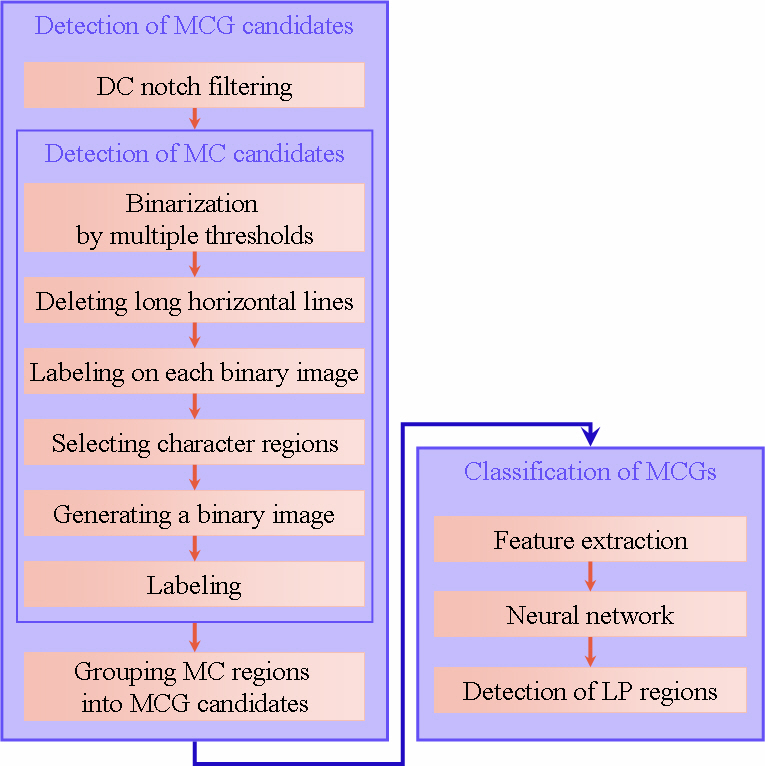
The overall scheme of our method is shown in Fig. 1.We first apply a DC notch filter, which compensates the variation of illumination, as shown in Fig. 1. The DC notch filtering is calculated by
where
MC regions are detected by selecting from isolated binary regions by multiple thresholds and shape information.Then, we group the MC regions into main character group(MCG) candidates, where an MCG is a group of MCs on a LP. MCGs are detected without any character matching,so that many MCG candidates are detected. Characters of MCG, however, are arranged with predefined regulation,so we use a neural network to reject non MCGs from candidates, where the relation of the character regions and
the intensity statistics are used as input features of the neural network.
III. DETECTION OF MCG CANDIDATES
Vehicle images, which contain LPs, are acquired in various places at various times; thus, a simple threshold cannot segment character regions correctly. For this reason, we apply multiple thresholds, and then select character regions.
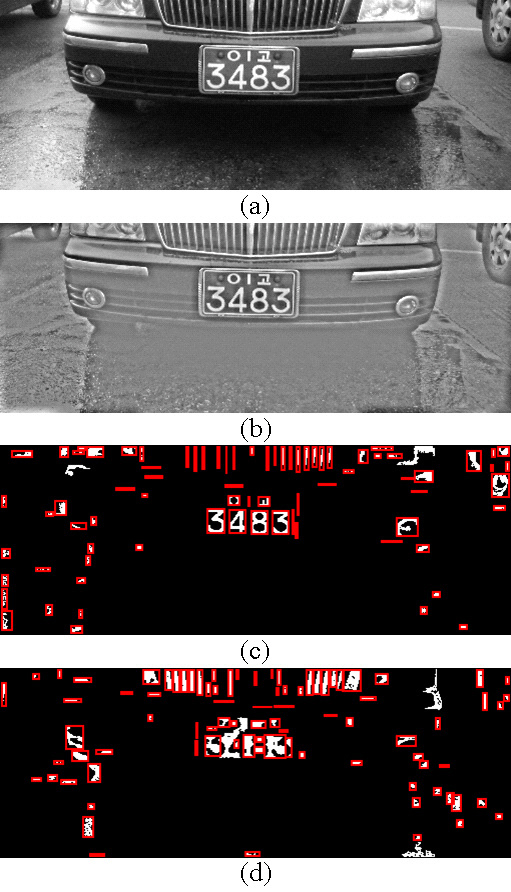
To detect MCGs, we first segment isolated MC candidates as shown in Fig. 1. Binary images are generated using multiple thresholds, and we select character regions, which are the largest regions less than a limited size for detecting characters, from among the binary images. In addition,we use a compactness to reject non character regions. The process proceeds according to the following steps.
Step 1: Initialize threshold levels T[0], T[1], …, T[n]associated with higher percentages of the intensity histogram of the image.
Step 2: Binarize the image with T[0], T[1], …, T[n].
Step 3: (For each kth binary image) Delete long horizontal lines.
Step 4: (For each kth binary image) Perform the image labeling on the binary image. Then store the bounding boxes of connected regions.
Step 5: (For each kth binary image) Select the largest regions satisfying the size of a MC. If the selected region has a lower compactness than the region which is constructed by the lower threshold level (k ?1) and included in the selected regions, select the region constructed by k ?1 instead of the selected region.
Step 6: Generate a binary image from the labels selected from all binary images at Step 5.
Step 7: Label the binary image and then store the bounding boxes in bright character regions (C i b).
Step 8: For threshold levels associated with lower percentages of the histogram, repeat step 1 to step 7, and store dark character regions ( C i b).
The characters may be observed with frames of LPs because of the camera angle. Thus, we delete long horizontal lines connected pixels whose length is greater than
where
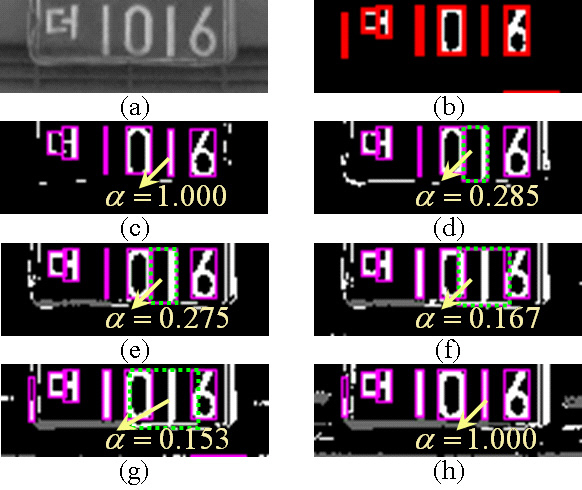
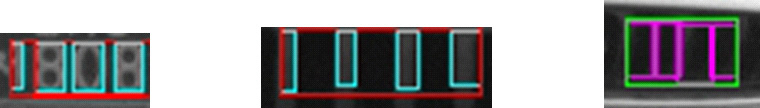
In Fig. 2 (c) to (h), the gray color shows the regions deleted as long horizontal lines, and the regions surrounded by dotted boxes show the rejected regions as non character regions because they have the compactness lower than the compactness of the included region constructed in the lower threshold levels.
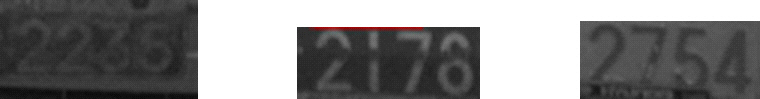
Figure 3 shows an example for detection of MC candidates.Figures 3(c) and 3(d) are the generated binary images with higher and lower percentages of the histogram, respectively.
In common LPs including those of Korea, the MCG is four isodistant numbers. Thus, we detect MCGs by grouping four horizontally adjacent MCs as follows:
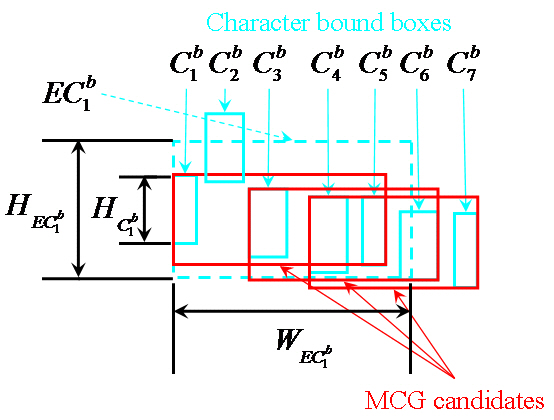
Step 1: For all bright character regions ( C ib ), extend group regions to EC ib such as
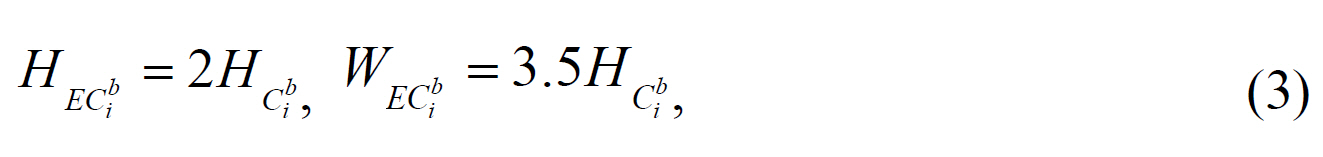
where H ECib and W ECib denote the height and the width of ECib, respectively, and HCib is the height of Cib. ECib is aligned left of the vertical middle Cib position.
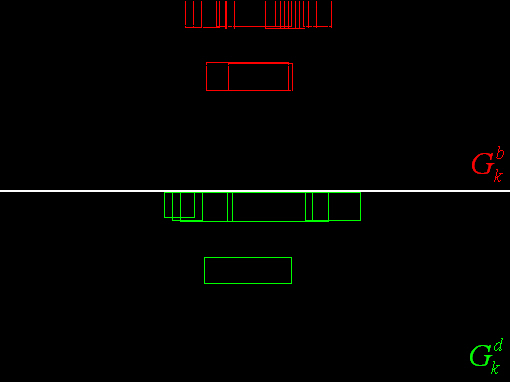
Step 2: Detect the three nearest character regions included in ECib, and group the union of the three rectangle regions and Cib as a kth MCG candidate for bright characters ( Gkb ).
Step 3: For all dark character regions ( Cid ), repeat step 1 and step 2, and create a kth MCG candidate for dark characters ( Gkd ).
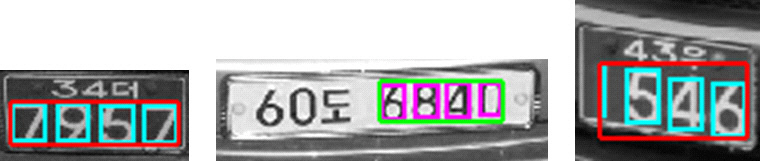
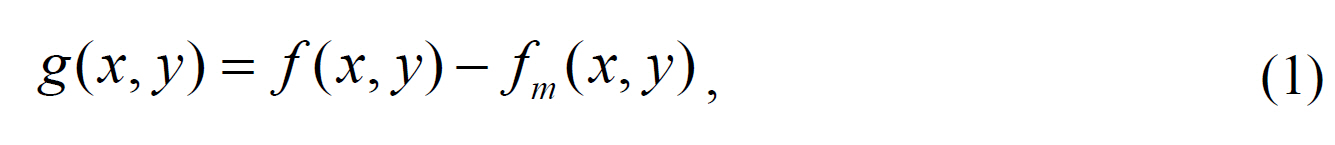
The examples of detection of MCG candidates are shown in Fig. 4.
are created by
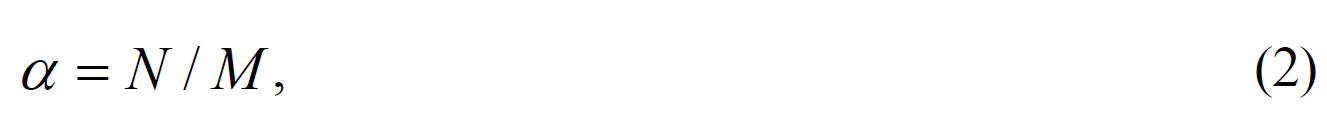
A number of MCG candidates may be detected by many horizontally adjacent regions as shown in Fig. 5. For this reason, we apply a neural network to reject non MCGs.
IV. MCG CLASSIFICATION BY NEURAL NETWORK
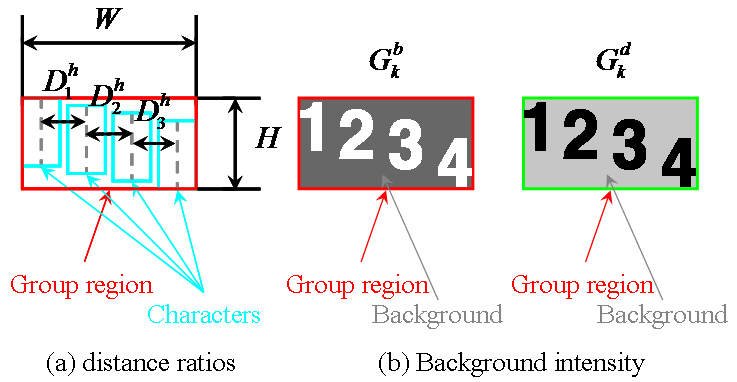
Although the LP is oriented with small angles in the image, the horizontal distance between neighbor characters is seen to have regular arrangement. Therefore, we extract the ratios of the horizontal distance between adjacent characters and the width of the MCG, and they are used as the input features of classification and are calculated by
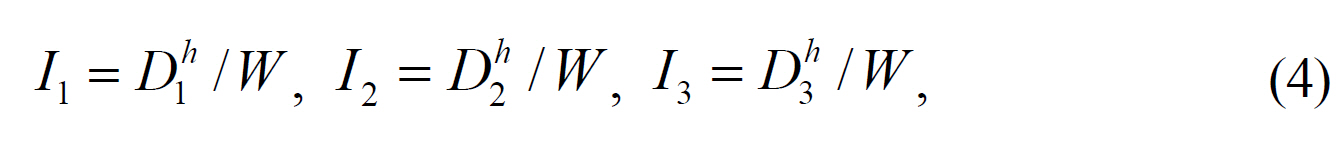
where W denotes the width of the MCG, and

where
The intensities of the background and the character regions are different, and both the background and the character regions are characterized by uniform intensity, as shown in Fig. 6(b). Therefore, we extract the average intensity (
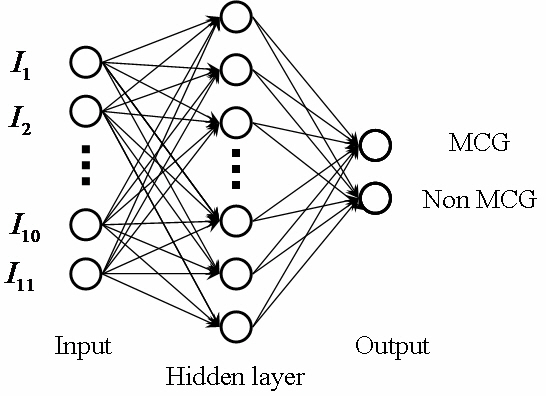
By using extracted input features, we employ a neural network to reject non MCGs, as shown in Fig. 7, where the input nodes are the features, and the output nodes classify whether the region is a MCG or not.
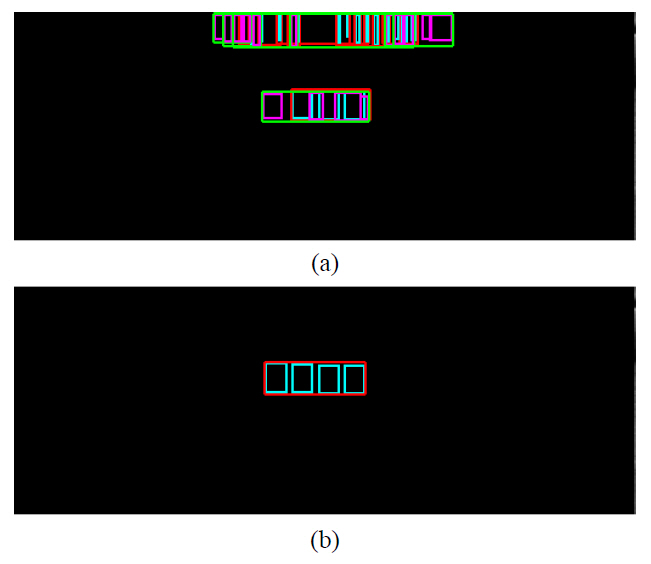
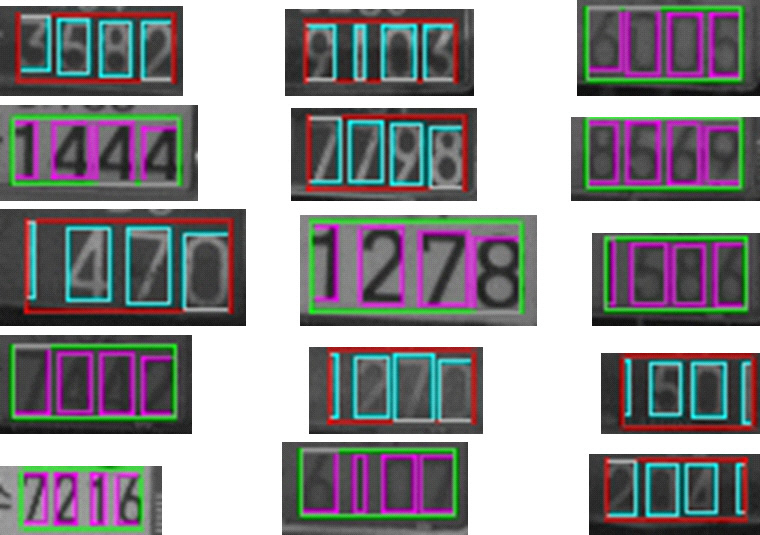
Our method was tested on 1000 vehicle images taken in Korea. Four hundred forty-five images were taken as training images: 115 LP images and 330 non LP images, where many non LP images are needed for high performance,because non LP images which are similar to LP images are very varied. The original image size is 1024×1024. Then the images are down sized to 512×512 and the upper region is truncated, so the final image has a size of 512×256 when it is processed. Figure 8 shows an example of the results.Figure 8(a) shows non MCGs rejected by a neural network,and Fig. 8(b) shows a detected MCG. Figure 9 shows correctly detected MCGs with whole plate regions for various types of LPs.
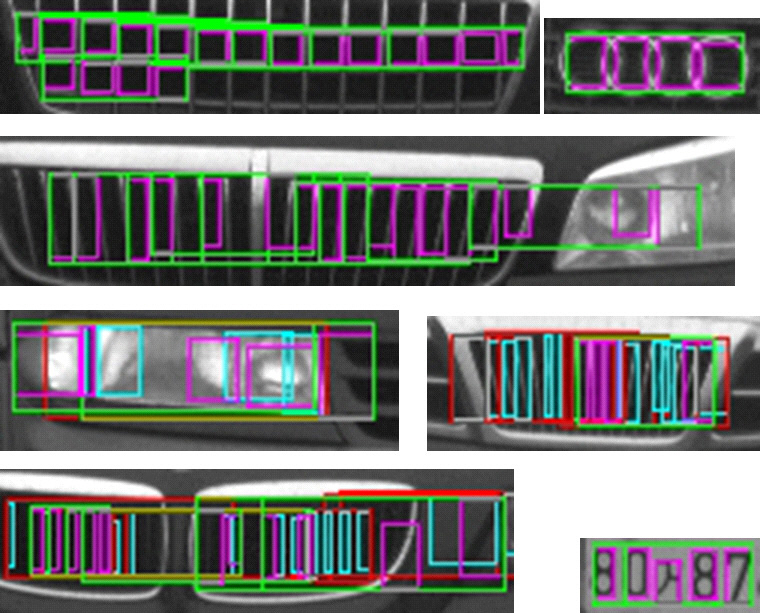
In the experiments, various types of LP regions with poor quality were correctly detected as shown in Fig. 10.Out of the 5664 candidates detected, 4650 candidates were rejected, and 34 non MCGs were not rejected (false posi
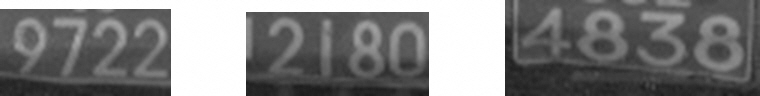
tive rate: 0.6%). Out of the 987 MCGs detected, 980 MCGs were correctly detected (detection rate: 98.0%), and 7 false rejections were observed (true negative rate: 0.1%). The rejected non MCGs are shown in Fig. 11. The images which have undetected MCGs have poor image quality, as shown in Fig. 12. The number of false detected MCGs is 34. The false detected MCGs are exemplified in Fig. 13. These regions may be rejected by detecting whole license characters. Figure 14 shows MCGs falsely rejected by the neural network. Character isolation and recognition can be correctly performed by additional processes for these images; however,overall performance may worsen because the additional
processes may influence clean images. Although various types of plates are being used in Korea as shown in Figs.9 and 10, high detection performance was achieved because the employed neural network nonlinearly classifies the feature space.
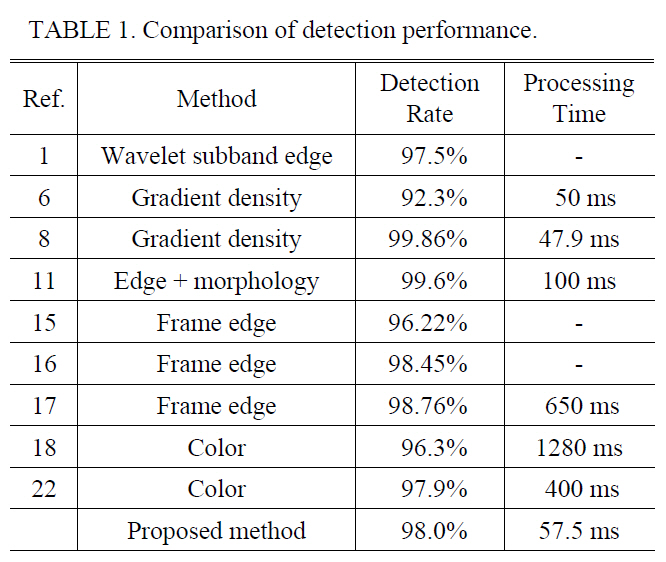
On a Pentium PC with 2.4 GHz, the average processing time of a single image was about 57.5 ms. This is fast enough to realize a commercial ALPR system.
There are many methods to detect LPs; however, their performance rates are often overestimated for promotional reasons. In the literature, the detection rates are often introduced as shown in Table 1, but the data sets are limited with small quantities and restricted image qualities.For this reason, it is very difficult to objectively compare performance. Although the detection rate of the proposed method is less than the results of some methods, the proposed method has advantages over other methods as follows; stained LP regions which cannot be processed for character isolation were not detected, and MC regions are located in LP detection. Therefore, our method may be robust and precise.
[TABLE 1.] Comparison of detection performance.
Comparison of detection performance.
In this paper, we proposed a novel method which detects car LPs by locating MCGs. For considering various operating conditions, multiple thresholds are used to detect MCs.To reject non MCGs for candidates, the relation of the character regions and the intensity statistics are applied to input nodes of a neural network.
If characters cannot be segmented, it is impossible to recognize a LP even though the LP is detected. Character isolation is the most important part of ALPR. Common ALPR systems employ both detection of LPs and character isolation. However, we directly detect MCGs by detecting LP regions. The detection rate is 98.0%; however, almost all non-detected plates are so stained that their characters cannot be isolated for character recognition, and the average processing time is about 57.5 ms. Therefore, the proposed method can be applied to ALPR systems with high performance and fast processing time. Moreover, when the number of grouping characters and training data are modified, this method is appropriate for multinational LP detection.