Unlike document images, license plate images are mostly captured under uneven lighting conditions.In particular, a shadowed region has sharp intensity variation and sometimes that region has very high intensity by reflected light. This paper presents a new technique for thresholding license plate images.This approach consists of three parts. In the first part, it performs a rough thresholding and classifies the type of license plate to adjust some parameters optimally. Next, it identifies a shadow type and binarizes license plate images by adjusting the window size and location according to the shadow type. And finally,post-processing based on the cluster analysis is performed. Experimental results show that the proposed method outperformed five well-known methods.
As the number of vehicles increases rapidly, vehicle related problems such as traffic congestion at a toll gate, violation of traffic signals, and illegal parking get worse. An intelligent transportation system (ITS) has attracted attention as the most effective solution to these problems. Automatic identification of a vehicle is an essential element for developing ITS. The license plate recognition (LPR) by optical character recognition has been an active research area for the last ten years. A typical LPR system can be roughly divided into three modules: license plate detection, character segmentation,and optical character recognition. Some studies are based on gray-level pattern matching, which segments and recognizes the characters in a license plate without thresholding[1, 2]. However, most of the recent studies have the preprocessing step of thresholding before the character segmentation.The thresholding makes it possible to use various techniques developed in the field of document recognition.
The thresholding techniques can be roughly categorized as global methods [3-5] and local methods [6-8]. While the global methods select a single threshold value to classify an image into object or background classes, the local methods calculate an adaptive threshold value in each window or block.The method of Yang et al. [5] is based on the assumption that the ratio of the character region to a license plate area is approximately fixed. In fact, the ratio varies a little according to the characters in the plate. Yang et al. [4] has proposed a method of adjusting the threshold according to the ratio of the character region which is obtained by an iterative thresholding. These methods are simple and effective for the license plate images which are captured from restricted places such as a toll gate or a parking lot entrance where the illumination can be controlled artificially. If we use these methods under unrestricted outdoor conditions, we cannot expect good thresholding results.
A local thresholding method is required to adjust to a local intensity variation. Bernsen [6] and Niblack [7] are well-known classical methods of local thresholding. Niblack’s method computes a local threshold from the mean and the standard deviation of the gray values in a window, and Bernsen’s method uses the minimum and the maximum of the gray values. So, Bernsen’s method is more sensitive to the local variation than Niblack’s. To binarize a license plate area, Yang et al. [9] tested some classical thresholding methods and selected Bernsen’s method. Three classical thresholding methods were used for verification of a license plate in Tan and Chen [10]. First, they used Otsu’s method [3]. If the binarization result is not good enough for extracting desired features, then Bernsen’s and Niblack’s methods are used sequentially. Wu et al. [11] selectively adopted two different thresholding methods according to the ratio of edge pixels in a window. These local methods show good results in normal outdoor illumination conditions,but they had shown broken strokes and ghost objects at the boundary where intensity changes drastically. Since sharp intensity variation is not unusual in a rear license plate,a new thresholding method which is robust to the drastic intensity variation is necessary to develop a practical LPR system. Although a variety of methods have been proposed for developing an LPR system, they did not consider cast shadows on license plates. Thus, the problem of the sharp intensity variation from the cast shadows has rarely been studied. This paper proposes a robust thresholding technique for license plate images with shadowed regions. First, it performs a rough thresholding and classifies the type of license plate to adjust some parameters optimally. Next, it identifies a shadow type and binarizes the license plate image by adjusting the window size and location according to the shadow type. Finally, post-processing based on cluster analysis is performed.
The rest of this paper is organized as follows. Section 2 introduces some related work and section 3 presents a detailed description of the proposed method. In section 4,experimental results and analysis are provided, and finally the conclusions are described in section 5.
Although a large number of studies have been made on license plate localization and recognition, only a few studies use a thresholding method for shadowed license plate images. In this section, we review some existing methods.The first three methods have been used or proposed to binarize license plate images. The last two methods have been proposed to binarize uneven lighting and degraded document images. Although the last two studies deal with document images, not license plate images, these methods are also reviewed because they deal with uneven illumination problems.
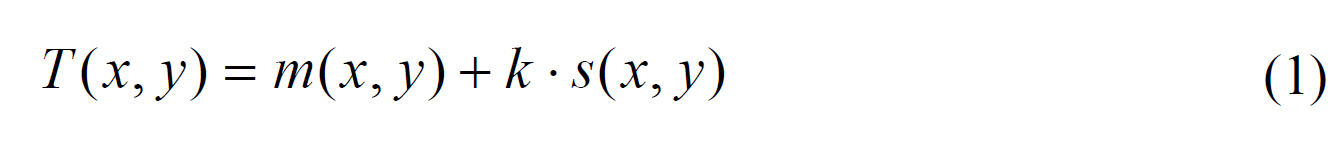
Niblack’s method is based on the calculation of the local mean and local standard deviation [7]. The threshold of a pixel at (
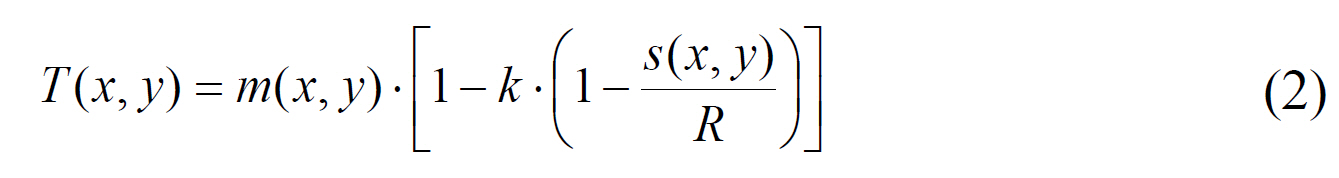
This method does not work well when the background area contains local variations due to stains or uneven illumination.To solve this problem, Sauvola and Pietikainen [8] have proposed a modified Niblack method. The thresholds are computed with the dynamic range of standard deviation,
Wu et al. [11] have proposed an alternative thresholding method based on the boundary characteristics. This study uses the boundary features to choose either the basic adaptive thresholding (BAT) method or c-means algorithm. The BAT is appropriate for segmenting two clusters whose variances and possession rates are similar. In the opposite case, the c-means algorithm is appropriate. At first, an image is partitioned into
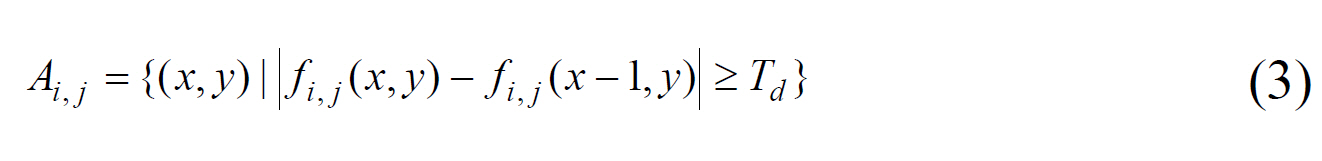
After the set of boundary pixels is obtained, the updated threshold
In order to binarize uneven lighting images, Huang et al. [13] partitioned the whole image into small blocks that did not overlap, and then used existing methods to binarize each block. The technique is based on a pyramid data structure, and the block size is adaptively selected according to the Lorentz information measure (LIM). The LIM indicates whether each block contains both the object and the background. If the block contains the object and the background, Otsu’s method [3] can be directly applied for thresholding the block. Otherwise, adjust the block size continuously according to the pyramid data structure until it meets the requirement.
A document can be degraded by non-uniform illumination,low contrast, large signal-dependent noise, smear and strain.Gatos et al. [14] have tried to solve these problems by a background surface thresholding. In order to estimate foreground regions, it first gets an initial binary image
where
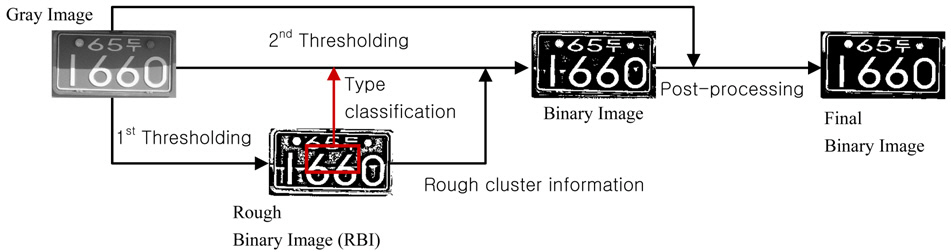
This section presents a detailed description of the proposed method for thresholding license plate images. The overview of our method is illustrated in Fig. 1. First, it makes a rough binary image (RBI) by using Niblack’s method [7].Next, it generates a binary image using both a gray image and its RBI. The type information of a license plate and the rough cluster information are used for the second thresholding. At last, a final binary image is acquired by post-processing based on cluster analysis. Not only the binary image but also its gray image is used for the post-processing.
3.1. Classification of a License Plate Type
When an adaptive thresholding method is used, the
quality of a binarized image is highly affected by the parameters of window size and
In order to set the sign of
If
3.2. Shadow Detection and Window Adjustment
We know that the character size and thickness in a document are important factors to decide the suitable window size
in the window-based adaptive method [12]. It does not mean that all the characters in a license plate have the same size and thickness, but their size and stroke width should be proportional to the size of the license plate. Thus, it is natural to adaptively change the window size according to the size of a license plate image. As far as the window size is greater than stroke width, the quality of binarized image has not been highly affected by the character size.However, the quality has been severely affected by the window size when intensity changes drastically by cast shadows.Fig. 3 shows two examples of license plate images with a cast shadow and their results of thresholding with different window size. The size of the window is defined by(2
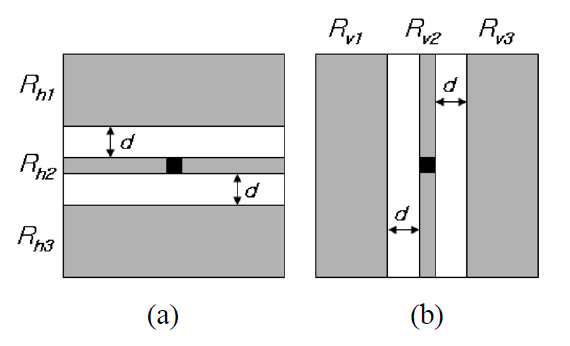
To acquire good binarization results, the problems of the broken strokes and the ghost objects should be solved.This paper proposes a new method to solve these problems.The basic idea is, first, to detect the boundary of a cast shadow, and then to adjust the window size and location according to the distribution of gray values in the window.There are various shapes of shadows, but we treat every shadow either as a horizontal shadow or a vertical shadow.We have defined six regions in a window as depicted in Fig. 4. The top region (
(
If the ratio

The central horizontal region (
the fourth pixel is incorrectly binarized. The fourth pixel was not detected as a pixel located at the boundary of a shadow due to an error in the RBI. This kind of error will be corrected by the post-processing based on cluster analysis.
3.3. Post-processing Based on Cluster Analysis
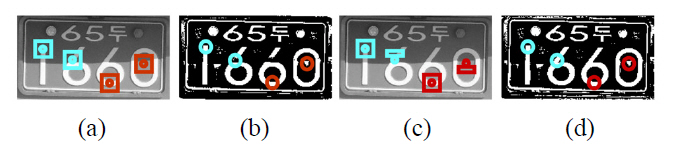
In order to improve the quality of a binarized image, previous post-processing methods have usually used the information of the binary image only. Gatos et al [14] used a shrink filter to remove noise from the background and applied a swell filter to fill possible breaks, gaps or holes in the foreground. Yang & Yan [17] used run length features.These methods are effective at removing small noise such as salt and pepper noise, but their limitation is that ghost objects, as shown in Fig. 6, are not removed. This paper proposes a new post-processing method based on cluster analysis to remove the ghost objects. It uses not only the cluster information in the RBI but also the gray-level information in its original image. Binarization can be considered as categorizing all the pixels in the image into two clusters. If the resulting binary image is a reliable clustering result of its gray image, most of the pixels with similar gray values of a seed pixel may be categorized into the same cluster of the seed pixel. If the cluster of a seed pixel is not equal to the major cluster of the similar surrounding pixels, the cluster of the seed pixel is corrected by reversing.
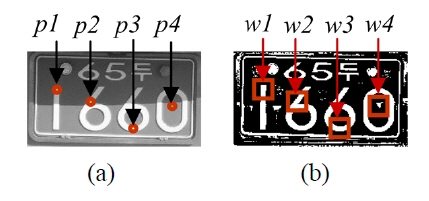
The three pixels, denoted as
A premise of the post-processing by cluster analysis states that the pixels in the same cluster may have similar gray values if the pixels are in the near distance. However,this premise is not satisfied when a cast shadow appears.Two different cluster analysis methods are applied sequentially.The first cluster analysis method (CAM1) inspects only some pixels satisfying predefined conditions. In contrast,the second cluster analysis method (CAM2) inspects all the pixels in a predefined window. CAM1 probes 8-directional neighbouring pixels from a seed pixel. It continuously
examines the neighbour pixel in each direction and counts the number of hits and misses while the following condition is true.
where the
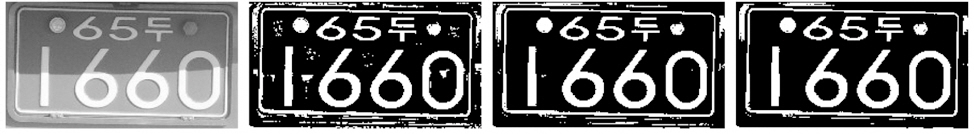
After the post-processing based on CAM1, we then apply CAM2. CAM2 uses the same approach as CAM1. It counts the number of hits and misses in the same way. However,it has two differences. The first is that it inspects all the pixels within the window that defines a probing region.The second is that it strengthens the criterion which is used to correct the seed pixel. When the hit ratio is less than a half of the miss ratio, the seed pixel is reversed. Normally,the window size of 11×11 is sufficient to correct a seed pixel by CAM2. Sometimes, an enlarged window is necessary for the seed pixel at the boundary of a shadow because there are many noises including ghost objects at the boundary.The window size is automatically adjusted according to the location of a seed pixel and the boundary of a shadow.Fig. 7 shows the results of post-processing by CAM1 and CAM2.
Two sets of data were used in this experiment. These data were obtained by segmenting the region of license plate from the parked vehicle images of 1024×768 with 96 dpi. The average width and height of the license plate region is 217 and 105 pixels respectively, and the largest one is six times bigger than the smallest one. Set 1 consists of 120 license plate images captured under normal outdoor lighting conditions. Set 2 has 80 license plate images that intensity changes drastically at the boundaries of shadows.
In order to measure the performance of the proposed and comparison methods, we implemented them with C++on a Pentium PC (2.2 GHz) and measured the quality of binarized results by using two evaluation criteria: misclassification error (ME) and relative foreground area error (RAE).The measure of misclassification error (ME) has been widely used to evaluate the performance of various thresholding methods [16, 18-19]. ME reflects the percentage of the incorrectly clustered pixels. It can be computed by the following equation:
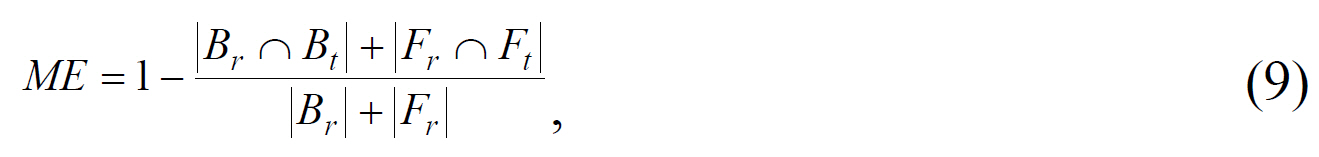
where
RAE is a kind of measure to reflect the feature measurement accuracy that has been used under the name of relative ultimate measurement accuracy (RUMA) [16]. RUMA compares object properties such as area and shape, as obtained from the test image with the corresponding properties from the reference image. RAE measures the area feature by the following equation.
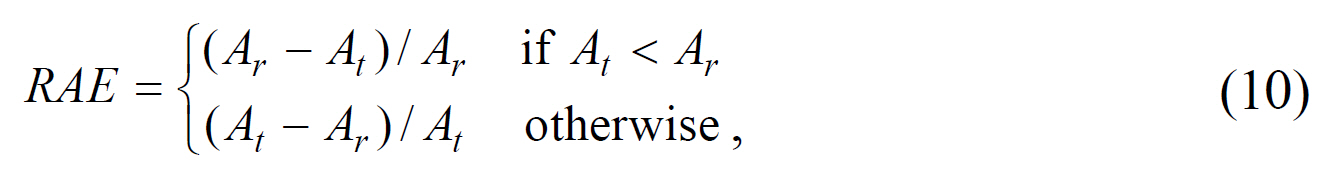
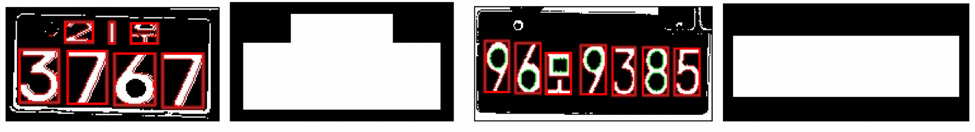
These two measures vary from 0 to 1, 0 for a perfectly binarized image, 1 for a totally incorrect result. When implementing these two measures, we do not compare the entire area of a license plate but compare only the inner area where characters are located. We have two reasons for that. The first is that the quality of the outer area is not important for license plate recognition. The second is that when we make reference images assigning some pixels in the outer region to foreground or background is more or less subjective. The white areas in the second and fourth images in Fig. 8 represent the inner area and the black areas represent the outer area. The inner area is defined by the region including the connected components of characters in a license plate image.
We compared the performance of the proposed method with the related work described in section 2: Niblack’s method [7], Sauvola’s method [8], Wu’s method [11],Huang’s method [13], and Gatos’ method [14]. By using the method presented in section 3.1, we have perfectly classified the types of license plate images in set 1 and
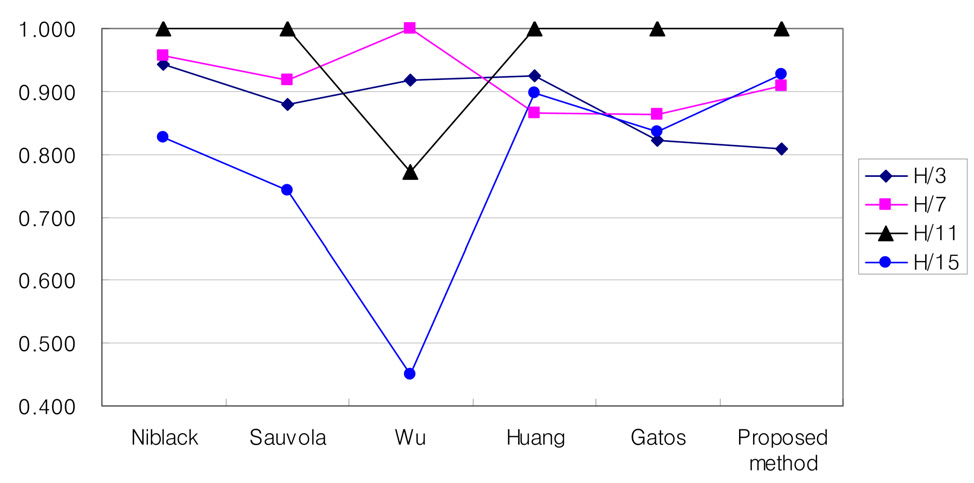
set 2. The type of license plate is very useful information for a parameter setting. So, the information was equally used not only in the proposed method but also in the comparison methods. We first performed a parameter tuning for each method. Then, we measured the quality of thresholding result by using the measures of ME and RAE. We selected 40 images from set 1 for the parameter tuning. In Niblack’s method, the experimental result shows the best quality at
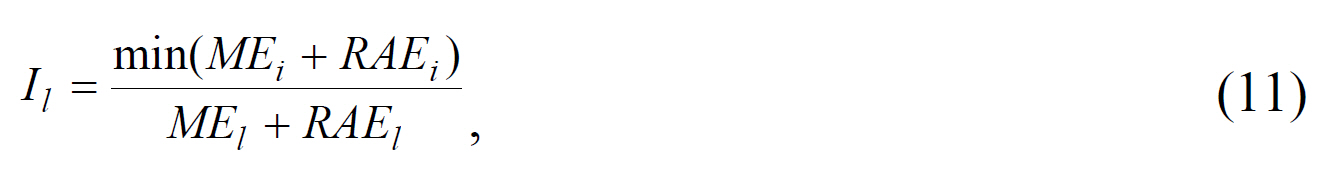
where MEl and RAEl are the ME and RAE measured by using the window size of (
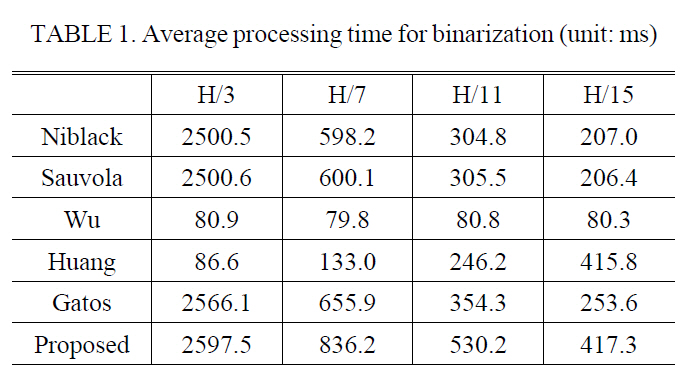
Table 1 shows the processing time of each method with different window size. On the whole, the BUTMs are much faster than the PUTMs, but the quality of binary image by the BUTMs is worse than for the PUTMs. PUTMs including the proposed method require a long processing time, but these methods are fast enough for application, that do not require real time processing, such as watching an illegally parked vehicle, finding a missing vehicle, etc.
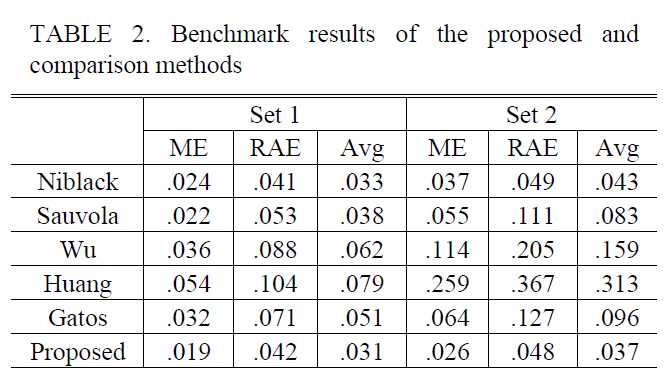
After setting the parameters as optimal values from the tuning data, we benchmarked the quality of binary image generated by each method. All the images in set 1 and set 2 except the tuning data were used for benchmarking. The benchmark results are shown in Table 2. The PUTMs show better quality than the BUTMs. The performance of Sauvola’s method was similar to that of Niblack’s method when we tested them with the images in set 1. In the case of set 2, however, Niblack’s method showed much better quality than Sauvola’s method. Sauvola’s method adjusts the threshold at a bigger rate than Niblack’s when the average intensity value is high. When a license plate image represents high intensity and variation, regardless of the existence of a shadow, Sauvola’s method adjusts the threshold excessively. In that case, the quality of the binarized image is very poor. Especially when a strong shadow exists on a license plate, the quality goes from bad to worse. As shown in Table 2, the performance gap between the two methods is enlarged as the experimental data are changed over from Set 1 to Set 2.
The proposed method and Niblack’s method showed a relatively low increase in ME and RAE as the test data was switched from set 1 to set 2. That means that these two methods are robust to the illumination change. In contrast, the other methods showed a large increase in ME and RAE as the data is switched. The methods of Wu and Huang showed especially poor results in set 2.
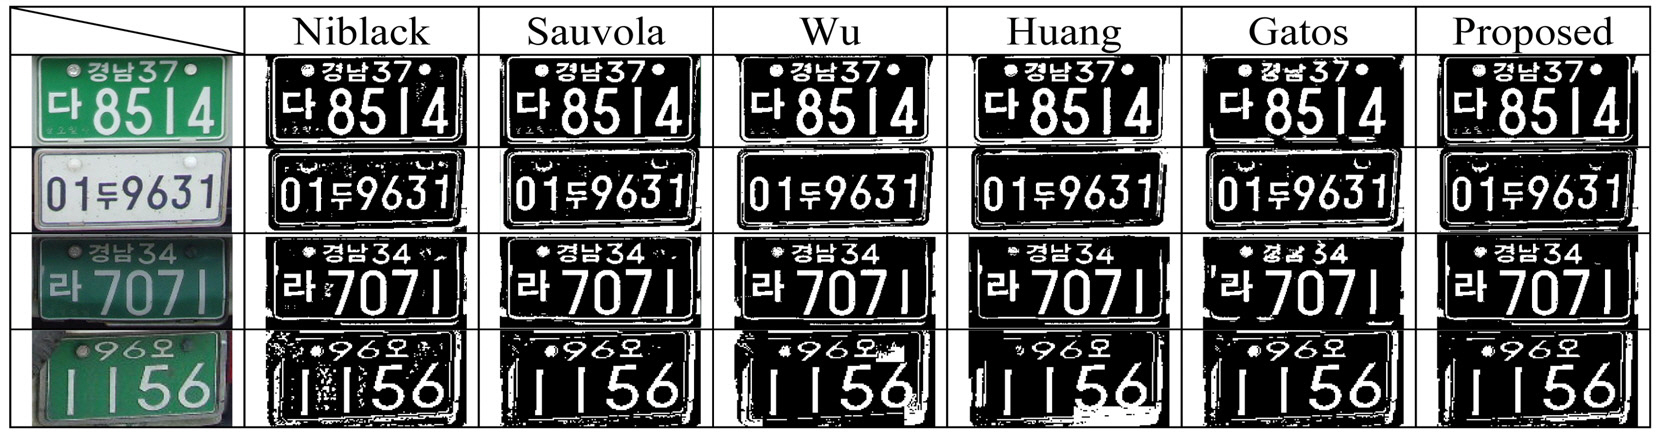
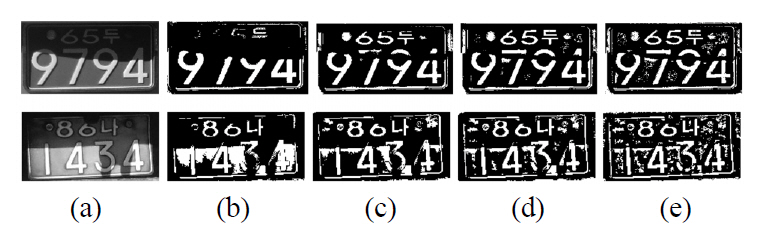
By using the results presented in Table 2, we can rank the proposed and comparison methods, but we cannot compare the quality of binary image qualitatively. So, we observed the binary images generated by each method.Fig. 10 and Fig. 11 show some sample images and their binarized results. After a thorough observation of our experimental results, we obtained some important properties of each method. On the whole, all six binarization methods show good results with the images acquired from normal outdoor lighting conditions. In some images with uneven background, Wu’s and Huang’s methods tend to make ghost objects as shown in the last row of Fig. 10.
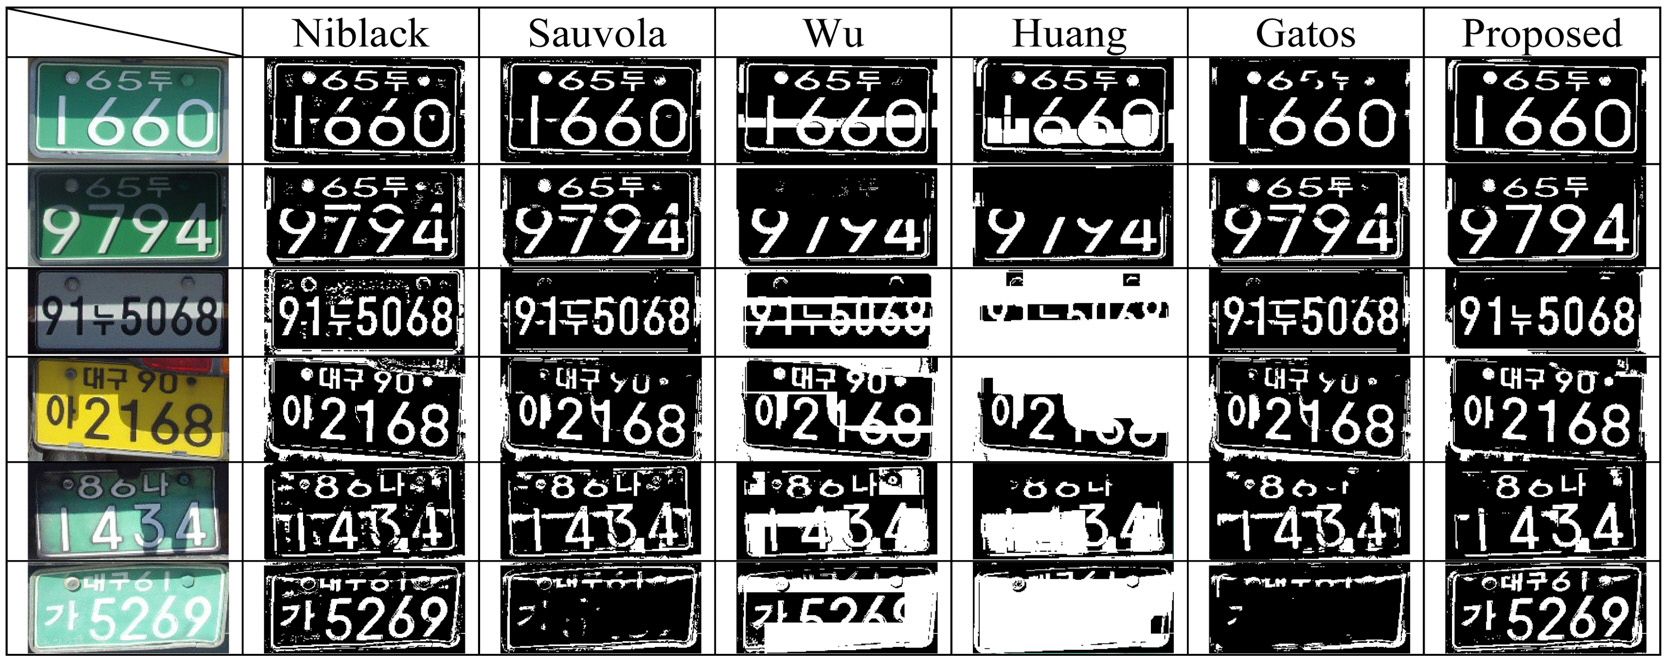
For set 2, each method shows various properties according to the input image. Niblack’s method shows robustness to the drastic change of illumination, but the binarization results have some problems with broken strokes and ghost objects at the boundary of a shadow. Similar problems also appear in Sauvola’s method. Sauvola’s method shows an additional problem in the images with reflected light.The average intensity value of a region exposed to direct sunlight is near to 255 at an 8-bit gray image. So, the characters in the highlighted region disappeared as shown in the last row of Fig 11. Gatos’ method showed similar results. The methods of Wu and Huang are fragile to uneven lighting conditions, so they show very poor results in most of the images in set 2. Since Gatos’ method uses Sauvola’s approach to estimate the background surface, it shows similar types of errors to those that appear in Sauvola’s method. In spite of the complicated procedure and postprocessing using shrink and swell filters, the binarization quality by Gatos’ approach is barely improved. The proposed method is robust to the drastic change of illumination and reflected light. In addition, it has solved the problem of broken strokes and ghost objects, so it shows the best results.
This study has proposed a new technique for thresholding license plate images. The previous methods have revealed some problems in thresholding shadowed license plate images.Two major problems are broken strokes and ghost objects appearing at the boundaries of shadows. One additional problem is a thresholding error appearing at highlights due to reflected light. The proposed method has solved the broken stroke problem by adaptively adjusting the window size and location. Most of the ghost objects have also been removed by using the post-processing method based on cluster analysis. The error caused by reflected light has been easily defeated, because our method is based on Niblack’s method that is robust to reflected light. The experimental results show that the proposed method is superior to five well-known approaches.