The joint transform correlator (JTC) has shown remarkable achievements for real time pattern recognition and target tracking applications. Especially for pattern recognition, it can be applied to facial appearance, fingerprints, handwriting,and character recognition [1-6]. The typical advantages of the JTC are that it uses a type of real time optical system which quantitatively analyzes and compares the images by measuring a correlation peak and peak signal to-noise ratio(PSNR). This kind of optical pattern recognition system goes through a double random encryption and double-encryption process using the JTC method. However, it also has drawbacks in that it is sensitive to rotation or shifting of images.Moreover, it has some problems with nonlinearity of the optical components such as a digital camera, and with weak correlation discrimination caused by noise. Recently many methods for solving such problems in the JTC have been studied. Among them, the nonlinear joint transform correlator (NJTC), which can solve the problem of the nonlinear components in the JTC system, may be the most typical [7-9]. In addition, an essential technique in pattern recognition and identification is that of finding an accurate recognition method when the input images are rotated in angle and translated in position [10-11]. In spite of such efforts, weak correlation discrimination and noise problems still remain. Such kinds of weak correlation discrimination and noise problems originate from the interference fringes constructed with a Fourier transformed reference and a sample image in the Fourier transform plane. Some attempts to improve the discrimination ratio as well as the optical efficiency have been made in the spatial domain or in the frequency domain. However, most attempts are divided into two groups, one group uses an intensity or a phase threshold and the other group uses some kinds of filtering. Alam successfully applied the synthetic discrimination function(SDF) filter concept to a JTC system and used a Fourier plane image subtraction technique [12-14]. Although this technique successfully improved the correlation peak and reduced the side-lobe noise, it adopts a simple input joint images enhancement using an image normalization and spatial domain iterative filtering process. Thus it has problems finding suitable parameter values to adjust the fringe with a minimum error function, and it needs another liquid crystal display (LCD) in the spatial domain. In order to solve these problems, we [15] have proposed a technique of modifications of the interference fringes by adopting a spectrum domain iterative filtering technique which can find the optimum condition with minimum error for a highly improved PSNR and reduced side-lobe noise. Unlike Alam’s technique, our technique has dealt with fringe-adjustment by inserting an iterative filtering step in the joint power spectrum (JPS) domain to enhance the interference fringe pattern instead of inserting the iterative filter after the input joint images. Although this technique successfully increased the PSNR ratio to reduce the side-lobe noise, it showed rather low correlation peak ratio compared with Alam’s technique [14].
In order to enhance both the correlation peak and the PSNR, we present a new technique of modifications of the interference fringes by introducing a sinusoidal amplitudemodulated iterative filter convolved with the interference fringe in the JPS domain. Experimental results are presented to show that the proposed technique can successfully improve the correlation peaks and the PSNR. In the following section, the proposed new method of fringe-adjusted JTC system and its algorithm, including the sinusoidal amplitude modulated iterative filtering technique, are described in detail. Section III describes simulation results for a pattern recognition enhancement and, finally some comments are contained in the Conclusion.
II. SINUSOIDAL AMPLITUDE MODULATED ITERATIVE FILTER
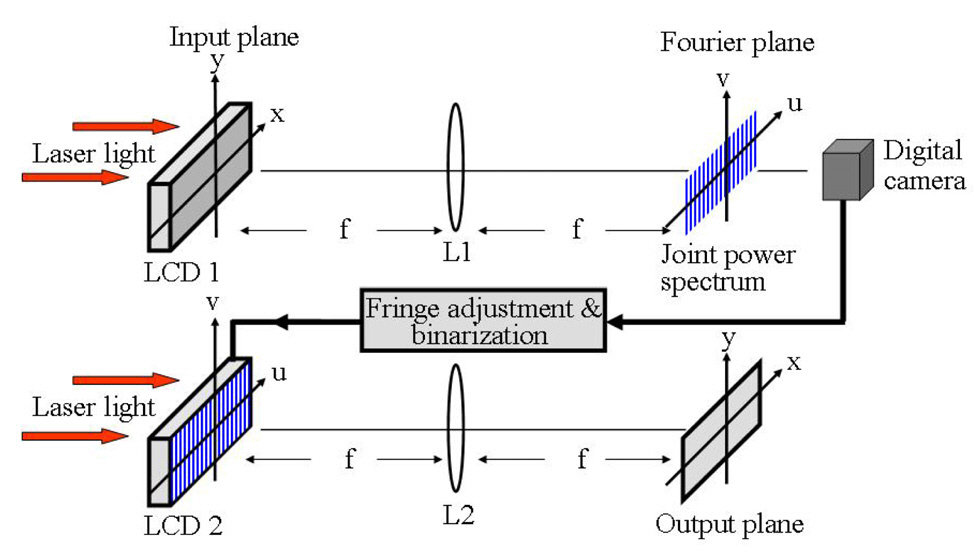
Fig. 1 shows the optical structure of the basic NJTC system which compensates for the nonlinear optical components such as a CCD camera. NJTC uses a two-stage process. In both stages the image of a coherently illuminated input passes through a lens to take its Fourier transform.In the first stage of NJTC the basic operation is to get the information of the Fourier transformed object from the Fourier transform lens L1 onto the Fourier plane. Let us call the reference image
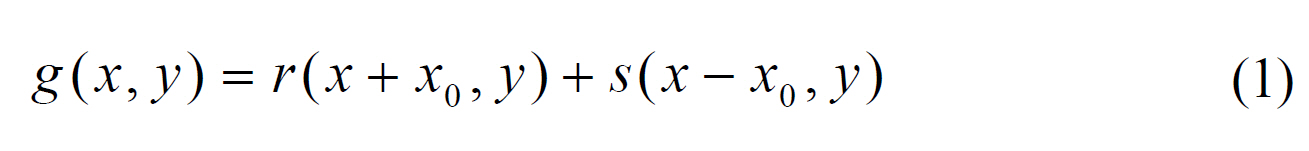
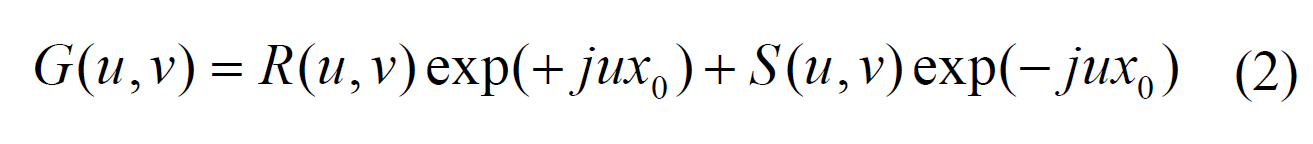
The information acquired on the Fourier plane is shown
as a mutually interfered fringe pattern between the Fourier transformed value
The intensity of this interference fringe pattern is called the joint power spectrum (JPS). Therefore, JPS, the intensity of the interfered light acquired with a light detector on the Fourier plane, can be expressed as in Eq. (3)
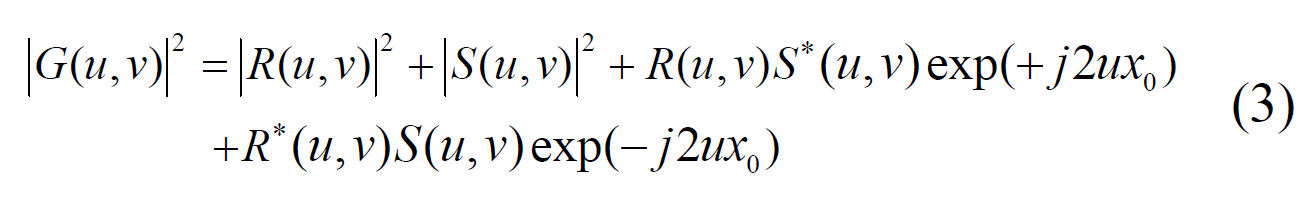
Here, * is the phase conjugate,
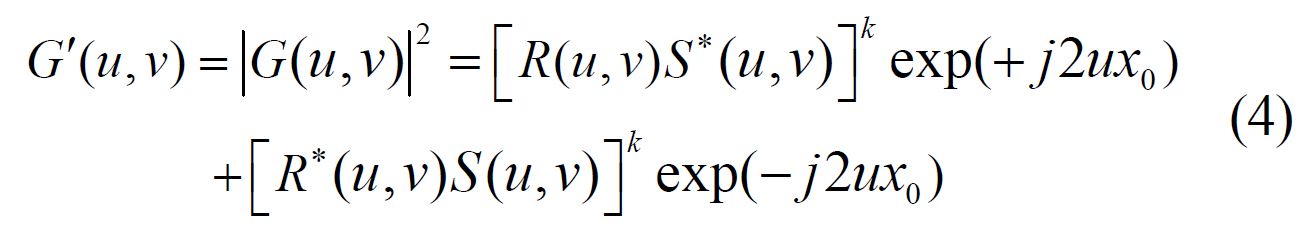
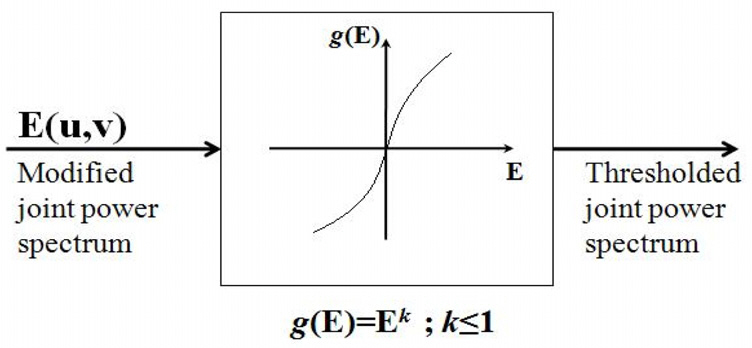
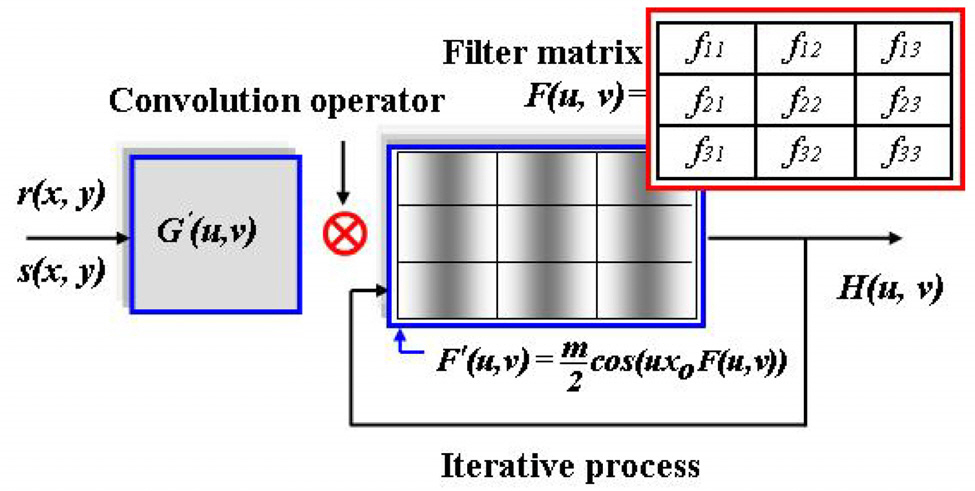
This paper proposes a new technique of modifications of the interference fringes by adopting a sinusoidal amplitude modulated iterative filter in frequency domain. The proposed iterative filter has frequency domain variables and it convolves with the JPS excluding the DC terms,namely
where
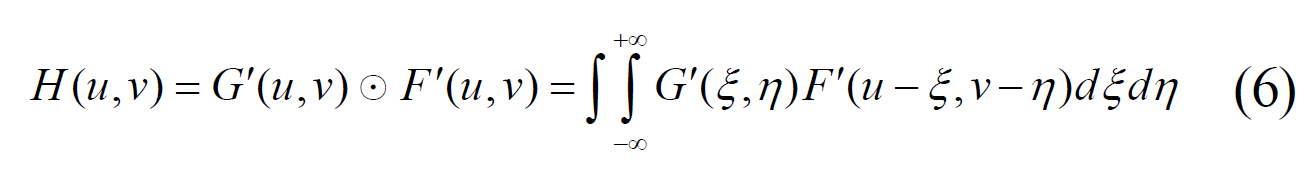
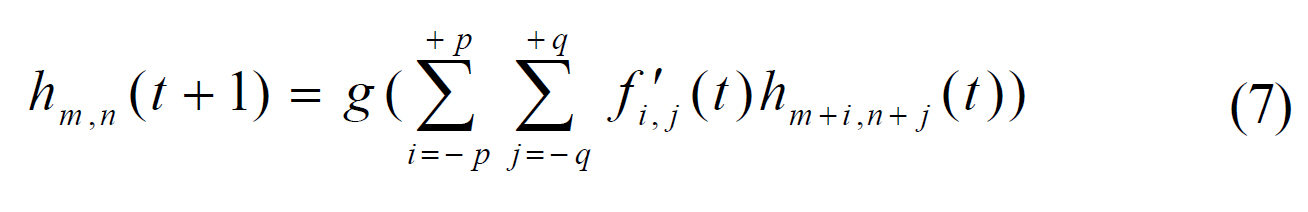
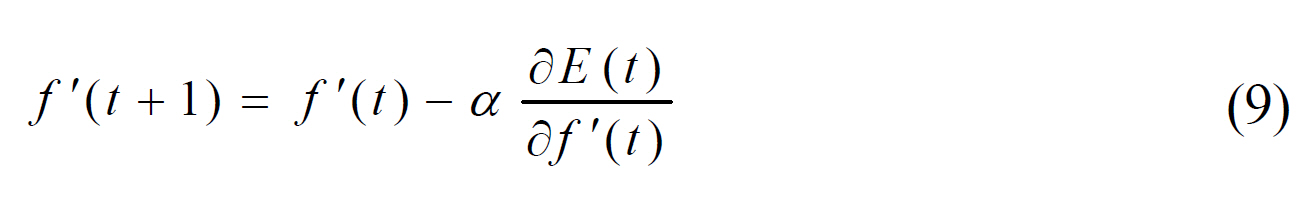
Here, ⊙ denotes convolution. Now, let’s explain the iteration process in more detail. The output
Here,
Here,
Here,
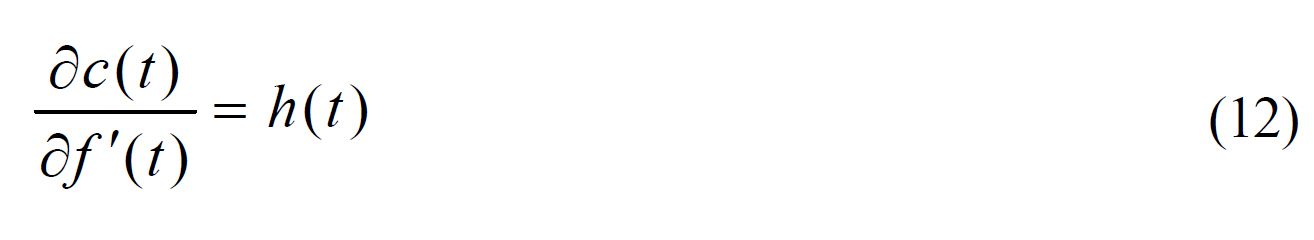
The second term in Eq. (10) can easily be computed,because the function
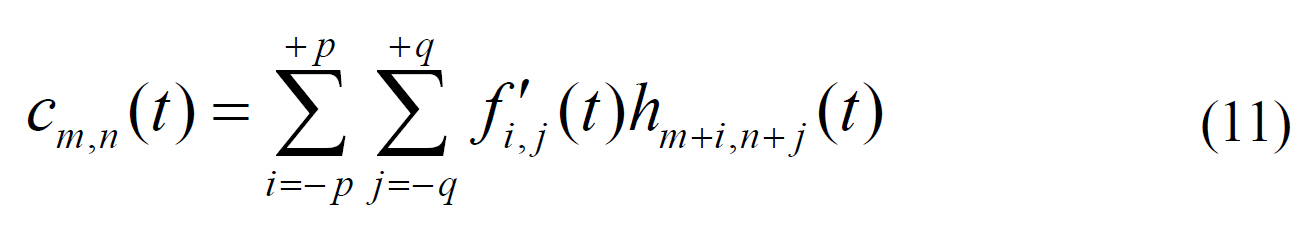
Therefore
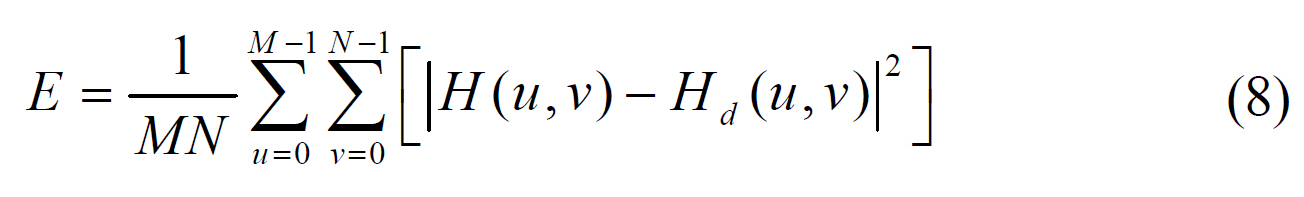
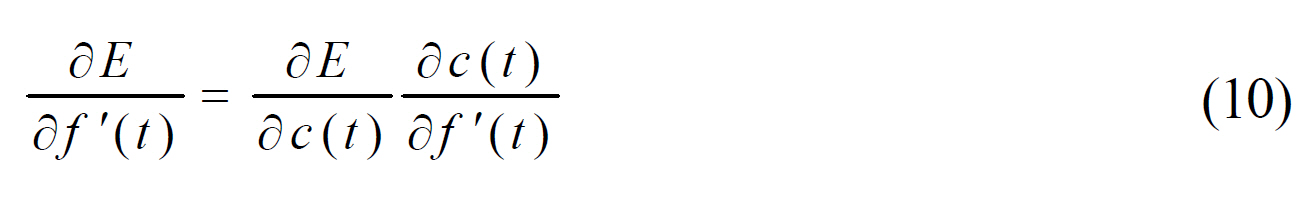
The first term in Eq. (10) is called the sensitivity of the error function
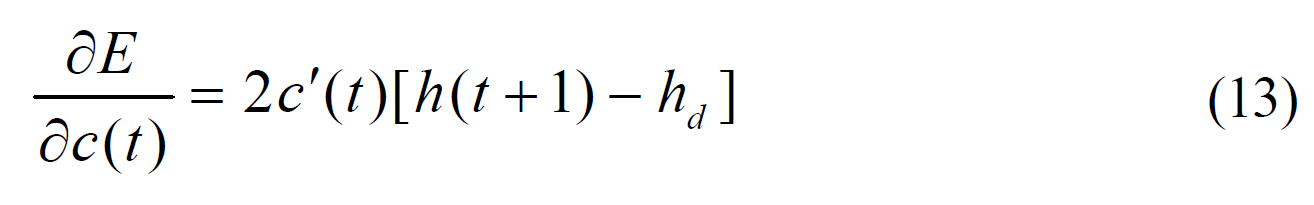
Here,
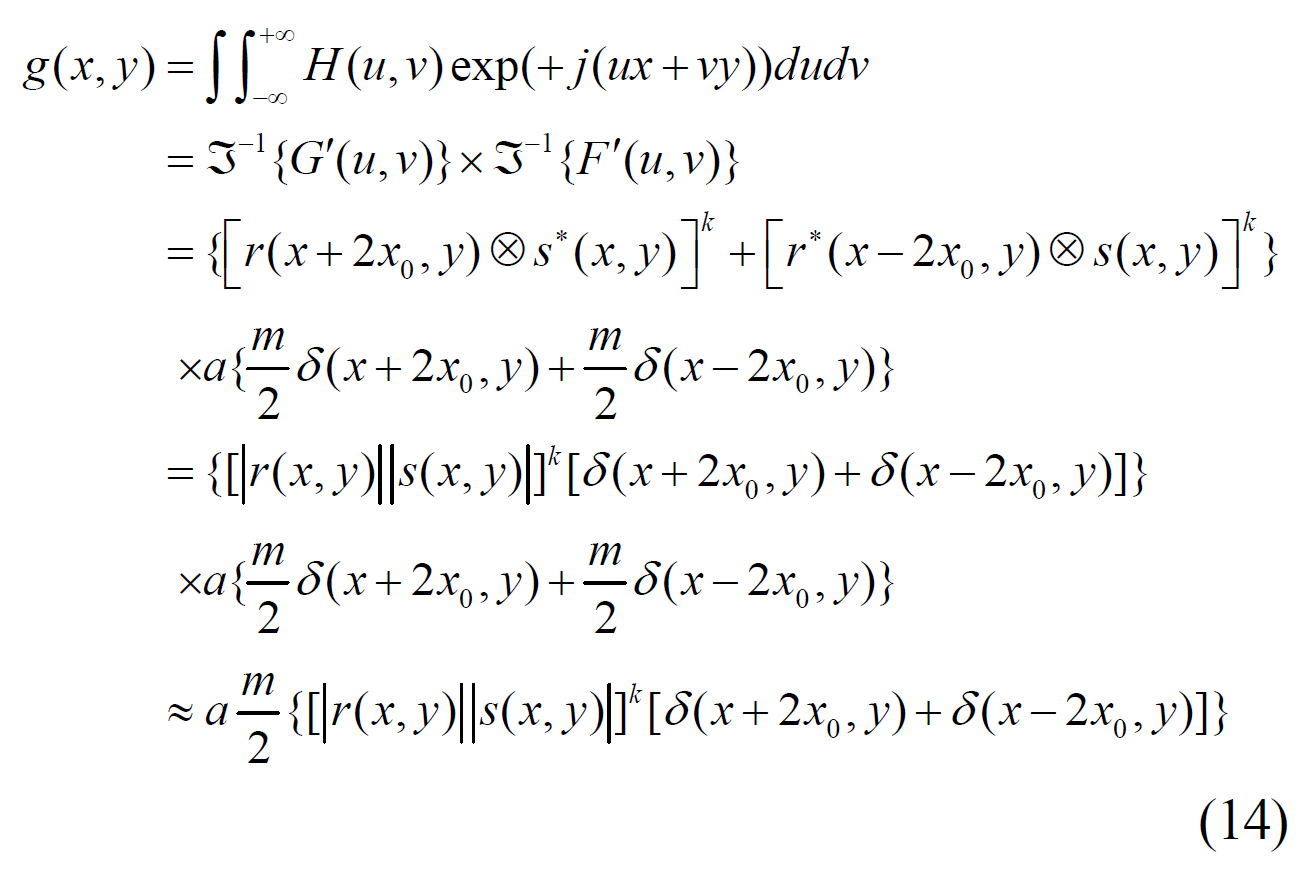
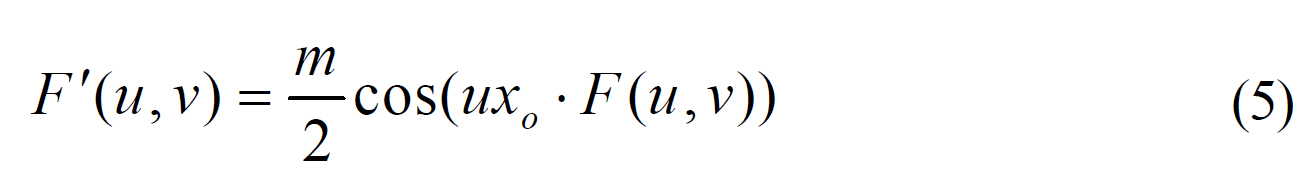
Here, ? is the correlation operator, ??1 is the inverse Fourier transform operator. As mentioned in Eq. (5)
However, if the cosine amplitude modulated iteration filter process is removed, the output is simply the inverse Fourier transform of
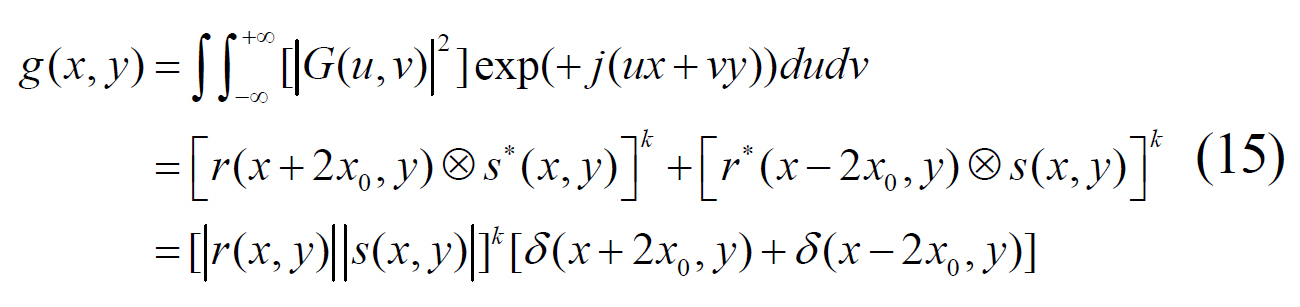
Therefore, Eq. (14) and Eq. (15) show that in the case of using the cosine amplitude modulated iteration filter the correlation peaks can be amplified considerably by a factor of
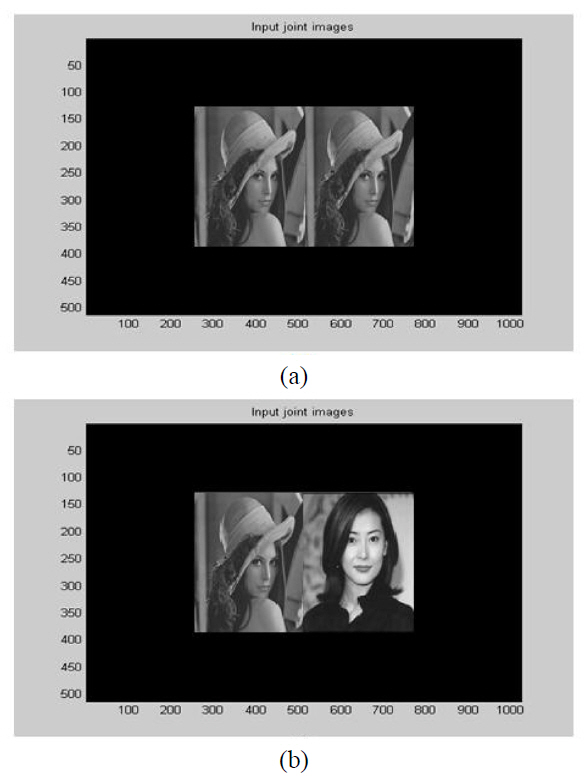
To evaluate the performance of the proposed iterative filter modifying the interference fringe pattern, we prepared 256×256 gray input joint images of a portrait. In Fig. 4,the top image is for a match case and bottom image is for a mismatch case In this paper, we introduced two widely used parameters; the correlation peaks and PSNR. Correlation peaks are the peak magnitudes of the correlated signals. If we let the correlation peaks be '
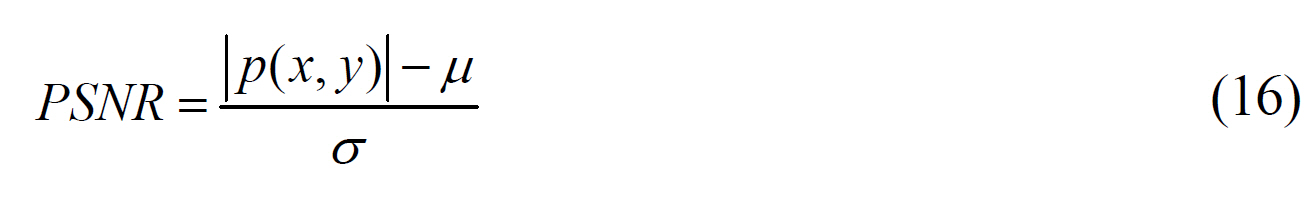
Here,
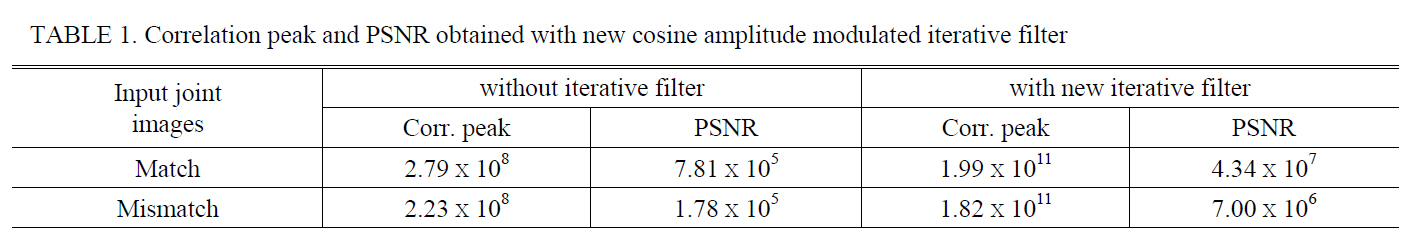
Table 2 shows the ratio of the correlation peaks and PSNR for the cases of adopting the iterative filter processing and for not adopting it. In this paper we classified three types
[TABLE 1.] Correlation peak and PSNR obtained with new cosine amplitude modulated iterative filter

Correlation peak and PSNR obtained with new cosine amplitude modulated iterative filter
[TABLE 2.] Ratio of the correlation peak and PSR for three types of iterative filter
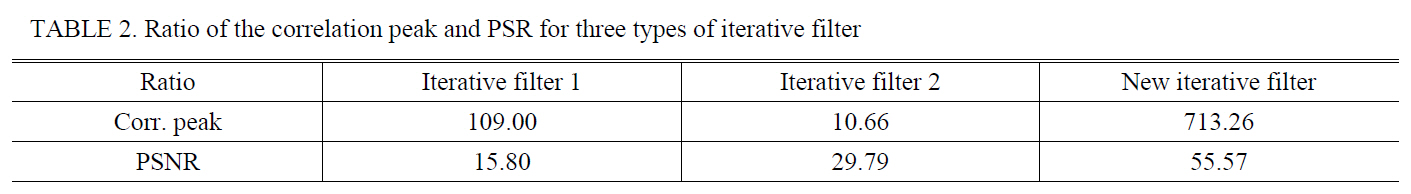
Ratio of the correlation peak and PSR for three types of iterative filter
of the iterative filter convolution processing. All of the obtained values of the ratio shown on Table 2 are for the match case, representatively. The left side of Table 2 is for the case of using Alam’s iterative filter processing[13], the middle of Table 2 is for the case of using our previously presented iterative filter processing [14], and finally the right side of Table 2 is for the case of our new cosine amplitude modulated iterative filter processing.First, for the case of using Alam’s iterative filter in the spatial domain, concerning the correlation peaks, the iterative filter process yields enhanced results that are a maximum of 109.00 times better than those for the case without the iterative filter processing. Now, concerning the PSNR, the iterative filter process yields enhanced results that are a maximum of 15.80 times better than those for the case without the iterative filter processing. Second, for the case of using our previously presented iterative filter in the spectrum domain, concerning the correlation peaks, the iterative filter process yields enhanced results that are a maximum of 10.66 times better than those for the case without the iterative filter processing. Now, concerning the PSNR, the iterative filter process yields enhanced results that are a maximum of 29.79 times better than those for the case without the iterative filter processing. Finally, for the case of using our new cosine amplitude modulated iterative filter processing in the spectrum domain, concerning the correlation peaks, the iterative filter process yields enhanced results that are a maximum of 713.26 times better than those for the case without the iterative filter processing.Now, concerning the PSNR, the iterative filter process yields enhanced results that are a maximum of 55.57 times better than those for the case without the iterative filter processing. Thus, by investigating the results of Table 1 and Table 2, we can say finally that the correlation peaks and the PSNR increased rapidly for the new cosine amplitude modulated iterative filter. In contrast, concerning the efficiency of the discrimination which is the correlation peak ratio between the case of the match and mismatch,Table 1 and Table 2 do not indicate that there is an enhancement by using the cosine amplitude modulated iterative filter. However, concerning the PSNR ratio between the
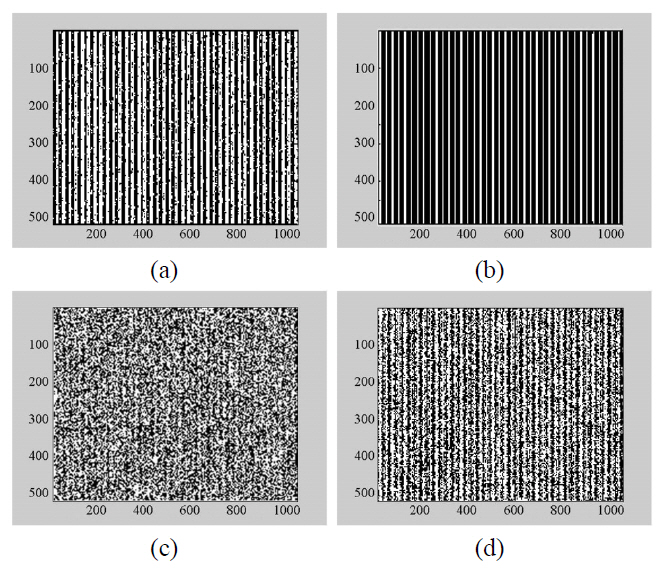
case of the match and mismatch, the results show that there is a considerable enhancement. Thus, we can conclude that the noise contained in the interference fringe pattern is considerably reduced through the cosine amplitude modulated iterative filter convolution processing. This point is very important, so we can say that an ability to determine the match or mismatch in the case of the input images containing some noise or to find an actual image among the clustered images is enhanced considerably. Thus, our results can be efficiently used for tracking an actual image among noisy or clustered images. Fig. 5 shows the interference fringe pattern obtained with the input joint images of the portrait for the cases of adopting the cosine amplitude modulated iterative filter processing and for not adopting it. Fig. 5(a)and Fig. 5(c) are for not adopting it, and Fig. 5(b) and Fig. 5(d) are for adopting it. Fig. 5(a) and 5(b) are for the match case, and Fig. 5(c) and 5(d) are for the mismatch case. Fig. 5 proves the conclusions mentioned above, that
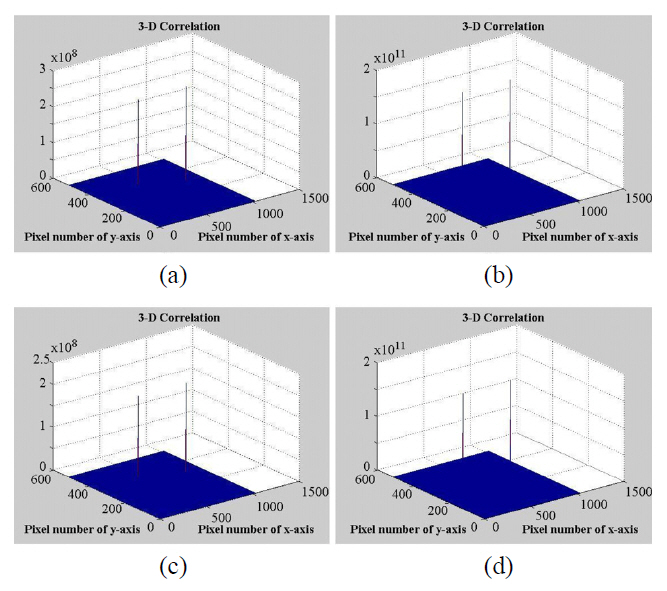
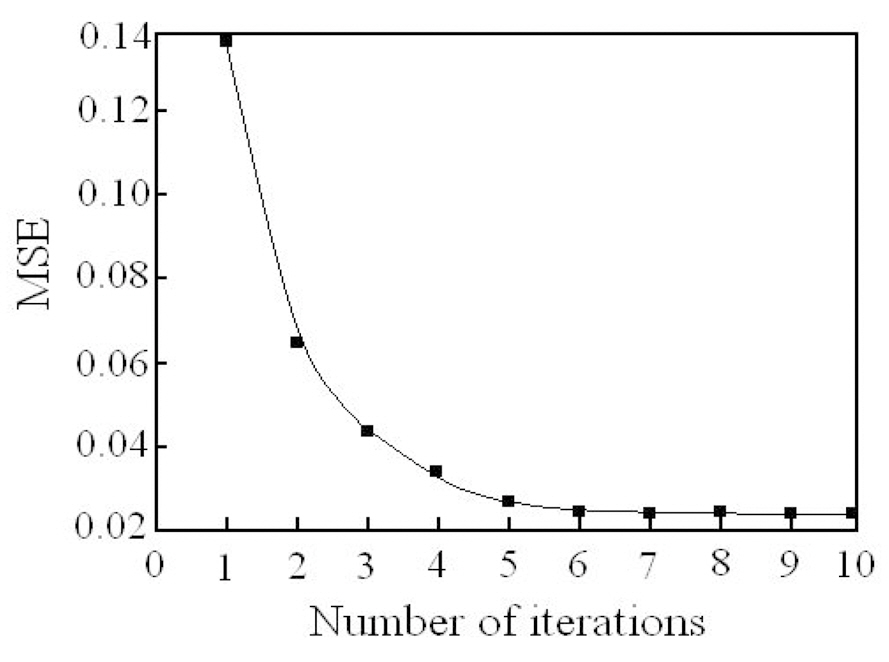
is, the proposed iterative filter convolution process in JPS domain successfully achieved good enhancement of interference fringe shape reducing the noise but increasing the contrast. Fig. 6 shows the three dimensional pictures of the correlation peaks of the input joint images comparing the changes in values without the cosine amplitude modulated iterative filtering and with the iterative filtering process.Fig. 6(a) and Fig. 6(c) are for not adopting it, and Fig.6(b) and Fig. 6(d) are for adopting it. Fig. 6(a) and 6(b)are for the match case, and Fig. 6(c) and 6(d) are for the mismatch case. Fig. 7 shows the error function according to the iteration step.
In this paper, a new technique of modifications of the interference fringes by adopting sinusoidal amplitude modulated iterative filter processing instead of simple iterative filter processing was presented. The proposed sinusoidal amplitude modulated iterative filter has frequency domain variables and it convolves with the JPS excluding the DC terms.Experimental results showed that the proposed technique can successfully increase the correlation peaks and PSNR compared with other techniques.