We report an application of full-field optical coherence tomography (FF-OCT) for identifying counterfeit bank notes. The depth-resolved imaging capability of FF-OCT was used for tomographic identification of superficially-identical objects. By retrieving the internal structures of the security feature (cash hologram)of an original banknote, we could demonstrate the feasibility of FF-OCT to identify counterfeit money.The FF-OCT images showed that the hologram consisted of micron scale multi-coated layers including an air gap. Therefore, it is expected that FF-OCT has potential as a new non-invasive tool to discern imitation of currency, and it would find applications in a wide field of counterfeit sciences.
Optical coherence tomography (OCT) is a well-established modality which gives non-invasive and non-contact threedimensional images of biological specimens with micron resolution [1-3]. OCT measures the amplitude of the light field that is back-scattered from a sample with a broad spectrum source. As extension of OCT, full-field OCT (FF-OCT)has been proposed. It provides en-face optical slicing of a living sample with a sub-cellular resolution [4]. FF-OCT is based on a Michelson interferometer, where beams are guided with bulk optics like lenses in free-space. By using full-field illumination with an extended light source,parallel detection of the sample plane is performed with a two-dimensional pixel array and without any lateral scanning. The key feature of FF-OCT is the remarkable imaging resolution compared with other OCT methods.Because of the extremely broad spectrum of a thermal light source such as a halogen lamp, the depth (Z) resolution down to ~ 1 ㎛ can be easily achieved [4]. Further, high transverse (XY) resolution is also possible with the configuration of high numerical aperture (NA) microscope objectives. Such characteristics of FF-OCT have offered enhanced contrasts for microscopic structural identification in wide variety of fields, from medical biology [5], clinical pathology [6] and cell biology [7] to even the material industry [8]. Recent application of the scheme has been expanded to biometric-based forensic science in which FFOCT using a swept laser source has been demonstrated for fingerprint authentication [9]. However, despite the extensive utilization of the OCT technique, there has been no approach for identifying documents, specifically, for identification of counterfeit money or banknotes.
Banknotes are one of the most frequently- and prevalentlyforged items. Due to powerful printing technologies and scanner systems, counterfeiting has been highly specialized and of high enough quality to easily cheat general money counters. According to the 2006 US currency report published jointly by the US Secret Services and the Department of the Treasury, out of the 760 billion US dollars in circulation,61 million dollars in counterfeit notes were passed to the public worldwide in 2005, which is the rate of nearly 1 dollar for every 12,400 dollars in circulation [10]. In European countries, there has been a rapid growth in fake euro banknotes since the launch of the currency in 2002;according to the European Central Bank (ECB), the fake euro notes seized by authorities in the second half of 2009 was 8% higher than in the first six months [11]. In China,the counterfeiting rate of high-denomination bills (100 Yuan) has jumped more than 22.3% in 2008. Although the absolute number of counterfeit notes is a small proportion of the total genuine notes in circulation, there have still been deep concerns for the risk of massive circulation. To eradicate the circulation of the counterfeit note, more security features have been utilized in the newly issued notes, allowing non-experts to easily spot forgeries with the naked eye or with simple testing devices. However,because all of these identifications depend only on external observation of the security features, they can be easily fooled and tampered with by mimicking these features.Therefore, the internal features, unique to security objects,can be a new indicator for anti-counterfeiting measures.
In this paper, we demonstrate for the first time, to our knowledge, the feasibility of FF-OCT for counterfeit bank note detection by probing the internal structure of the security features of paper money. From the results found,we show FF-OCT would be a new powerful tool for security and document identification across counterfeit science fields.
II. SYSTEM DESCRIPTIONS AND IMAGING PERFORMANCES
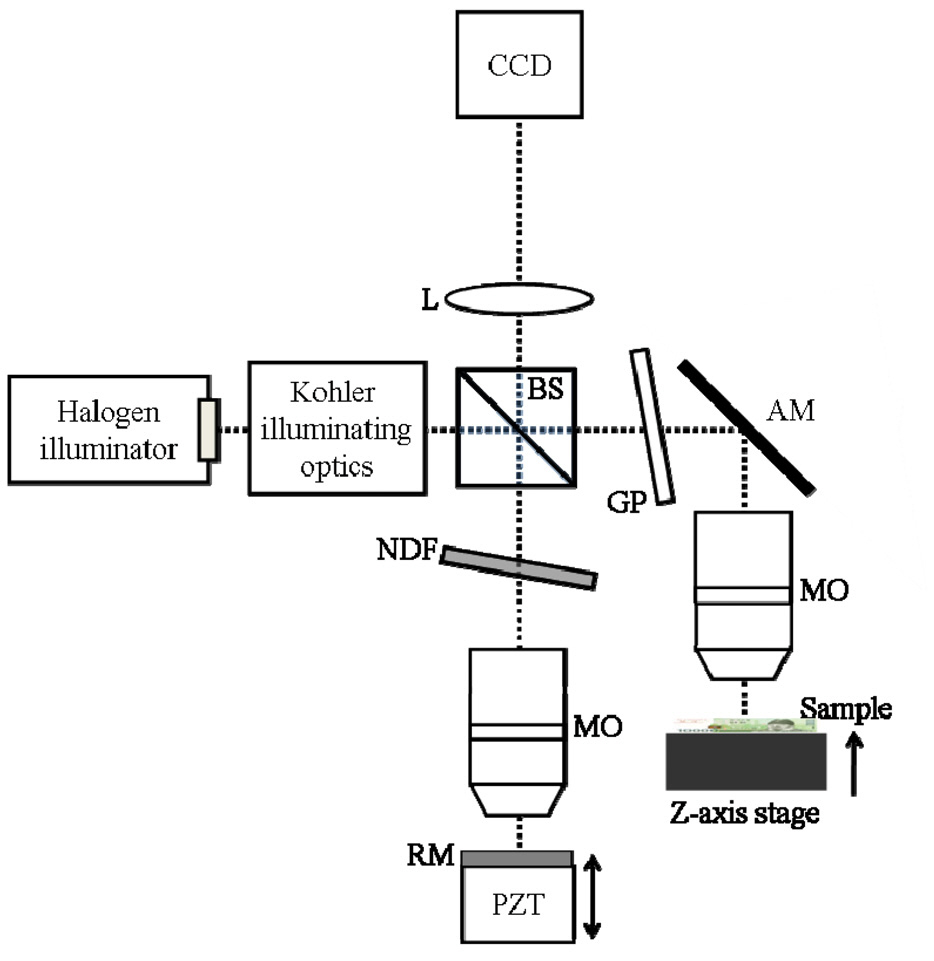
The schematic of the experimental set up is presented in Fig. 1. It is configured on a Linnik type bulk Michelson interferometer with a pair of microscope objective lenses(10X, 0.3 NA, from Olympus, MO) [4]. A typical microscope illuminator with an 100 W halogen lamp (KI-100W, Korea Instech) is used, incorporated with an incoherent fiber bundle having a 7 mm diameter. Uniformity of the light emitting from the end-face of the fiber bundle is adjusted by using a series of lens and iris sets. The light is delivered to the interferometer and split into reference and sample arms by a non-polarized beam splitter (BS). The beams retro-scattered at both arms are recombined with the same BS, and interfere with each other when the round trip optical path difference is within the coherence length of the light source (~ 1 ㎛). The interference image is projected onto a digital CCD camera (CCD1020, 20 fps,1024×1024 pixels, VDS) through an achromatic doublet lens with a 250 mm focal length. Then the 12 bit digitized readout signal is taken via a frame grabber (NI PCI-1428,NI) and displayed at a computer screen.
A sample is placed on a moving stage having a 100 nm stepping resolution along the Z axis. A neutral density filter (NDF) and an equally-thick glass plate (GP) are inserted into the reference arm and the sample arm, respectively,to maximize the interference fringe contrast. In the reference arm, a reference mirror (RM) with 99% reflectivity in the visible range is attached to a piezoelectric actuator(PAZ005, Thorlabs, PZT) to make sinusoidal oscillation at f = 5 Hz. This oscillation generates variation of the optical path length of the reference arm, leading to time modulation of the interference intensity on each pixel of the CCD. The CCD is triggered with a rate of 20 Hz (4f) and synchronized with the PZT oscillation, saying that the CCD captures four phase-modulated interference images during one PZT modulation period. From the captured-andstored four CCD images, with simple computational manipulations,one sheet of
The axial resolution of the system is determined by the effective coherence length of the illumination source, which is inversely proportional to the spectral bandwidth [4]. The available effective spectrum is limited not only by the source spectrum but also by the spectral responses of the optical components in the system. In our system, the
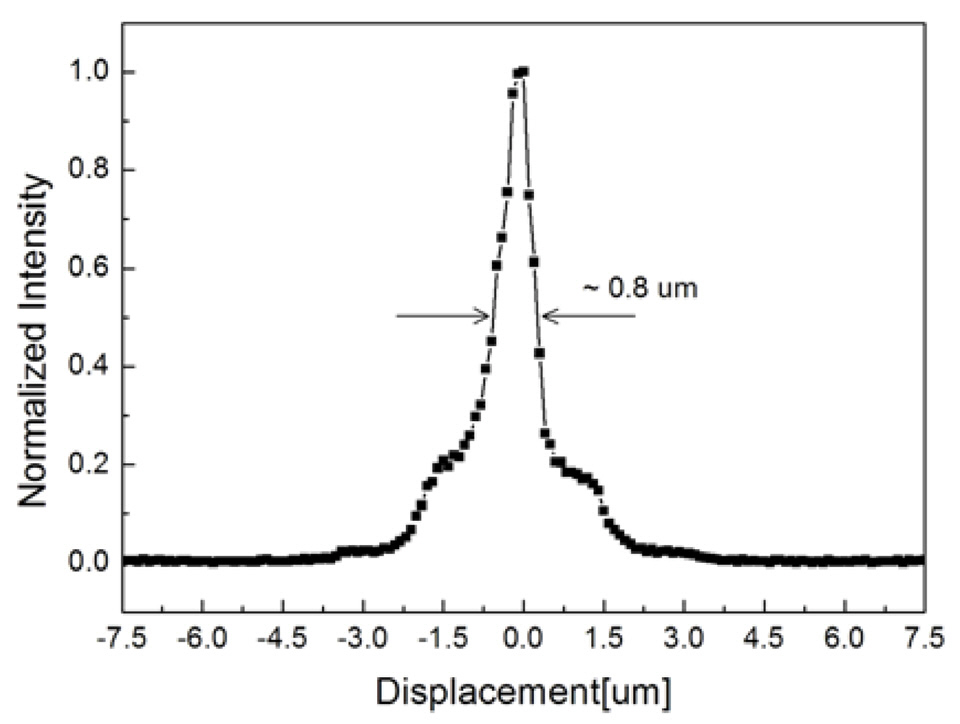
effective spectrum is mainly limited by the CCD; it has a bandwidth of 220 nm in FWHM (full-width at half maximum) centered at λ = 650 nm. Then, according to the axial resolution equation [4], the theoretical axial resolution is calculated as 0.64 ㎛ in water (n = 1.33). To measure the axial resolution experimentally, we acquired 150 FF-OCT images of a flat mirror surface by moving the object with steps of 0.1 ㎛ using a high-precision linear stage, and the intensities at a particular CCD pixel location of the FF-OCT images were plotted in terms of the sample depth (Z) position. Figure 3 shows the measured axial (Z) profile of the point spread function (PSF). The FHWM of the PSF is 0.8 ㎛, corresponding to the axial resolution of the system. Discrepancy between the theoretical and the experimental values may be due to residual dispersion mismatches between the two interferometer arms and to optical aberrations. However, the transverse resolution of an imaging system fully depends on the NA of the
microscope objective. In our case, we used the 0.3 NA lens and experimentally confirmed that the transverse resolution was better than 2 ㎛.
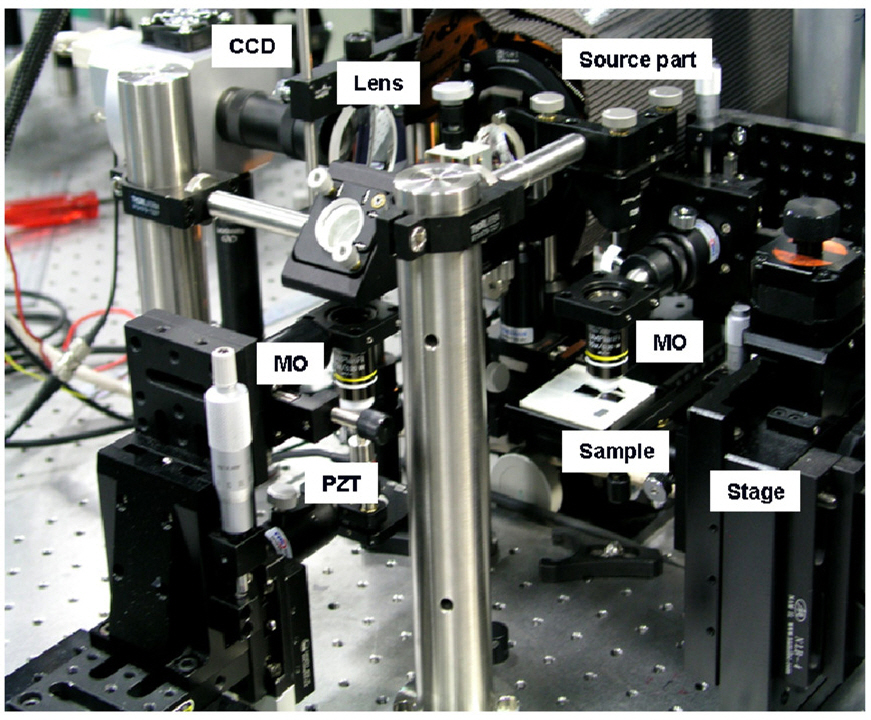
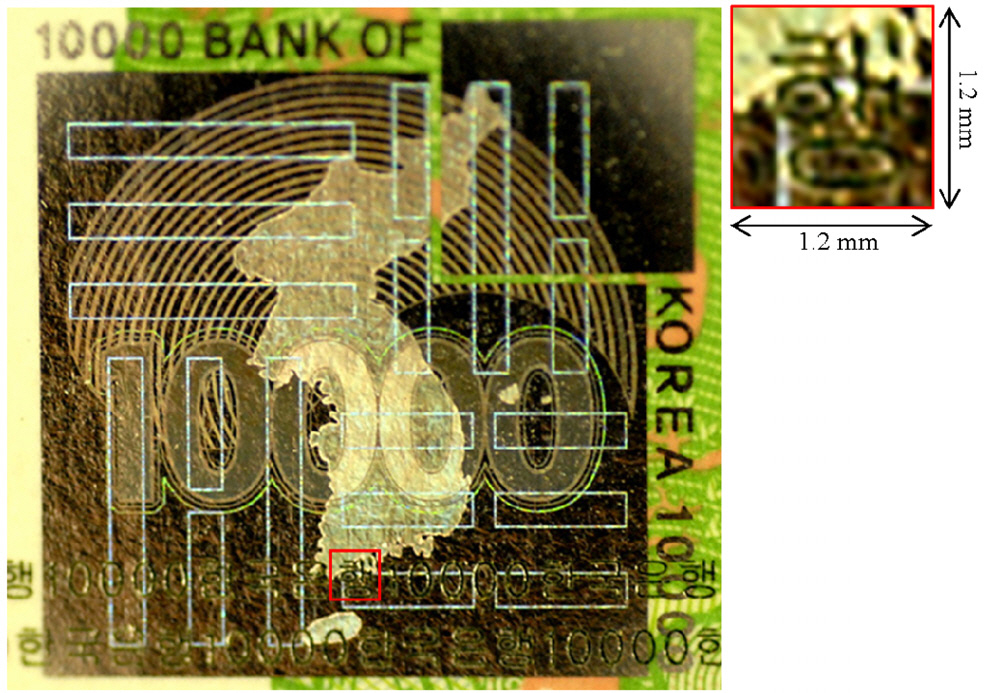
To validate the system feasibility for counterfeit document identity, tomographic imaging on the security features of a genuine bank note (paper money) was made with the home-made FF-OCT shown with Fig. 2. Among the security features, we chose to image the hologram imprinted on the original bank note of 10000 Korean Won. Figure 4 is a photograph of the hologram label on the Korea banknote.It has many features including the Korean peninsula map,four trigrams, numbers and characters. Among them, the region of interest (ROI) of the hologram to be imaged was chosen as the place noted with a red rectangle (1.2 mm×1.2 mm) in Fig 4. The enlarged view is shown as the inset of Fig. 4. We observed that the hologram was covered with a transparent sheet of film and Korean characters were finely plated on the film. A total number of 79
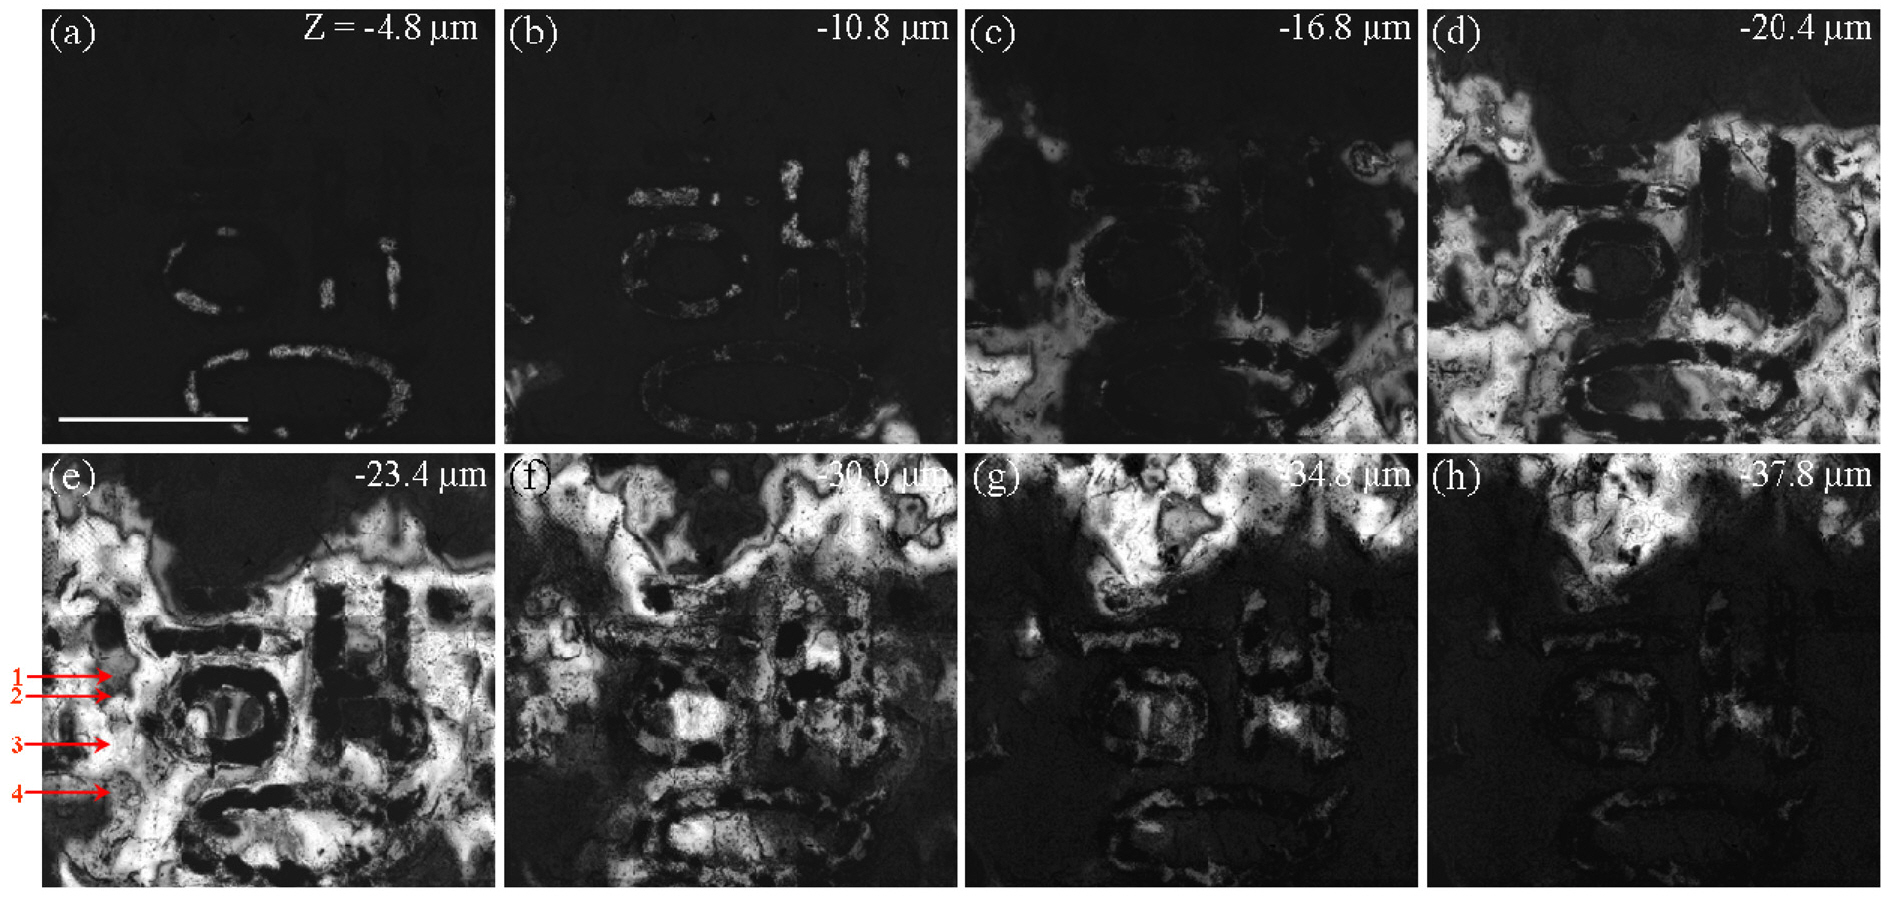
Figure 5 shows some of the depth-resolved FF-OCT images of the hologram. At first, one can see the surface of the imprinted character (Korean character, 행) with Fig.5(a-b) and then the thin film layer with Fig. 5(c)consecutively. After that we can see the hologram partly blocked by the character with Fig. 5(d); the character could not be seen but it blocked the images underneath. In Fig. 5(e), we could see the multi-faces in the hologram,which are partially visible due to the poor flatness of the
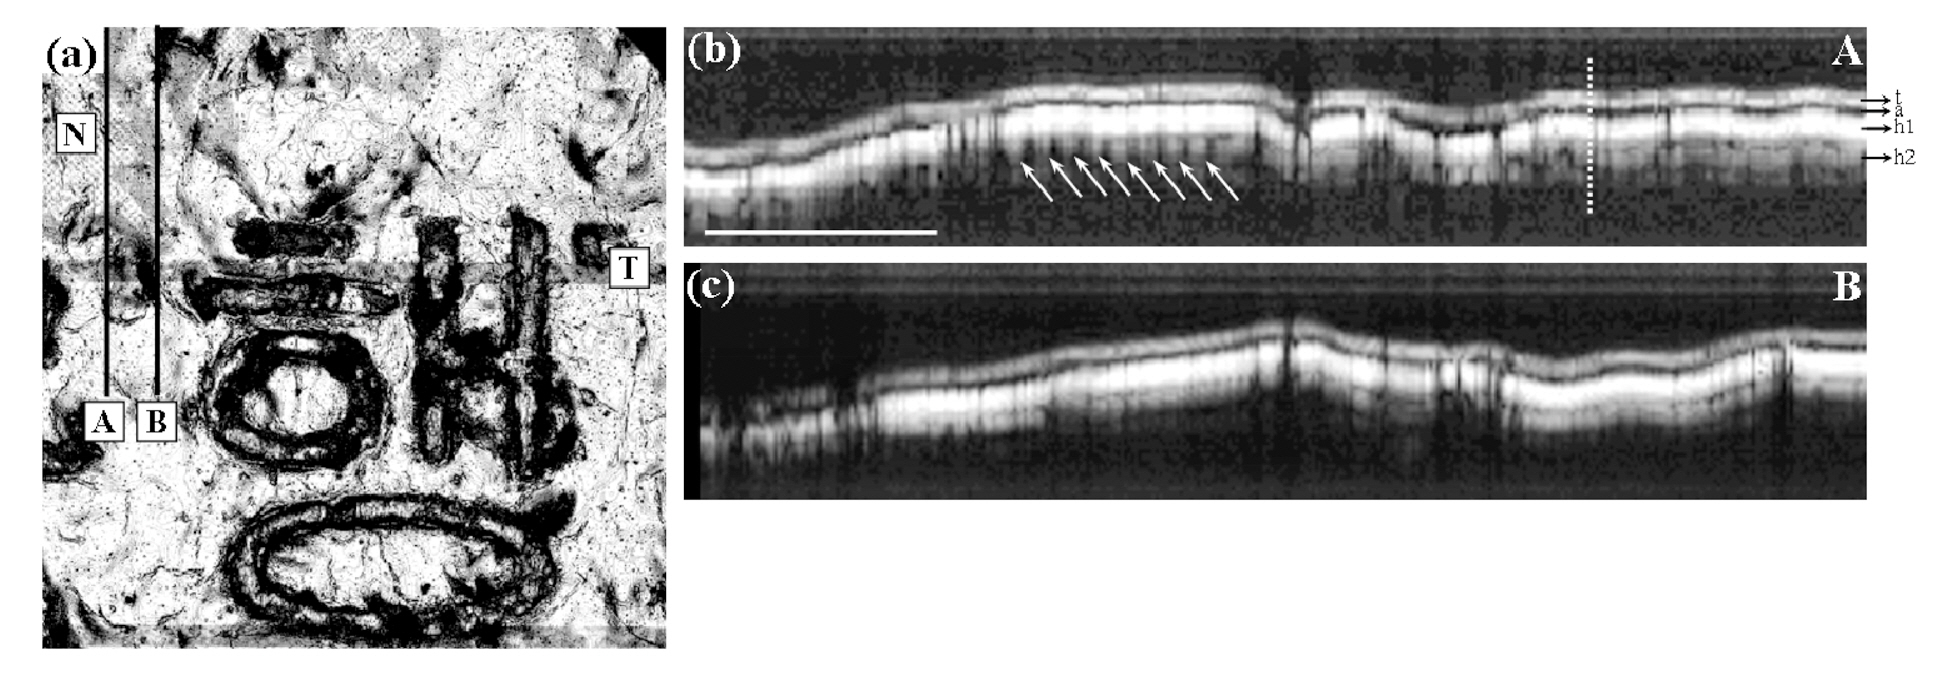
hologram surface. We carefully presume that the features marked with red arrows in Fig. 5(e) were originated from the thin film (1), air gap between surface of the hologram and the thin film (2), and unidentified holographic layers(3, 4), in that order. At 30.0 ㎛ depth in Fig. 5(f), the character began to reappear. It is thought that the reappearance of the character in Fig. 5(f) and 5(g) is due to the large refractive index of the printing material [7]. At the interface between the bottom of the character and the top surface of the film, the light is reflected and gives a signal, but the image location is appreciably shifted due to the refractive index of the printing material.
The hologram structure was reconstructed with the stack of
We have demonstrated the feasibility of full-field optical coherence tomography (FF-OCT) for identification of counterfeit bank notes. A FF-OCT system was implemented with the scheme of white-light interferometry, full-field illumination, and phase-shifting to extract high resolution