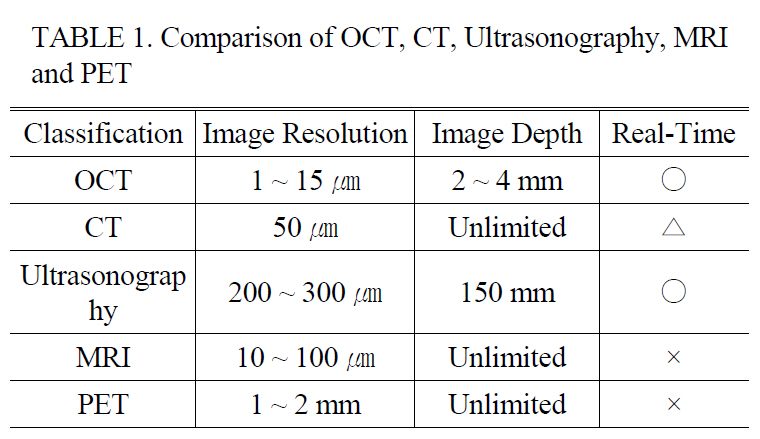
Optical Coherence Tomography (OCT) has been widely accepted as a non-invasive imaging modality with a high resolution for in vivo biological specimens. It has been successfully applied to early diagnosis of many diseases such as various cancers that develop under the surface of the body [1-4]. As shown in Table 1, OCT contains unique advantages over other medical modalities such as Computed Tomography (CT), Magnetic Resonance Imaging (MRI) , Positron Emission Tomography, and Ultrasonography in terms of the image resolution, size, portability, and cost [5]. After the emergence of spectral domain OCT (SDOCT) and swept source OCT (SSOCT), the real time imaging and displaying feature becomes one of the major competing categories[6-8]. The acquisition speed for SSOCT and SDOCT has increased rapidly to >370,000 line/s and 312,500 line/s, respectively. Such ultrahigh acquisition speed enables monitoring of more dynamic processes occurring in biological and nonbiological applications such as eye blinking, nystagmus phenomenon to light exposure, and embryonic cardiovascular dynamics. However, real time display is another key parameter to deliver the OCT technology to clinical and industrial fields because events can often be screened by human decision. As one of the drawbacks, using light now available limits scanning depth to 2~3 mm in biological scattering media, but high resolution and high speed displaying features could push this technique actively to commercialization in several applications including ophthalmology and cardiovascular dynamics [1, 2]. The use of the OCT method in otorhinolaryngology has not been well spotlighted so far. There have been a few attempts using small animals to show the need for use in middle ear diseases including acute and chronic otitis media [9]. To be a more useful tool in ear diagnosis, we feel the imminent need to translate the current OCT light delivery method into an easily accessible form for imaging
We report a novel extension of 840nm wavelength-based spectral domain optical coherence tomography (SDOCT) to
[TABLE 1.] Comparison of OCT CT Ultrasonography MRIand PET

Comparison of OCT CT Ultrasonography MRIand PET
was designed to access the middle ear region with a specifically dedicated handheld probe. A-scan analysis of the acquired image could reveal more detailed structural information indicating the pathological status of the specimen which was not feasible with the conventional surface monitoring otoscope. Another novelty of this adaptation is the fact that it can non-invasively acquire morphological information about the inner ear, specially the region below the TM which is not visible unless surgically opened.
II. EXPERIMENTAL SETUP AND RESULT
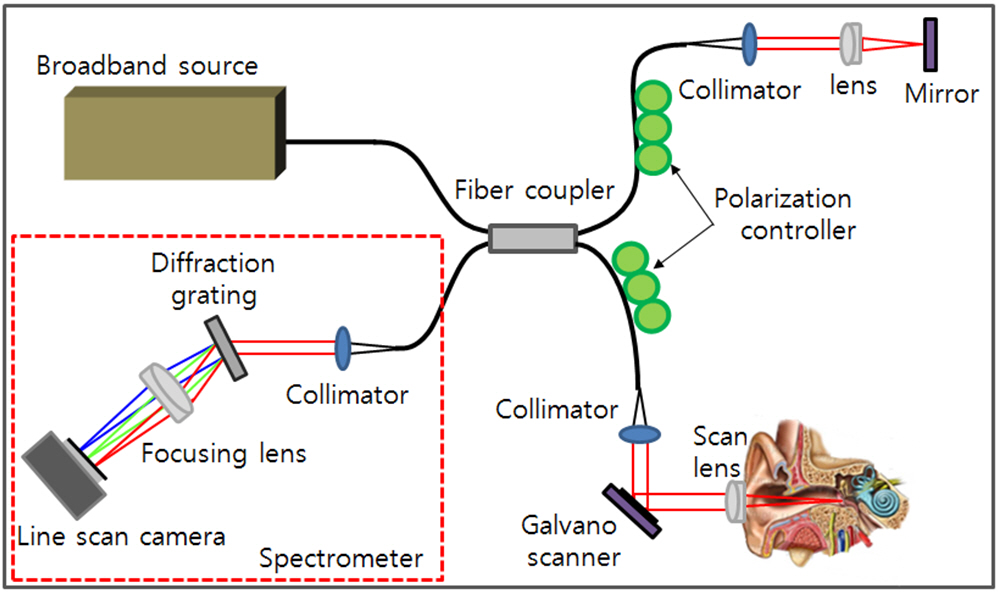
The schematic diagram of the developed SDOCT system is shown at Fig. 1. A 12-bit CMOS line scanning camera (Sprint spL4096-140k, Basler AG, Germany) with 70,000 line/s effective line rate at 4096 pixel mode was used as the detector of the SDOCT system. With junction of a superluminescence diode (SLED) ( λo = 840 nm, Δλ = 55 nm, Superlum Diodes Ltd: SOA-371) as a light source, a fiber-based interferometer was implemented. The light source was split into sample and reference arms with the latter terminated by a stationary mirror. A probe at the end of the sample arm delivered light to a sample and collected back-scattered light from different depths in the sample. B-mode scanning was performed using a galvanometer scanning mirror (Thorlabs: GVS002) at the back focal plane of the objective lens at the sample arm. The output of the line camera was connected to a personal computer (PC) through a frame grabber (NI:PCIe-1429) which has maximum 680 MB/s bandwidth. The galvanometer scanning mirror was driven by the PC with a data acquisition board (DAQ, NI:PCI6115) which can provide analog outputs at 10 MSample/sec.
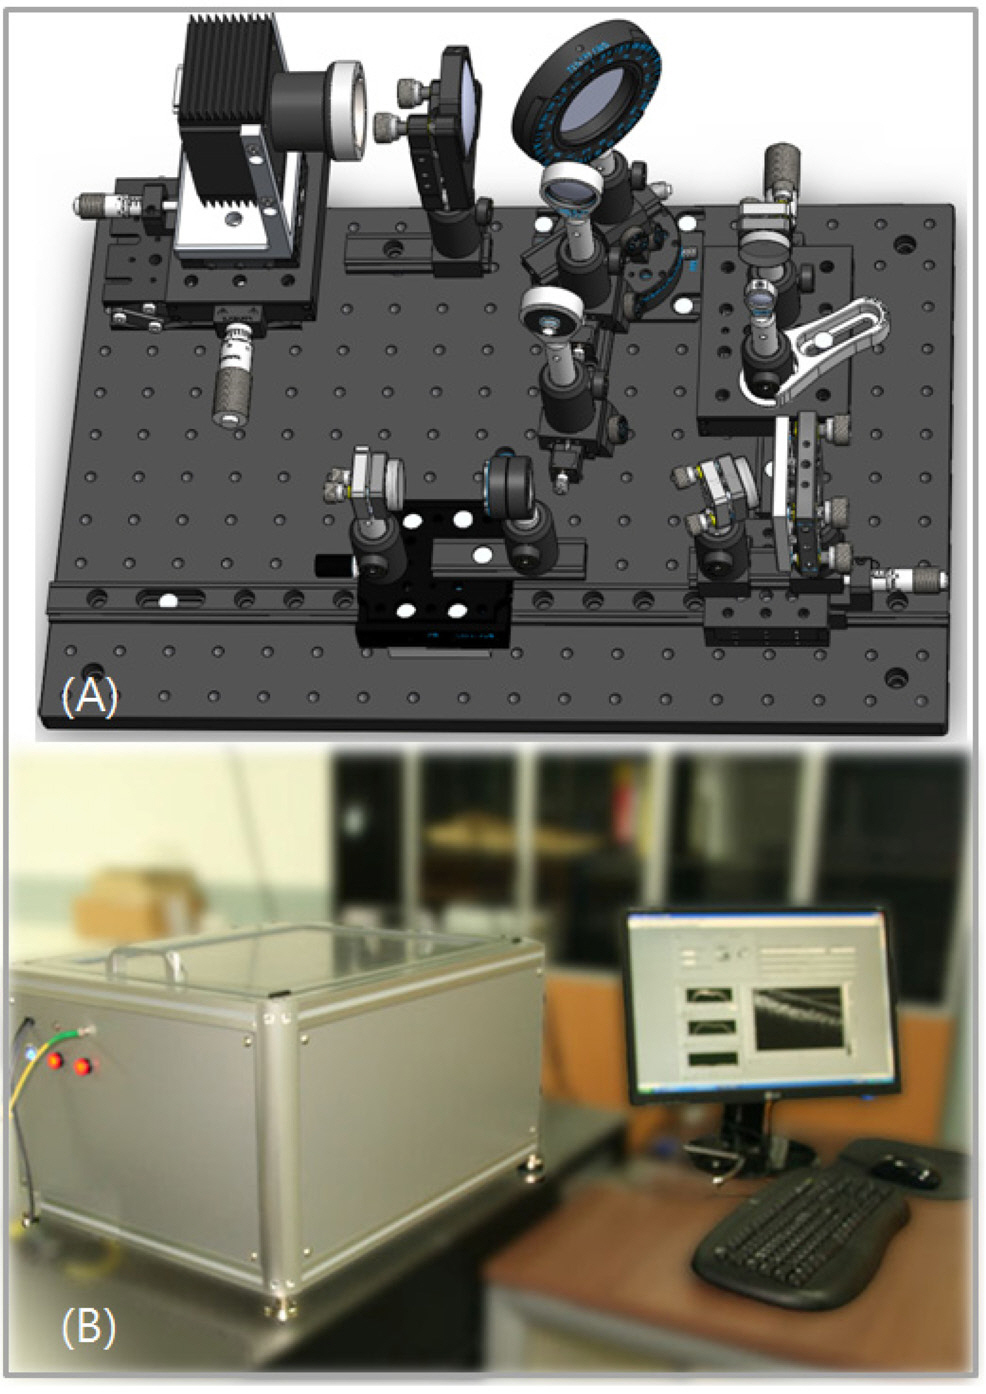
Figure 2-(A) shows the internal structure of the SDOCT designed by utilizing the 3D CAD tool (Solidworks 2008). The location and positioning of the optical components were carefully defined prior to construction. The reference path consisted of two different optical pathlengths. One is for a predefined short pathlength and the other is for a long one to incorporate different sample positioning according to the subject size. The outer/middle ear cavity varies significantly per individual and also per age. The selection of the each pathlength was performed by using a flip mirror. The
detection path included a beam expander to increase collimated beam size which latter induced a smaller spot size at the detection cells of the line scan camera. The transmission type diffraction grating was adapted to enhance light efficiency in the detection path. Figure 2-(B) displays the exterior of the SDOCT system which contained the optical setup for spectrometer and the reference path as mentioned above.All other controllers and power supplies were included in the system.
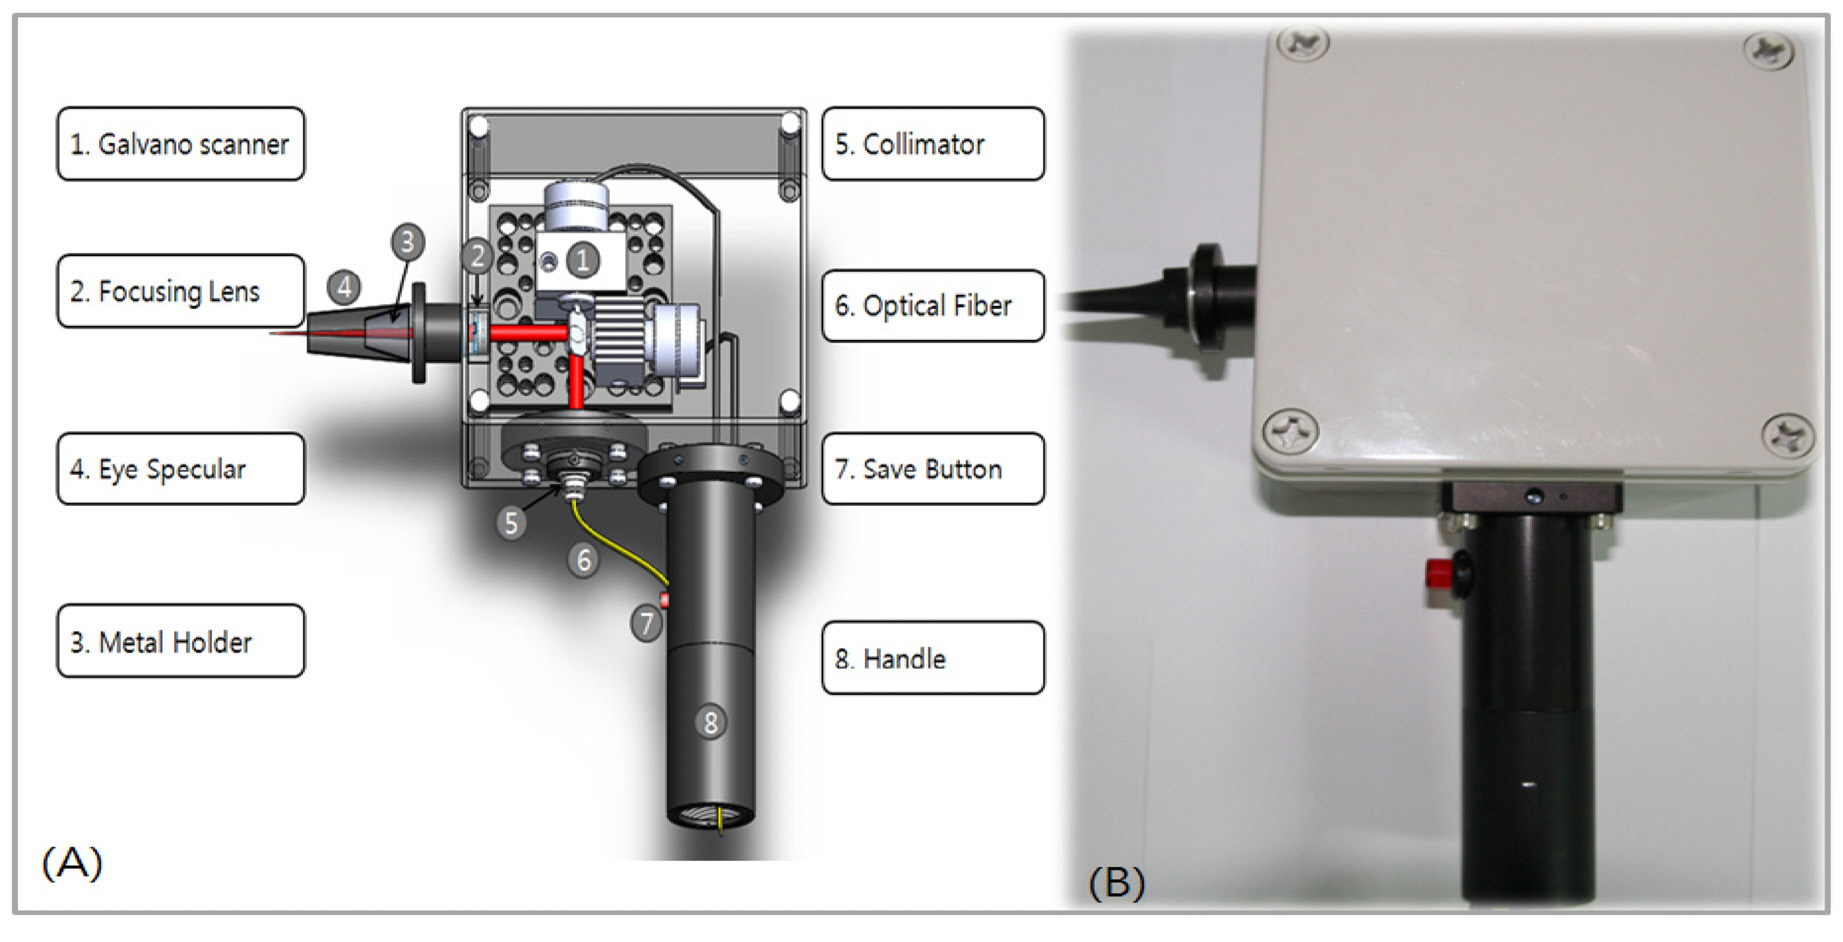
Figure 3-(A) shows the handheld type OCT probe dedicated to middle ear diagnosis. Again, the probe was designed using the Solidworks 2008 software to optimally align the optical and electrical components in the white box as shown at the figure.
Figure 3-(B) displays the constructed OCT type otoscope which included a collimator, a 2 axis galvanometer scanning mirror assembled in the box. The figure contained an adaptor with an objective lens to image the middle ear structure. A handle was mounted to guide the optical fiber and electric wires with an image save button which can save images by simply being pressed. The location and position of the optical and electrical components were carefully determined to minimize any friction and vibration. The adapter containing the lens was designed to be a round shape to easily mount otoscope tips that are commonly used in clinics.
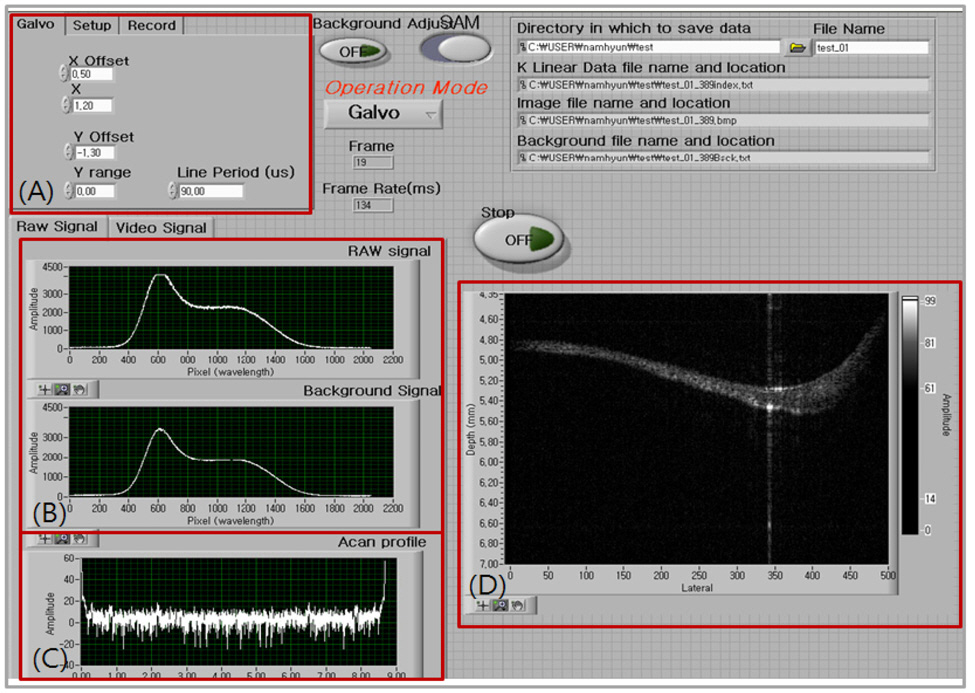
A Labview based software was developed to display the middle ear morphology in real time. A thread sharing technique was used to avoid any possible delay in processing the data. The Labview based programming is usually believed to be too slow for real-time displaying, however we managed to achieve real-time displaying at about 20 frames per second in the Labview based program. Allocations of each different processing such as FFT, K-linearization routine, and background subtraction were assigned to separate threads in the Labview program. The data size for A-scan was 4096 points and 1000 A-scans were acquired to form a two dimensional image. Therefore, we could achieve both flexibility and displaying speed as the advantages of using the Labview programming method in the OCT development. A careful job of sharing CPU processors and optimizing data size through the data path were the tools in achieving the goal. Figure 4 shows the developed Labview based real-time displaying OCT program. In Figure 4-(A) the user could
specify the driving range and the offset of the galvanoscanning mirror including the number of images to save. Figure 4-(B) displays the raw spectral signal from the frame grabber whereas A-scan results could be observed after taking Fast Fourier Transform (FFT) with acquired signals. The final depth image was displaying in Figure 4-(D).
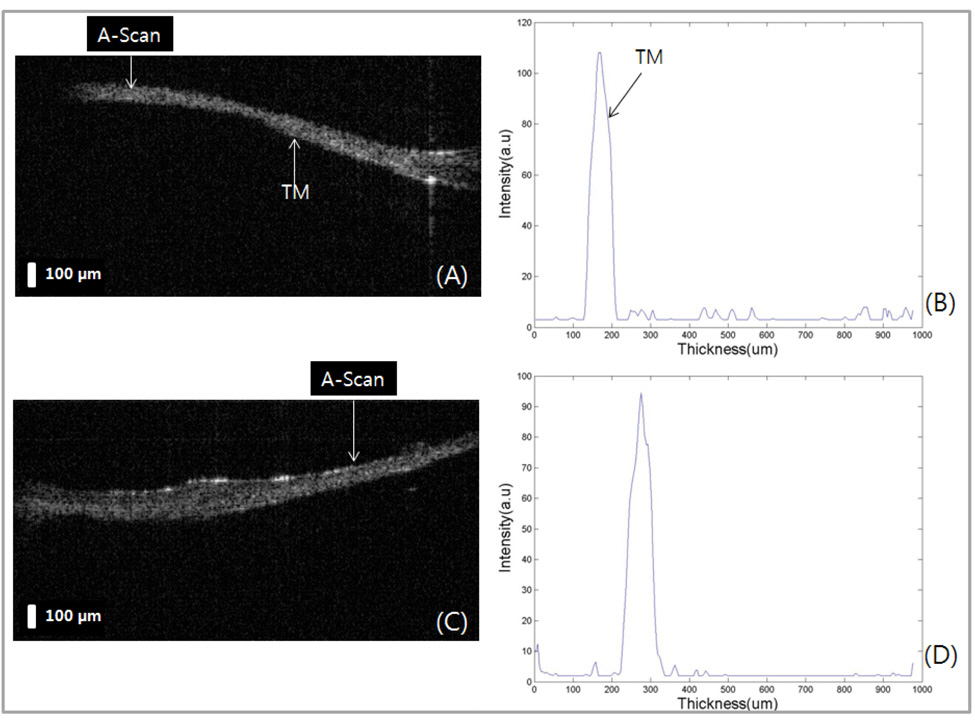
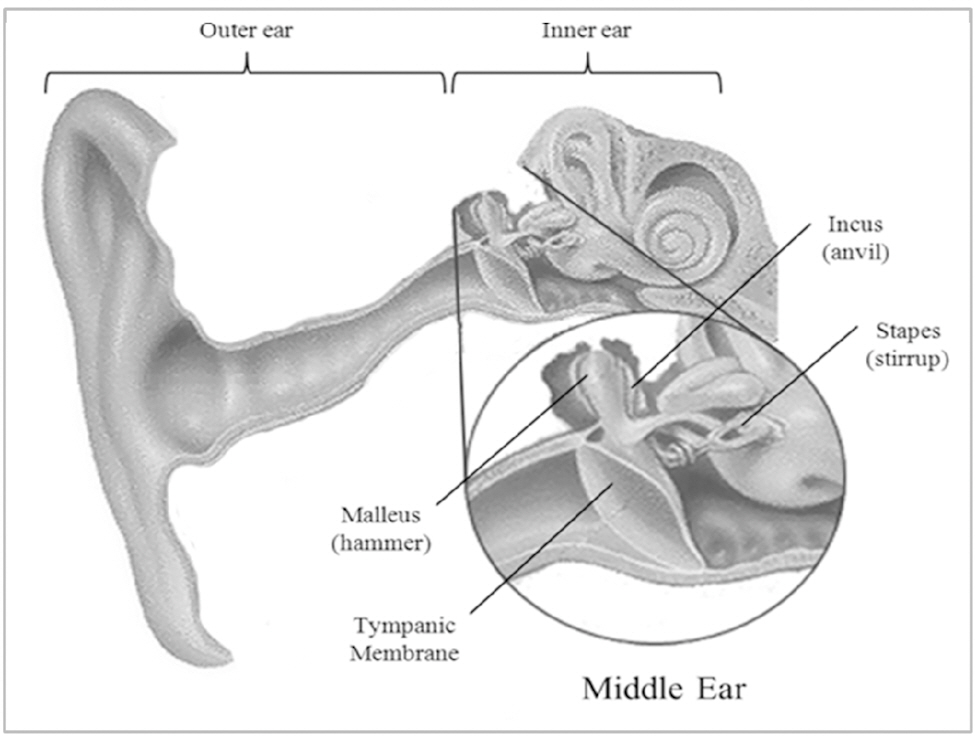
The system performance was evaluated by imaging human TMs in vivo as shown Fig. 5. The inner ear structure of a healthy male volunteer was imaged with the developed system with the axial and lateral resolutions of 15 ㎛ and 30 ㎛,respectively. The anatomy of human TM is shown at Fig. 5.
We imaged two different positions in the same subject (Fig 5-(A) and (C)) and performed A-scan analysis (Fig 5-(B)and (D)). The thickness of TM was measured at about 100㎛. The A-scan analysis of the acquired image could
reveal more detailed structural information indicating the pathological status of the specimen. From two dimensional OCT intensity images we could confirm that the TM contains no pathological symptoms. We use 840 nm centered wavelength so that we can share the same system for ophthalmologic applications.
A novel extension of 840 nm wavelength-based spectral domain optical tomography was applied to