In this paper, an easy-to-use measurement device for illumination distribution is developed. The device consists of a sensor array module, a control module, and a PC interface. The sensor array module incorporates CIE 1931 color sensors and the ARM-based 96 MHz microcontroller in the control module for measurement and data processing. The sensor array module contains 64 color sensors arranged in a 16 × 4 array. The sensitivity of the sensor array module can be adjusted depending on the illumination level to be measured. The measurement data and control signals are exchanged via USB 2.0 standard. To demonstrate the performance of the device, the illumination distribution is measured for colors of red,green, and blue and is graphically shown. The device can be used for measurement of the illumination distribution, design and adjustment of LED illumination.
Nowadays, light-emitting diodes (LEDs) and laser diodes(LDs) for illumination are actively being developed and their basic optical and electrical characteristics are well described in [1, 2]. Due to the commercial potential of LEDs with visible light emission, LED illumination draws a great deal of attention from LED manufacturers, LED driving IC manufacturers, LED backlight unit (BLU) manufacturers, illumination designers, and architects seeking new forms of illumination. LED illumination offers the user numerous advantages, including considerable power reduction, extreme durability, size reduction, a wide color gamut,improved degree of freedom for the illumination shape,and a high resistance to shock and vibration. Furthermore, LED illumination costs less to maintain due to its long lifetime and the fact that the price for the chips per unit of luminous flux is decreasing [3]. As a result, the LED with visible light emission is very useful not only for illumination and LED BLU, but also for the environment and for indoor decorations and advertisements. Therefore, colorful LEDs will be a versatile light source for all those applications. From the illumination point of view, the visible(red, green, blue) LEDs are characterized for illumination devices and colorful displays [4]. The driving current for each LED can be controlled quickly and independently with appropriate driving circuitry to maintain its brightness and color [5, 6]. These two characteristics make a visible LED a prominent candidate for lighting instruments. In such a case, it is necessary to measure illuminance to ensure that an LED lamp provides an illumination level of 300 ? 1500 lx, based on the ISO standard for office work [7]. Since the lighting device based on LEDs is composed of individual LEDs, the illumination on a target surface is patterned, depending upon the density of the LEDs, the LED directionality, the shape of an LED array, etc. Therefore, the measurements of illumination distribution is significant for the design and characterization of LED illumination. Specifically, to analyze the irradiance performances from the LED arrays, the design expressions for illumination uniformity in a near-target plane from LED arrays have been derived [8], and the far-field condition for an array of LEDs is analyzed by LED radiation pattern, array geometry, and the number of LEDs [9]. Moreover, to achieve uniform illumination, a design process using a surface-tailored lens has been proposed[10] and an efficient coupler design has been reported [11].
Except for precise measurements in laboratory experiments or exact calibration processes, the LED is supposed to sufficiently ensure that human eyes perceive that the brightness and color are evenly distributed or that the chromaticity of certain measurement points is well distributed. A certain color measurement needs multi-point calibration with a calibrating procedure [12], and a simultaneous color measurement and white balancing for RGB white LEDs were demonstrated by using a buried double p-n junction (BDJ) photodetector,which was fabricated by the same authors [13]. A chromatic property measurement system for LEDs was developed based on the spectroradiometric method using a photomultiplier[14]. These are not easy-to-use simple measurement devices for LED applications. Furthermore, a hand-held illuminance measurement system with versatile functions[15] is available. To measure multiple points simultaneously,the device needs to connect multiple remote detector heads. Therefore, easy-to-use and fast illumination measurement devices would be useful without a complex measurement process, such as in a precise measurement or an exact calibration process.
In this paper, we report a device for easy-to-use illumination measurement using a color sensor array. The color sensor is in an integrated circuit (IC) and is equipped with an XYZ tri-stimulus function, based on the CIE 1931 color matching functions [16]. Each sensor has a tolerance of nearly 1% variation of wavelength. The sensor array module with an appropriate control circuit makes it easy to measure and analyze the illumination and color distributions over a twodimensional surface at one time. Each sensor in the array module can measure illuminance and color coordinates, based on three independent CIE 1931 color matching functions: □,
The paper is organized as follows. Section 2 describes the configuration of the developed measurement device, including the component descriptions. Measurement and performance using the device are described in Section 3.Section 4 deals with discussions on future development. The paper is concluded with Section 5.
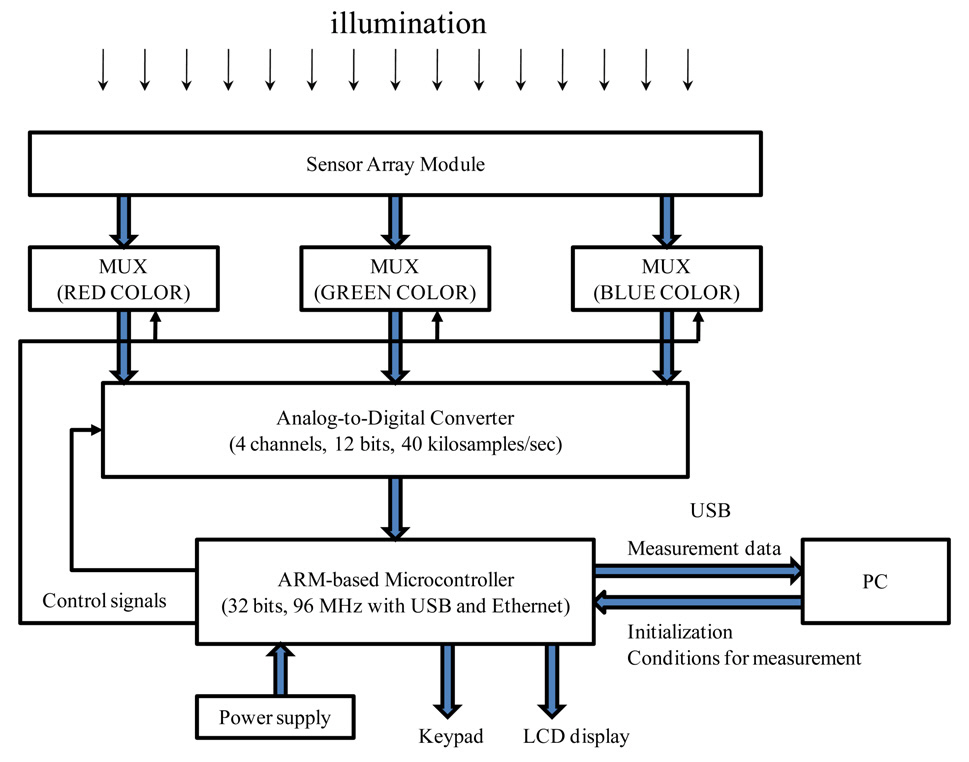
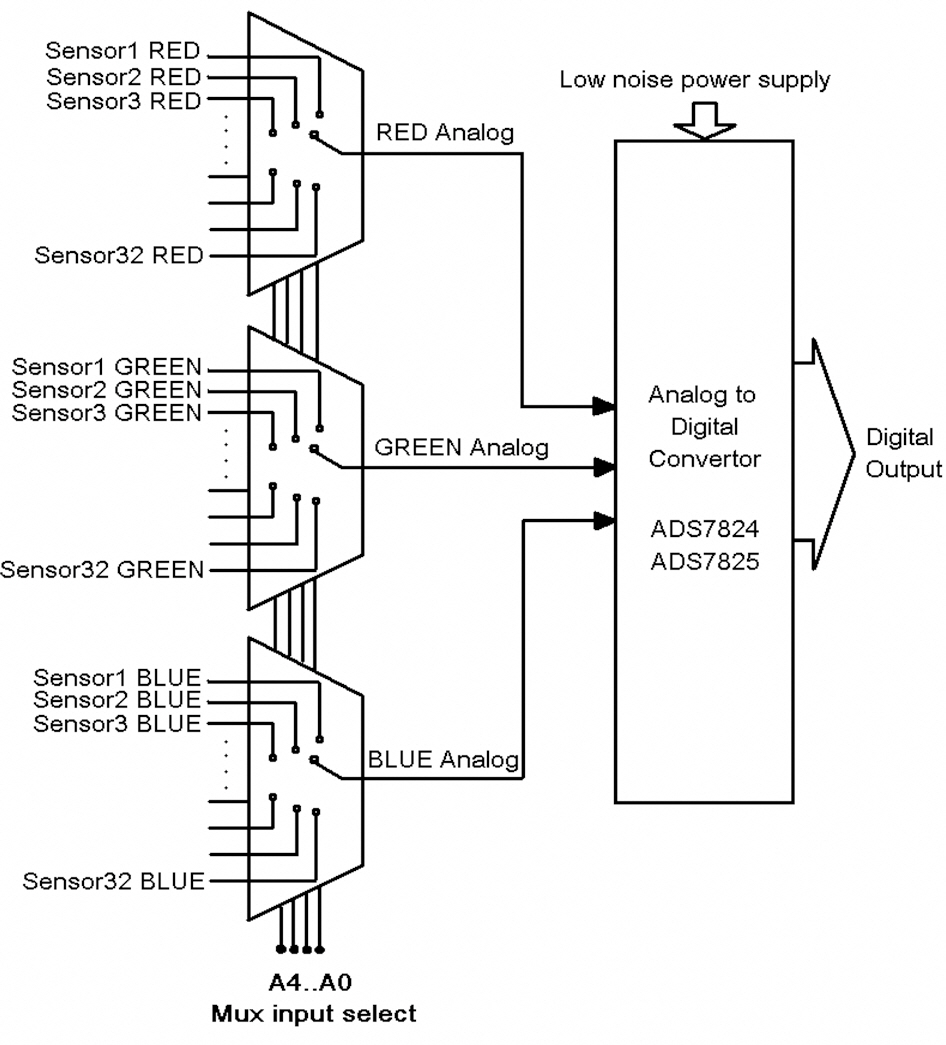
Fig. 1 shows the organization of the measurement device, which consists of three parts. The sensor array module includes a two-dimensional color sensor array, multiplexers, and an analog-to-digital converter (ADC). The control module consists of a microcontroller, a power supply, and various connectors. The other part provides the interface between the control module and the PC. The color sensor array is composed of 64 color sensors in a 16 × 4 array. Each sensor includes the standard XYZ (RGB) filters based on the CIE 1931 color matching functions [17]. The photocurrent from a color sensor is converted into the voltage inside the color sensor IC, which stands for a direct coordinate for the standard 1931 color space. The output voltage signals from the sensor array module are then multiplexed and converted into digital signals. Compact and portable, the sensor array module is suitable for hand-held applications. Using the two dimensional array of color sensors, fast and absolute color measurement over a surface is possible.
The analog signals containing illumination and color information from 64 sensors are collected by multiplexers,and the ARM-based microcontroller in the control module processes digital signals and sends them to the PC through the USB 2.0 interface. The measurement data fed into the PC is processed to draw a two-dimensional figure for illumination and color distribution, which are described in Section 3. The LCD display in the control module shows the status of the measurement device and the basic parameters for measurement are set by using a keypad.
The color sensor (MTCS-TIAM2, MAZeT) is a true color sensor IC (integrated circuit) and is equipped with an integrated transimpedance amplifier in a small plastic package on a PCB-carrier [16]. This color sensor includes the standard XYZ (RGB) filters based on the CIE 1931 color matching functions [17]. The in-depth descriptions on photometry and colorimetry are provided in [18]. After an offsetcorrection and calibration, the output voltages from the sensor become XYZ tristimulus values for the standard CIE 1931 color space [16]. Therefore, we can refer to the true color sensor as a CIE 1931 sensor. Each color sensor consists of 19 × 3 PIN silicon photodiodes with blue-enhancement integrated on a chip package. Since the color sensor can detect signals from a red light to a blue light by Si photodiodes in the array structure, it is simple to design the measurement device with the color sensors without additional optics. Therefore, this developed measurement device is suitable for measuring and analyzing illumination and color distributions for multiple points in a compact package.
2.3. Multiplexer and Analog-to-digital Conversion
A monolithic CMOS dual 16-channel analog multiplexer(ADG726, Analog Devices) switches one of 16 inputs, as determined by the 4-bit binary address lines A0, A1, A2,and A3. With this multiplexing capability, simultaneous measurement from 64 color sensors is possible. The multiplexer works well with a 1.8 V to 5.5 V single supply or a 2.5 V dual supply. It has only 4 Ω resistance and needs only 30 ns for switching. Therefore, it provides the number of address lines and sufficient switching time to ensure accuracy and speed for this development.
The analog-to-digital converter (ADS7824, Burr-Brown Company) is used to convert the analog signal from the sensor array module to a digital signal. The converted digital signal is a 12-bit data stream, which consumes only 50 mW at its maximum. Laser-trimmed scaling resistors provide the standard industrial ±10V input range and the channel-to-channel matching of ±0.1%.
Fig. 2 shows the block diagram for connectivity between the multiplexer and the ADC. The multiplexing of 64 sensors needs 192 color signal lines. However, we use only one ADC with four inputs by using the multiplexers to collect the signals from 64 sensors. The microcontroller controls the multiplexer and chooses which of the signal lines is to be connected to the ADC. The signal conversion processes from multiplexing to ADC are summarized into the following three steps: 1) choose a specific signal line using a 5 bits address, 2) convert the analog signal to a digital signal, and 3) obtain the digital values.
2.4. ARM-based Microcontroller
The microcontroller used for this development is an ARM-based microcontroller (STR912FAW46X6, ST Microelectronics). This microcontroller is a 32-bit ARM (advanced RISC machine) device. The general information on ARM processors can be found in [19]. The microcontroller is a 96 MHz ARM based microcontroller unit (MCU) with an ARM966E-S RISC core. It has Harvard architecture, a 5-stage pipeline, and tightly-coupled memories (SRAM and flash). The microcontroller also has dual burst flash memories, 32-bits wide with a 1 MB main flash memory, and a 128 KB secondary flash memory. Furthermore, it supports 10 communication interfaces, including 10/100 Ethernet MAC with DMA (direct memory access) and MII (medium independent interface) [20], as well as a USB full-speed(12 Mbps) slave device [21]. By using the microcontroller with USB full-speed support, we can ensure the data transmission speed of the measurement device.
2.5. Printed Circuit Boards and Interfaces
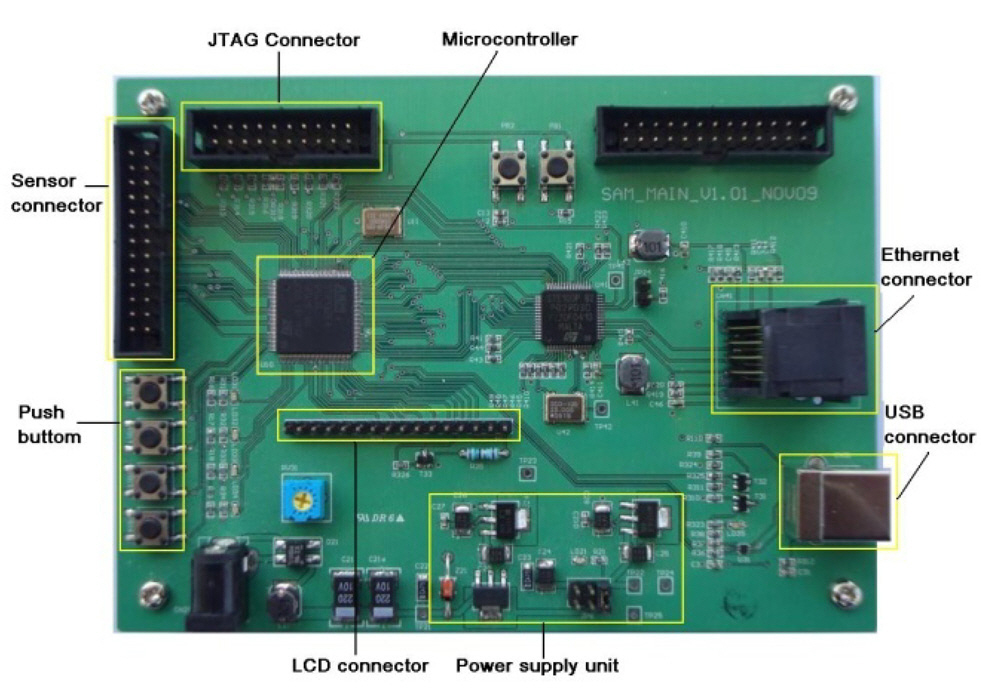
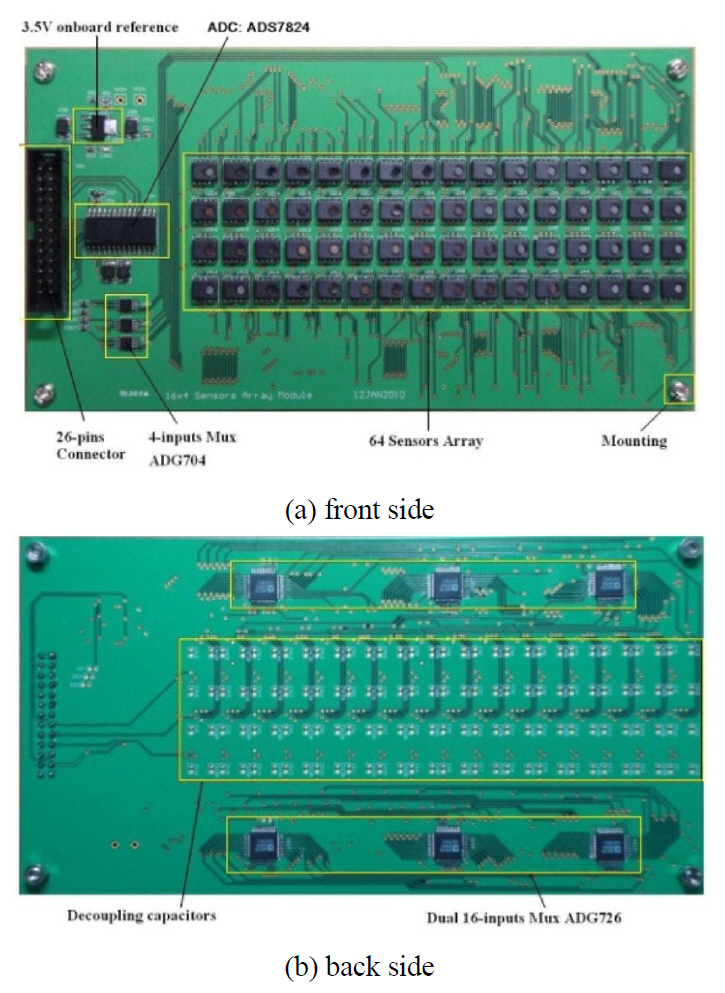
The printed circuit boards (PCBs) are developed in a DXP 2004 Altium environment and are shown in Figs. 3-4. We adopted 4-layer PCBs. Each PCB has a ground layer and its surface layers for wiring are covered with ground areas to reduce the noise from the outside of the PCB.
The device includes two modules: a control module and a sensor array module. Fig. 3 shows the control module with the microcontroller, the Ethernet connector, the USB connector, the power supply unit, the LCD connector, the push button, the sensor connector, and the JTAG connector.
The front side and back side photos of the sensor array module are shown in Fig. 4. This module includes the 16 × 4 sensor array and the ADC (ADS7824), with a 3.5 V onboard reference and the 4-input multiplexers (ADG704) with a 26-pin connector. The back side contains dual 16-input multiplexers (ADG726) and decoupling capacitors.
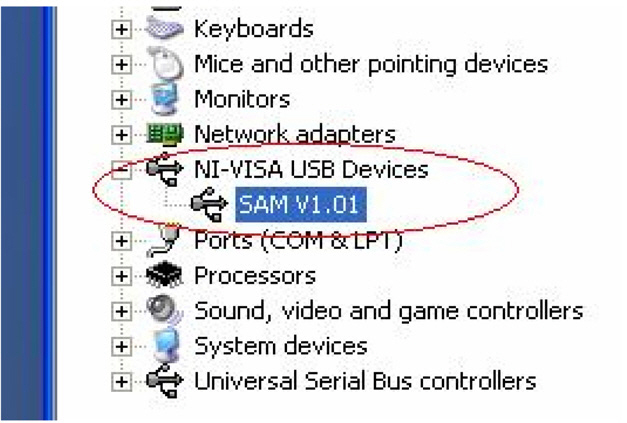
The USB driver was developed based on a virtual instrument standard architecture (VISA) tool in LabVIEW [22]. After setting up the developed driver and connecting the control module to the PC, the module becomes a USB device as shown in Fig. 5.
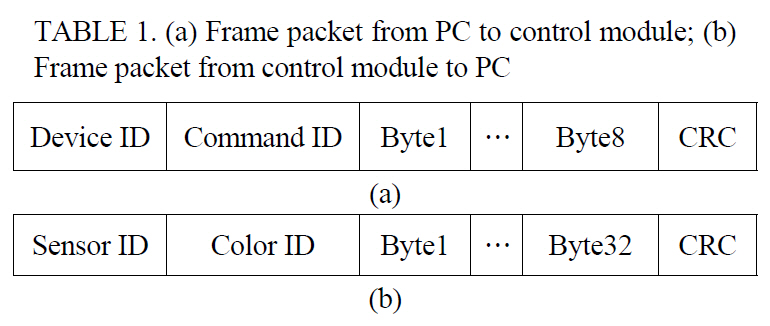
Table 1 shows the frame format for the data packet between the PC and the control module. The frame packet from the PC to the control module begins with a 1 byte Device ID, a 1 byte Command ID, and 8 bytes data, successively, and is finished with a 1 byte checksum cyclic redundancy code (CRC). The frame packet from the control module to the PC begins with a 1 byte Sensor ID, then a 1 byte Color ID, and 32 bytes data, successively, and is finished with a 1 by checksum CRC.
[TABLE 1.] (a) Frame packet from PC to control module; (b)Frame packet from control module to PC

(a) Frame packet from PC to control module; (b)Frame packet from control module to PC
III. MEASUREMENT AND PERFORMANCE
3.1. Illumination Distribution
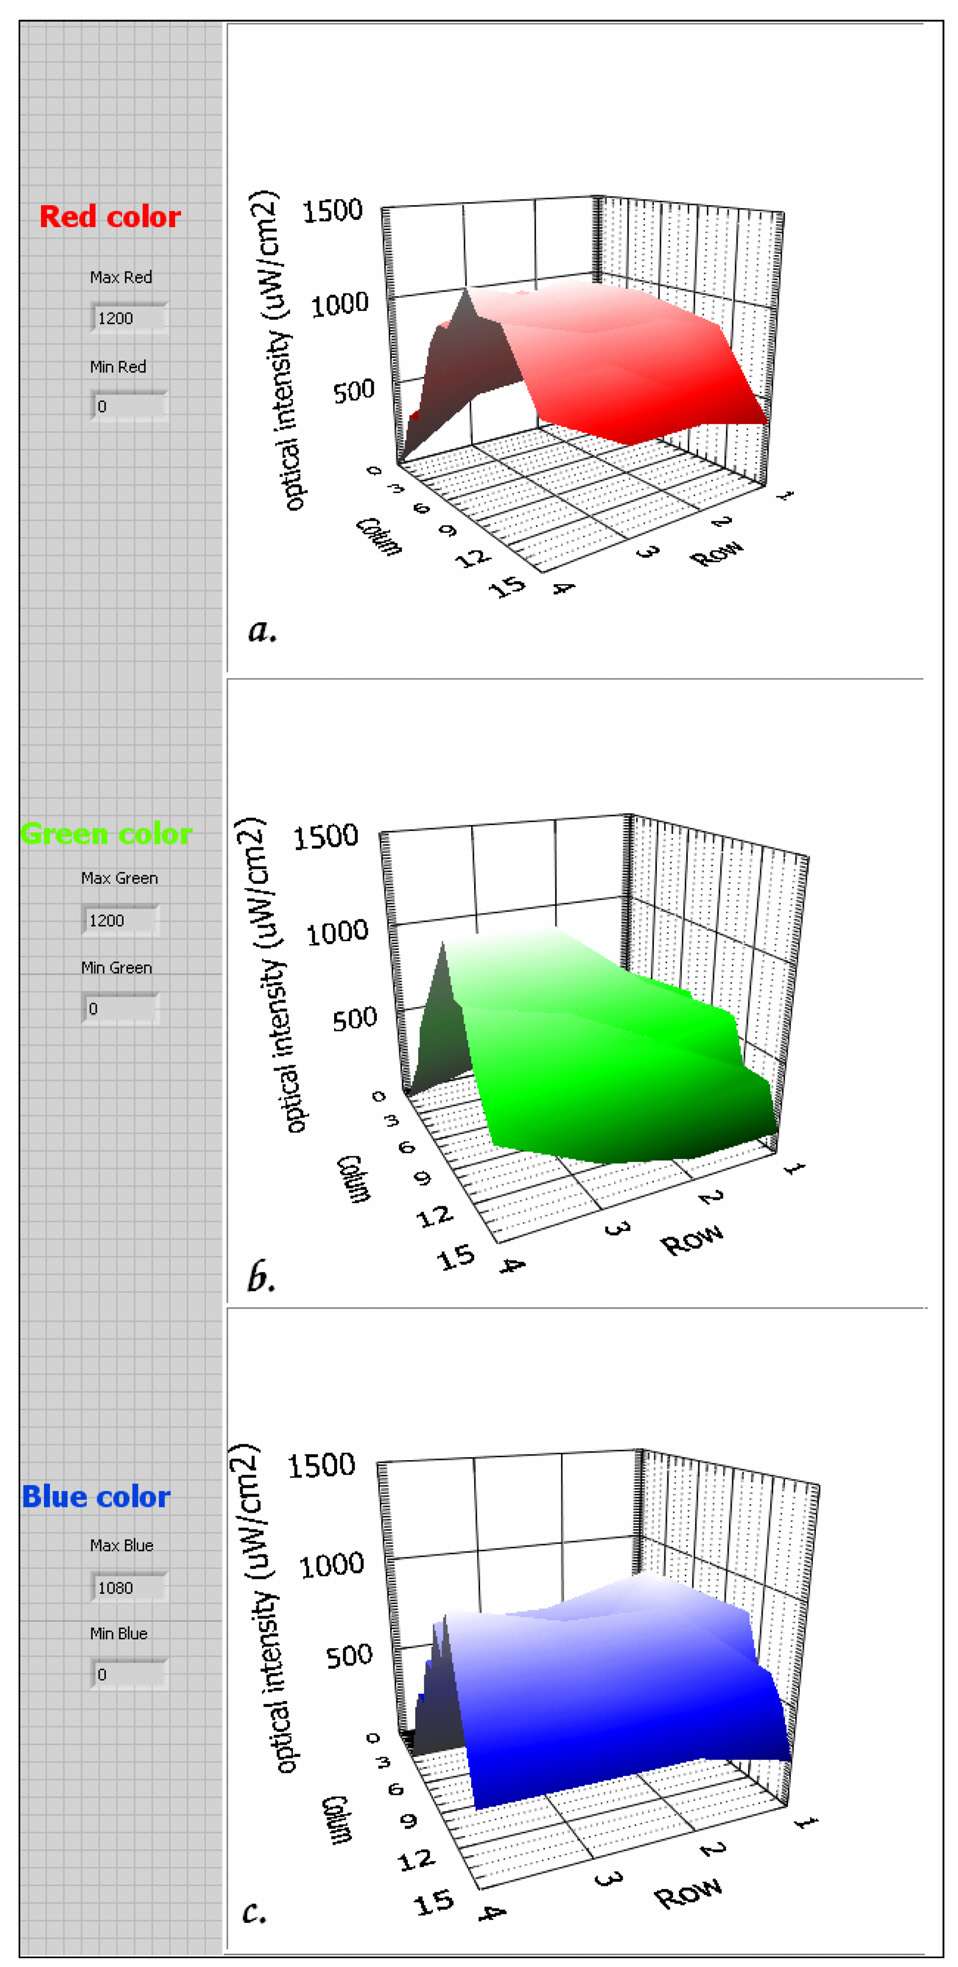
Fig. 6 shows three 3D surface plots that show the measured red (R), green (G), and blue (B) values of the 64 sensors from a single red, green, and blue LED, respectively. An LED is positioned to illuminate the center area of the sensor module. The distance from the LED to the sensor module is 25 cm. The highest optical intensity appears in the center area and the optical intensity decreases in the sensors near the border region. All sensors are set to the sensitivity level of 2. The color sensors convert the optical intensity (R, G, B) to voltage and the minimum measured voltage is 0 V when it is completely dark. The maximum measured voltage is 5 V when the received light is over the maximum received optical intensity. At that point, the 0 V is digitally encoded to 0, and 5 V is encoded to 255. The digital values are scaled from the received optical intensity. For the sensitivity level “zero”, the irradiance responsivities, for the red color at 600 nm, is S0Red =0.067 mV/(μW/cm2), for the green color, at 555 nm, the irradiance responsivities is S0Green = 0.063 mV/(μW/cm2),and for blue color, at 445 nm,, the irradiance responsivities is S0Blue = 0.044 mV/(μW/cm2). From these values, we can estimate the maximum received optical intensity to measure, using TIAM2: S0Red,Max = 5V / S0Red = 5000 /0.067 = 74.62 (mW/cm2) for red, S0Green,Max = 5V / S0Green= 5000 / 0.063 = 79.37 (mW/cm2) for green, and S0Blue,Max= 5V / S0Blue = 5000 / 0.044 = 113.64 (mW/cm2) for blue.These values are shown in Fig. 6. For the sensitivity level “seven”, the same calculation can be applied. The maximum received optical intensities for sensitivity level “seven” are 93.98 (μW/cm2) for red, 99.8 (μW/cm2) for green, and 143.27 (μW/cm2) for blue.
The bottom surface means the geometrical measurement surface and the vertical axis means the scaled voltage, and, therefore, the relative measured intensity of each color can be set to absolute values for measured intensity or illuminance with an exact adjustment process.
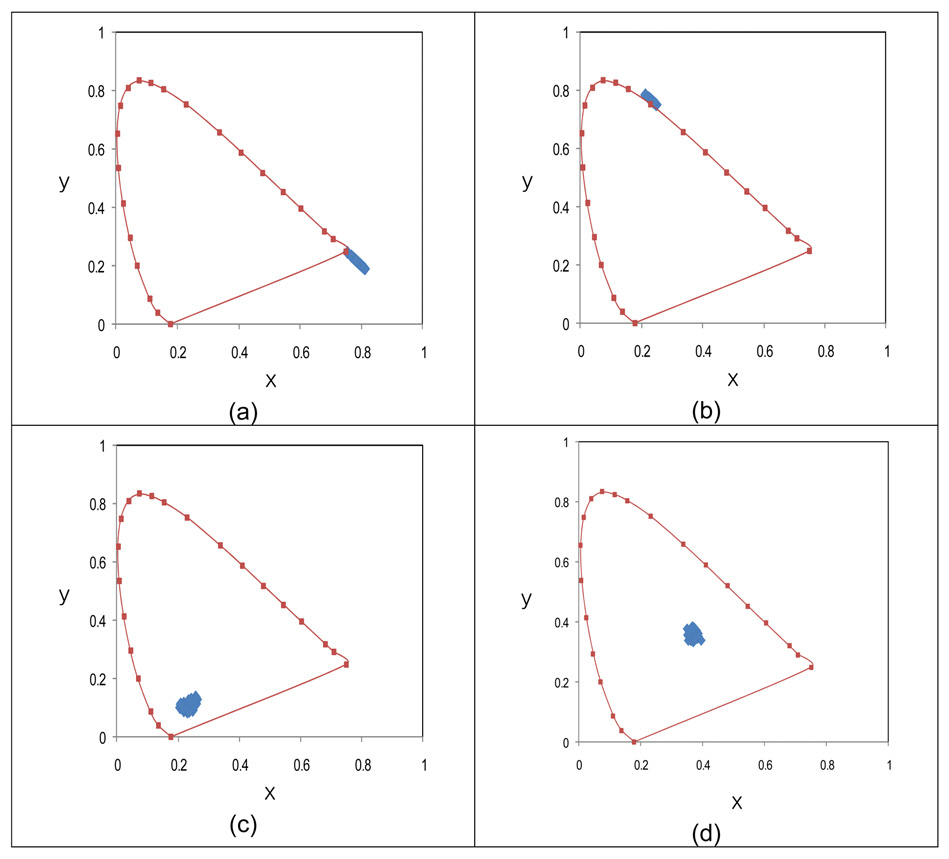
Fig. 7 shows the 1931 CIE chromaticity diagrams with the (
where

The uniformity of y for an incandescent bulb is approximately 8.77% with the distance of 50 cm to the sensor array module. Next, the color coordinates for LEDs of different colors are measured. The color coordinates are evenly distributed for each sensor. The measured color coordinates for a specific LED coincide with the color of the corresponding LED. As an example, the color coordinates for the white LED (Fig. 7(d)) are compared with the datasheet from the manufacturer. The measured
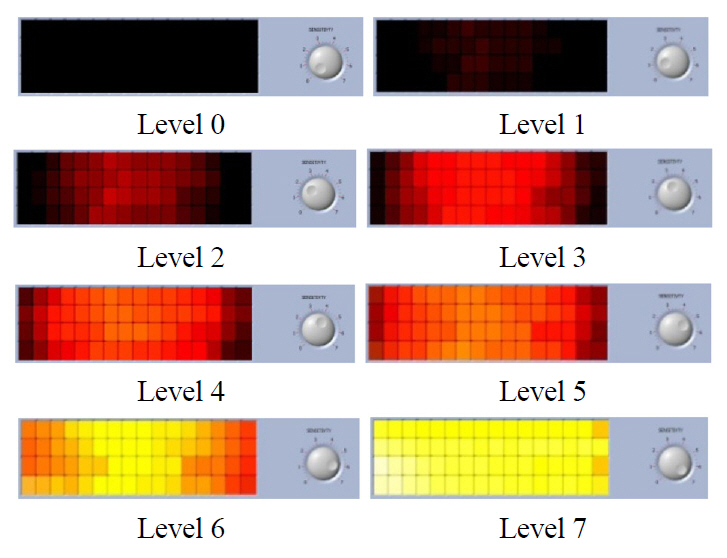
Fig. 8 shows the measured optical intensity for a red LED, with a different level of sensitivity, while maintaining the LED operating condition. It was tested with a single, commercial 1 W red-LED source at a distance of 20 cm. The sensitivity of the sensors is changed from the minimum value (Level 0) to the maximum value (Level 7). With Level 0, the sensor cannot detect the weak light. To detect the weak light, the sensitivity level must be increased. If the sensitivity is too high, the color is expressed as yellow, for sensitivity Level 6 and sensitivity Level 7. The sensitivity level is changed digitally by programmable adjustment of transimpedance of the color sensor IC [16]. For a simple adjustment, with the known source-detector standard, the sensitivity of the sensor module can be adjusted by using the sensitivity knob on the front panel of the graphical user interface (GUI) in the PC.
The color sensor is a good candidate for a color measurement device because it includes the true color filters and an amplifier in a small package. Table 2 shows the electrical and optical characteristics of the color sensor [16]. From Table 2, the appropriate sensitivity level suitable for a specific application can be chosen.
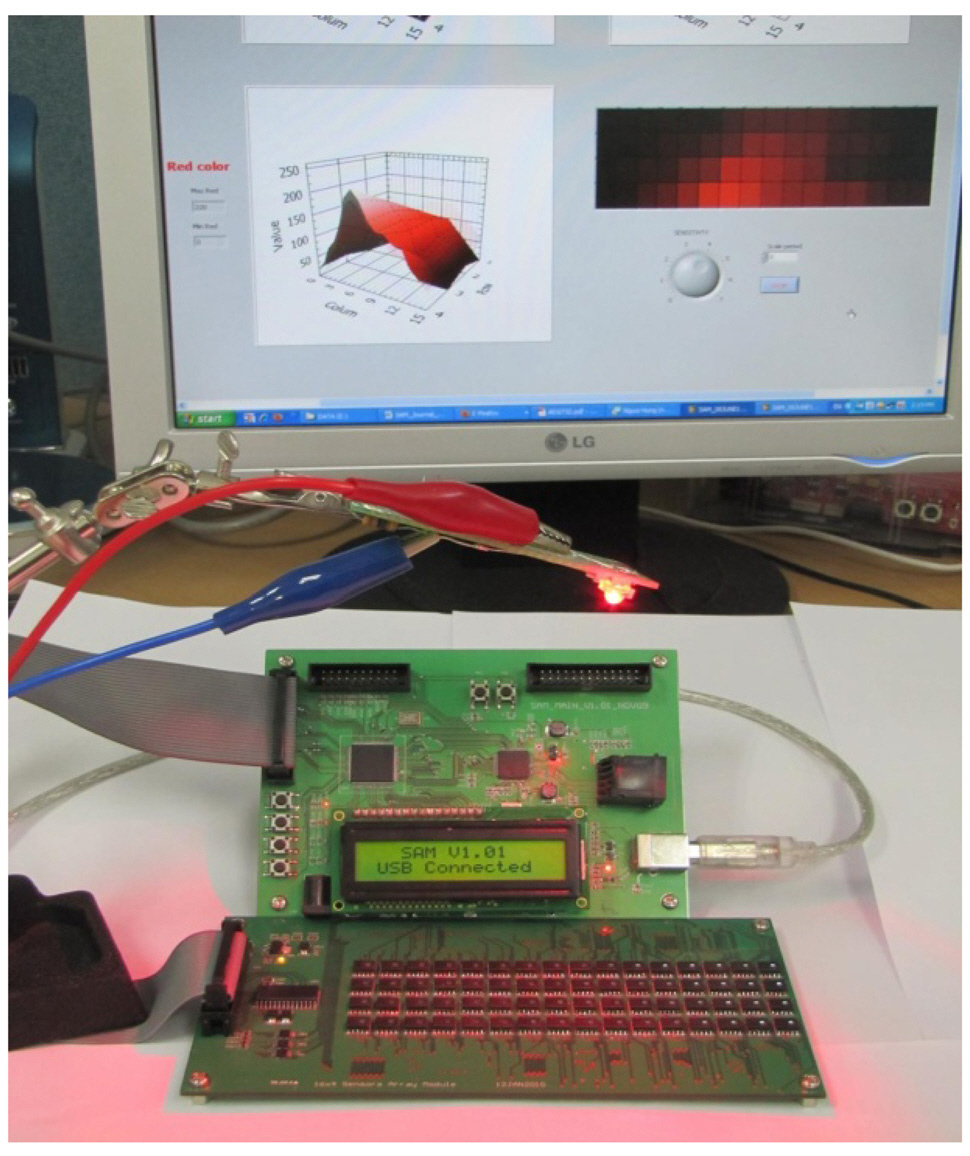
Fig. 9 shows the photograph of the measurement device for a measurement. The control module is connected to the sensor array module using a 26-pin connector and to a PC through a USB connector. The sensor sensitivity is in Level 4. The light source is a 1-W red color LED. A part of optical intensity figures such as Fig. 6 is shown on the PC screen. are shown on the PC screen. The measurement software is developed on the LabVIEW and we can stop the measurement procedure by clicking the stop button.
We use a four channel, 12-bit sampling CMOS analogto-digital converter (ADS 7824). The input range of the ADC is from ?10V to +10V and provides a sufficient voltage range for converting the output of the color sensor. With this 12-bit ADC, the number of levels (NL) for each color is
[TABLE 2.] The PD Sensitivity of the Color Sensorthat wasused [11]
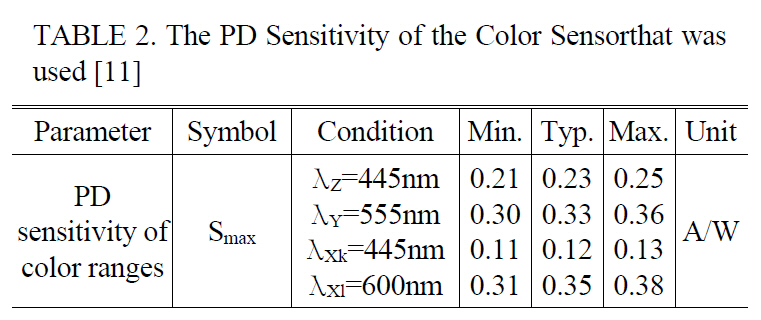
The PD Sensitivity of the Color Sensorthat wasused [11]
By generating the number of levels for three colors, we arrive at the number of color levels (NCL) as follows:

We have 64 sensors with three colors (R, G, and B), and the number of total samples (NS) is

The maximum sampling rate of ADS7824 is 40 kilo samples per second (ksps). Therefore, the minimum time required to convert the analog signal from the sensor module to the digital signal is

The ARM-based microcontroller supports the USB 2.0 full speed interface. Therefore, we can transmit data to the PC at the maximum data rate of 12 Mbps. Since the 12-bit ADC is used, the total number of bits is

Therefore, the minimum time required to transmit data from the control module to the PC is

The minimum time required for conversion and transmission is
The ARM-based microcontroller (STR912FAW46X6), with a clock speed of 96 MHz, has enough processing speed to process and transmit data. In this development, we test the sensor array module, with the total time of TTOTAL = 65 ms. 64 ms is required to convert data from the 64 sensors(1 ms for each sensor), and 1 ms is required for the transmission of data through the USB (~ 2.3 Mbps).
The processing of measurement data is performed using the ARM-based microcontroller. The measurement device can be upgraded by adding more RAM, ROM, and external flash memory to form an embedded illumination measurement device that works without a PC.
The measurement device can be developed as an embedded system with its own data display. The ARM-based microcontroller, running on a tiny OS, can collect, process, transmit,save, and retrieve the measurement data.
The internet-connected remote measurement device can be used to measure the illumination and color distributions in real-time inside or outside a building, for example, on the highway, the subway, etc. Furthermore, the measurement device can communicate with a GPS module to record the measurement data and measurement position during measurement.
Although 12-bit data for each color in this device is in compliance with the 36-bit color standard, only the eight most significant bits (MSBs) are used for each color to follow the 24-bit true color standard, as it is sufficient to display the color data on a PC screen. If the 12-bit ADC is upgraded to a 16-bit ADC, we can have 48-bit color and the device can measure and show 281.5 trillion colors[23].
We can use this device as a measurement device to characterize the indoor environment for developing an LED illumination system or an LED communication system. It will help illumination designers or interior designers to easily design an optimal illumination system by measuring the illumination at various positions.
The sensor that we used is a kind of true color sensor with true color filters. Therefore, it is possible to detect and analyze color contributions with appropriate transformation algorithms from an illumination system. With the independent sensitivity adjustment for each sensor, more precise distribution measurement would be possible.
An easy-to-use, portable measurement device for illumination distribution has been developed. The device was designed with the purpose of providing a measurement tool useful for developing an LED illumination system and measuring indoor illumination. The array of CIE 1931 XYZ sensors detects the illumination distribution and the CIE 1931 color coordinates. The measured data is transmitted to the PC through a USB interface and processed to draw graphs in the GUI.
The measurement of color coordinates from a white LED, using the measurement device, was tested by comparing the measured coordinates with the values in the data sheet from the manufacturer. The result shows a small difference.The development has provided a prototype measurement device for measuring the illumination distribution and the color coordinates.


![The PD Sensitivity of the Color Sensorthat wasused [11]](http://oak.go.kr/repository/journal/10693/E1OSAB_2011_v15n1_44_t002.jpg)