We have developed a simple model of a bright-room contrast ratio (BRCR) measurement system for plasma display panels (PDPs) adopting a contrast enhancement film (CEF) by using an illumination design tool. Only four model parameters were used, namely, total ambient illumination power delivered by fluorescent lamps, a panel scattering rate, illuminance of PDP white patterns, and the absorption coefficient of a color adjusting film. These parameters were determined by simple optical measurements and matching simulations. The proposed model was employed to predict the BRCR values of four different CEF samples,and the simulated ones were found to be in agreement with measured ones within about 10% relative-error.
Among the various flat display devices, plasma panel displays (PDPs) have attracted considerable attention because they are self-emitting devices that exhibit inherently good optical characteristics, including high dark-room contrast, high brightness, and a wide viewing angle [1, 2]. PDPs employ front filters or PDP filters in order to achieve many important optical and other properties, such as shielding unwanted electronic interference, eliminating ultraviolet (UV) radiation, cutting infrared emission, and correcting color[3-5]. Because of the ever-increasing demand for a high bright-room contrast ratio (BRCR), contrast enhancement films (CEFs) are commonly adopted into PDP filters [4-7].
Several studies have been conducted on the modeling and simulation of either the discharge characteristics for PDPs [8-11] or optical characteristics for liquid crystal displays adopting various optical films [12-15]. However, to the best of our knowledge, the modeling and simulation of the optical characteristics of PDPs, including the BRCR performance, has not yet been reported. In this study, we have carried out a simplified modeling of a BRCR measurement system and simulated BRCR values for a PDP module adopting CEF samples by using an illumination design tool. We mention that the model and simulation procedures reported in this paper are not restricted to the design tool.
In the next section, we describe the BRCR measurement system and the model in detail. In Section 3, we present the structural and optical parameters of CEF samples considered in this study and compare the results of a simulation of BRCR values of the samples with those of measurements of these values. Finally, in Section 4, we present the conclusions with a brief summary.
II. MODEL FOR BRCR MEASUREMENT SYSTEM
2.1. BRCR and Its Measurement System
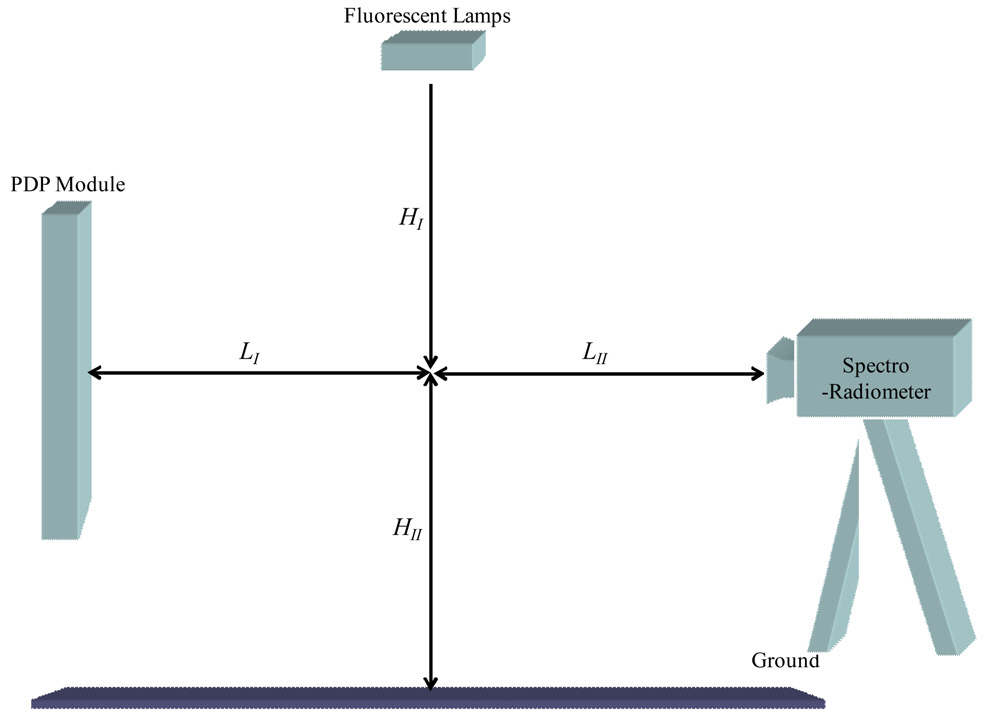
Figure 1 shows a layout of a typical BRCR measurement system that consists of a luminance meter (spectroradiometer), fluorescent lamps (source of ambient light), and a PDP module. The BRCR of a PDP module is defined as the ratio of the luminance of a white pattern to that of a black window under bright-room conditions [16]. In general, the luminance measured for the black window is much smaller than that of the white pattern; therefore, the BRCR highly depends on the luminance of the black window that results from the ambient light.
We used diffuser sheets around the fluorescent lamps to adjust the illuminance by ambient light at the center of the PDP module to 150 lx, which is a typical bright-room constraint in the industry [17]. Once the bright-room condition is set up, the subsequent procedure is to measure the luminance of the PDP module (
For this study, we used a 50-inch PDP module, 3 fluorescent lamps, and a spectroradiometer (CS-2000, Konica Minolta). The BRCR measurement standard requires the measurement distance between the PDP module and the luminance meter to be 1.6
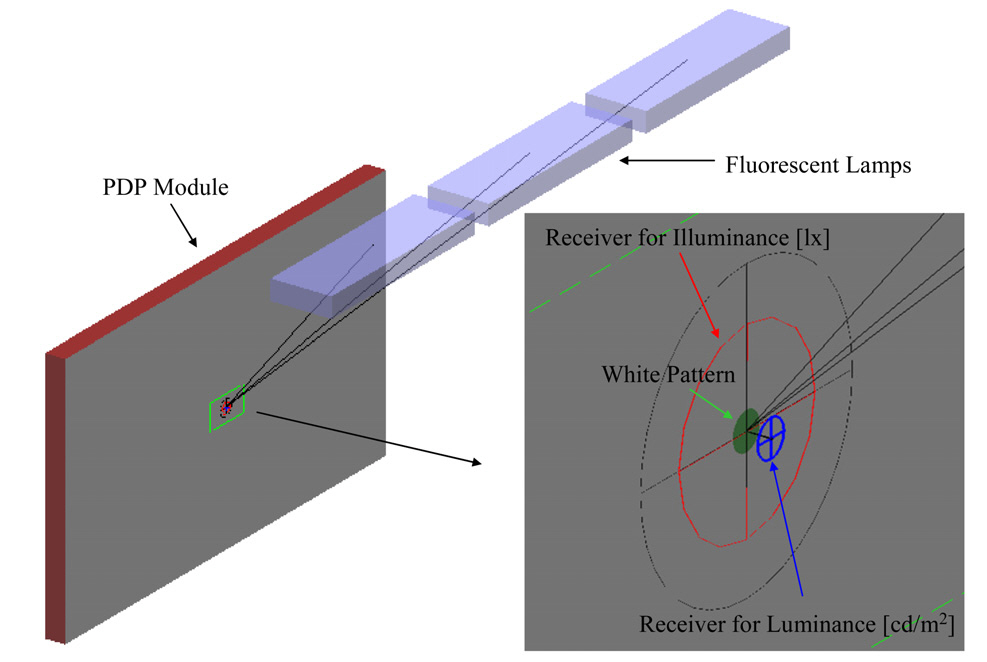
Figure 2 shows a layout of a BRCR measurement system model. A fully-physical model of the measurement system, which takes into account all the details of structural and optical properties of constituent elements of the measurement system, would be desirable. However, the modeling itself and the simulations using the fully-physical model are not practical and almost unfeasible due to the structural and optical complexity of the system. We modeled the BRCR measurement system in as simple a manner as possible as a first step toward a practical model which can be utilized for designing CEFs of high performance.
In our model, developed and simulated by using an illumination design tool
In the model, we employ the real size of the PDP module(50 inch, 1120 mm × 630 mm) and the fluorescent lamps are modeled as three cube sources, each of which has dimensions of 500 mm × 150 mm × 50 mm. The model contains an illuminance receiver and a luminance receiver. The illuminance receiver has a radius of 12.85 mm, which reflects the real size of its experimental counterpart (T-10,Konica Minolta), and the luminance receiver has a diameter of 5 mm and a measuring angle of 1º, which also reflects the major specifications of the spectroradiometer (CS-2000,Konica Minolta) used in the experiments.
2.3. Determination of Model Parameters
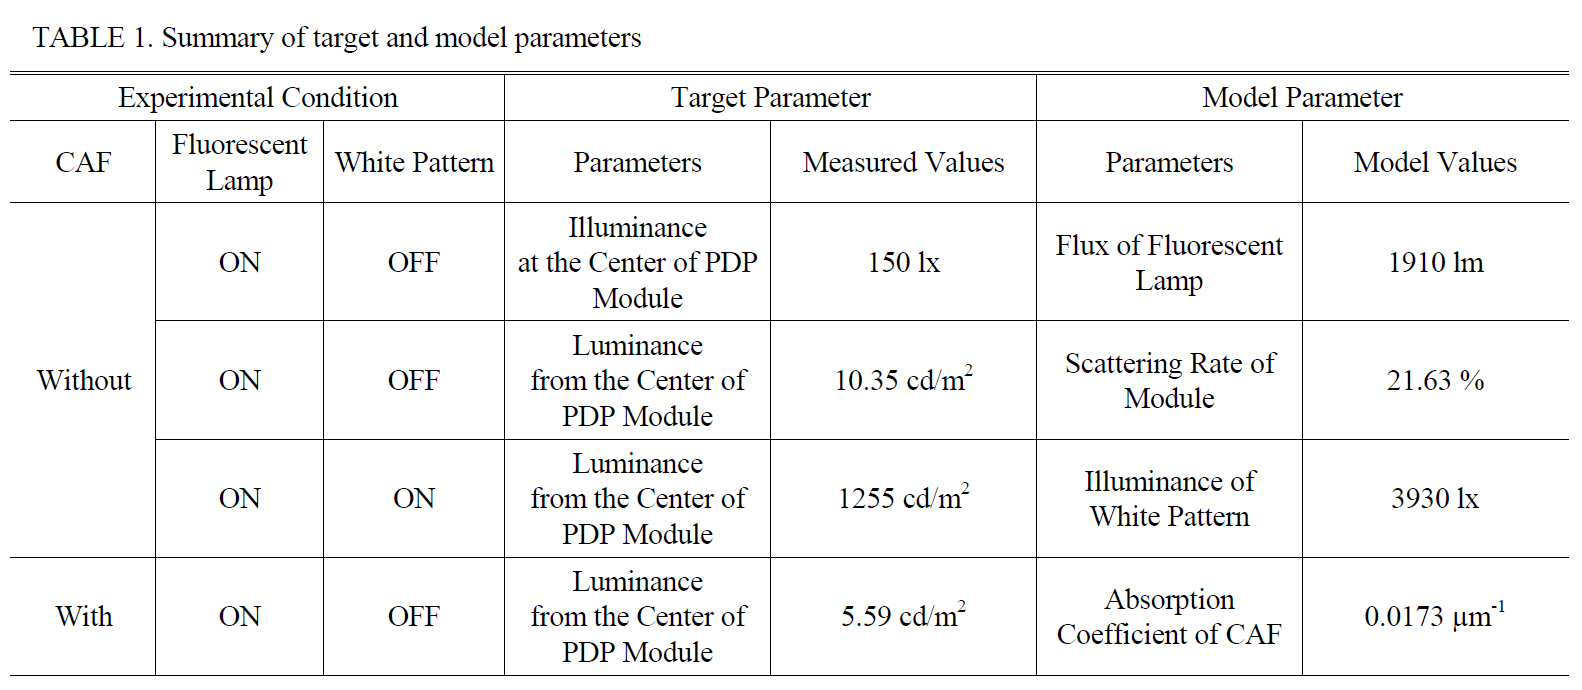
In this section, we describe the procedure used to determine the values of the four modeling parameters introduced just above. First, we selected four measurable parameters (target parameters) that would be significantly affected by the model parameters: illuminance at the center of the PDP module by the ambient light only, luminance from the center of the bare PDP module (without a CAF) due to illuminance by the ambient light only, luminance from the center of the bare PDP module due to illuminance by both the white pattern and the ambient light, and luminance from the center of the PDP module equipped with a CAF due to illuminance by the ambient light only. The four selected target parameters and the experimental conditions under which they were measured are summarized in Table 1, with the experimentally determined values of the target parameters being listed in the fifth column of Table 1.
[TABLE 1.] Summary of target and model parameters
Summary of target and model parameters
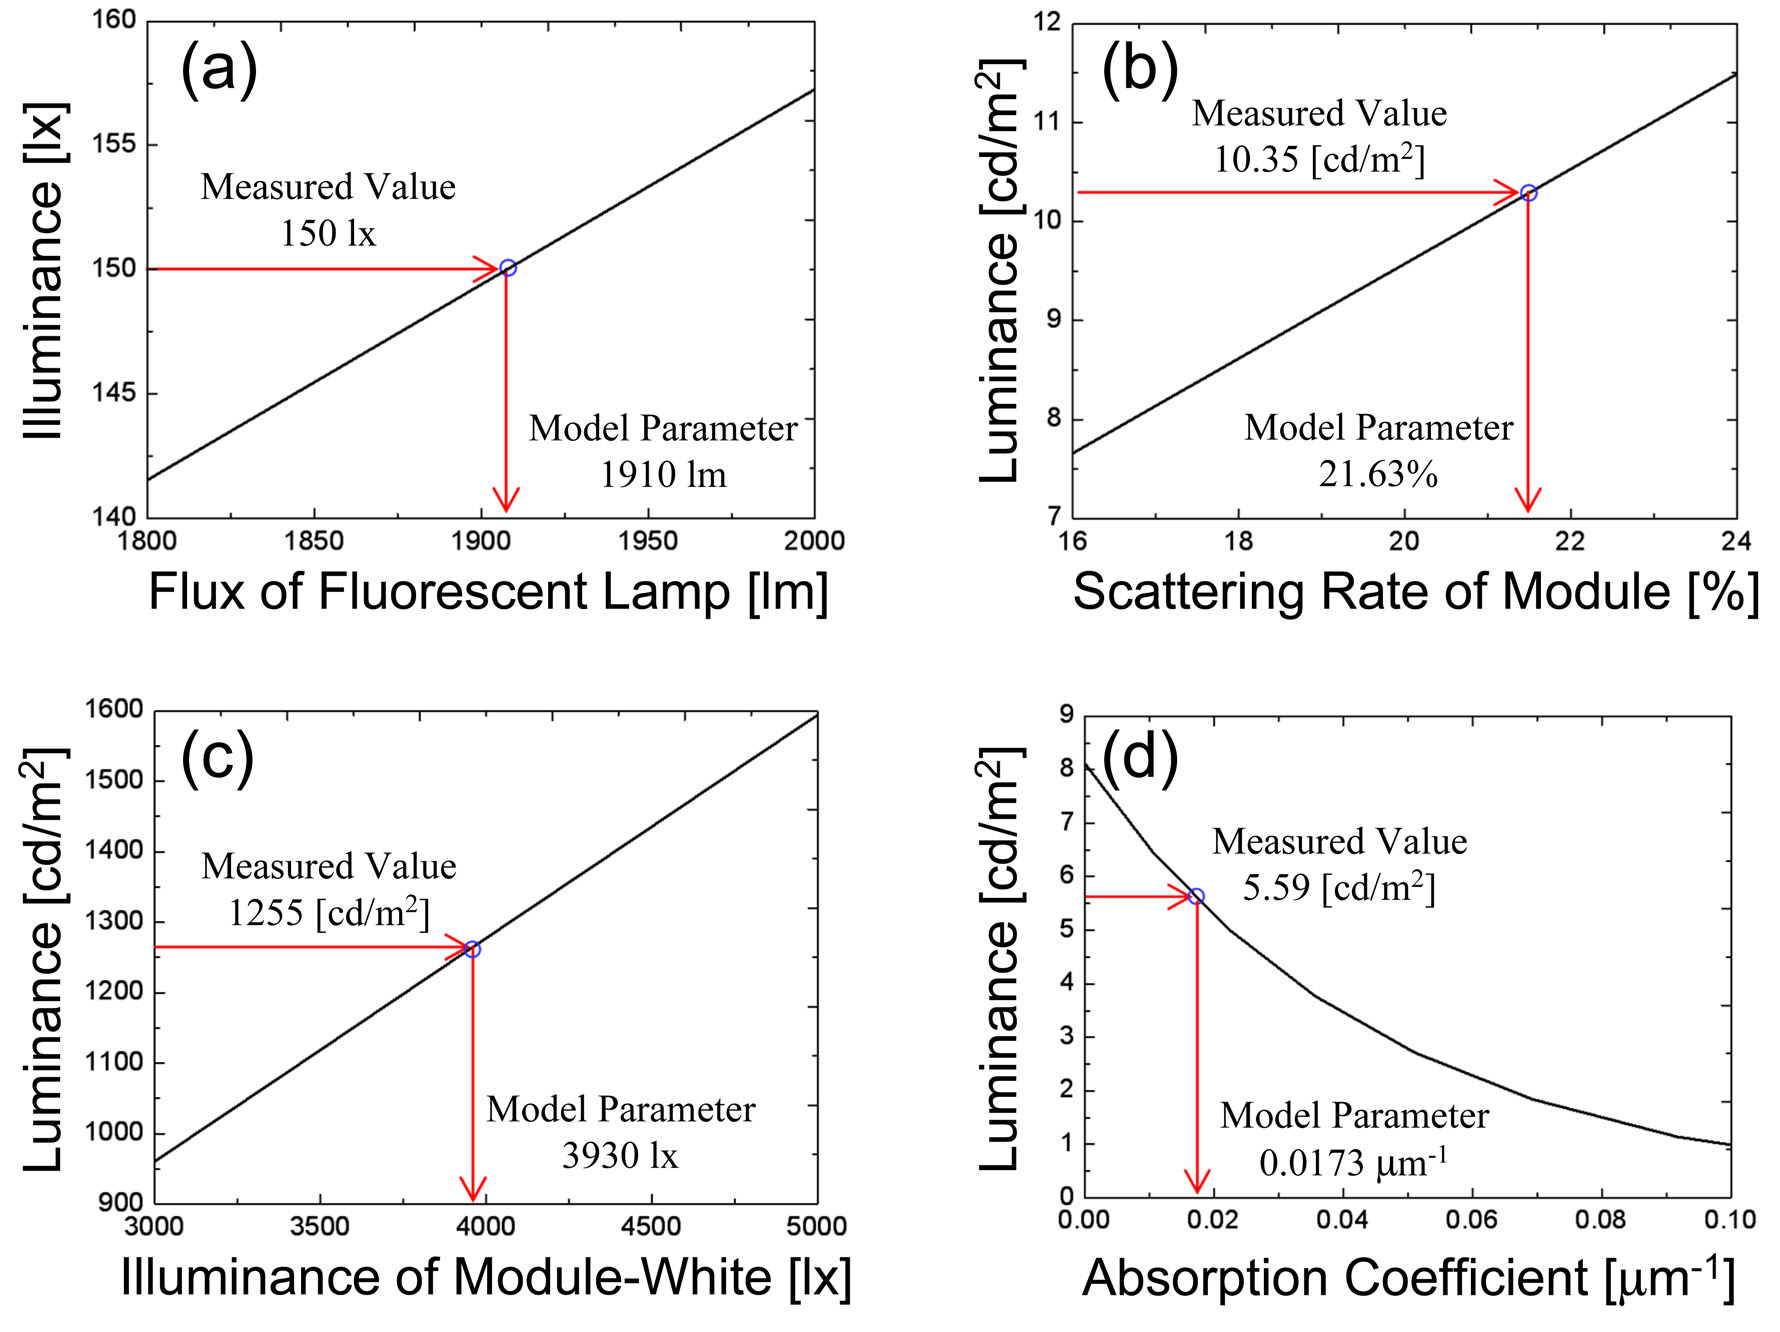
The values of the four model parameters were determined by matching simulations, the results of which are shown in Fig. 3. First, we simulated the illuminance at the center of the PDP module (the first target parameter) as a function of the total flux of the fluorescent lamps [the first model parameter, see Fig. 3(a)]. We find that the result of the simulation matches the experimental result for the illuminance at the center of the PDP module (i.e., 150 lx) when the total flux of the fluorescent lamps is 1910 lm, which is the value of the first model parameter as determined by the matching simulations. Next, we fixed the first model parameter to be 1910 lm and simulated the luminance from the center of the PDP module (second target parameter) as a function of the scattering rate of the PDP module [second model parameter, see Fig. 3(b)]. From the simulation results, the value of the second model parameter was determined to be 21.63%. In the same manner, the third (illuminance of the white pattern) and the fourth (absorption coefficient of the CAF) model parameters were determined to be 3930 lx and 0.0173 ㎛-1, respectively [see Figs. 3(c) and (d)]. In the model, the CAF thickness was 10 ㎛, which was a typical value for the CAF used for the experiment.
3.1. Preparation of Contrast Enhancement Film Samples
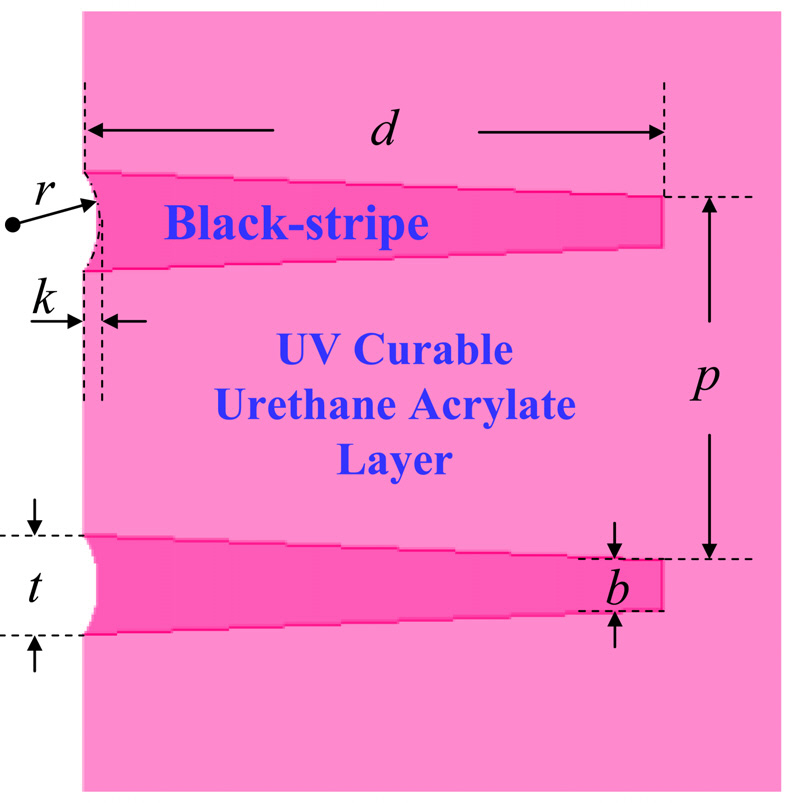
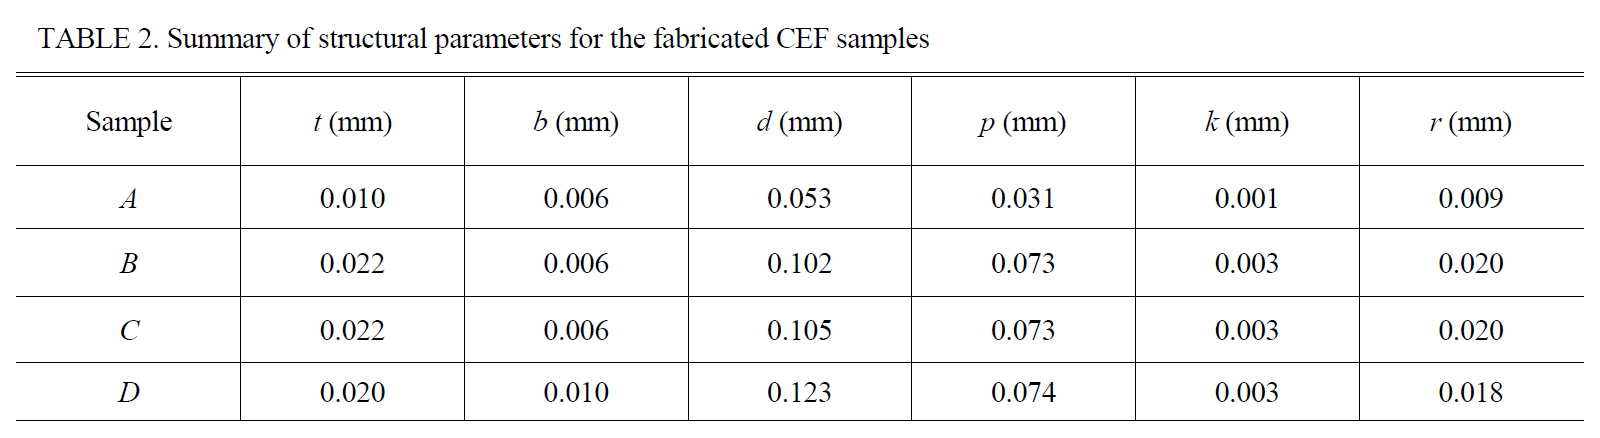
In this section, we describe the CEF samples used for BRCR measurements. The CEF samples were composed of a substrate film (polyethylene terephthalate film) and an ultraviolet-curable (UV-curable) urethane acrylate layer that enclosed black stripes (BSs). The BSs, which are a group of trapezoidal structures made of a mixture of UV-curable urethane acrylate and carbon black (1.5 wt%), play a major role in CEFs by absorbing ambient light.
The samples were fabricated through a patterning process, a wiping process, and a curing process. In the patterning process, trapezoidal patterns were formed in the UV-curable urethane acrylate layer by using a metal mold with the desired microstructure patterns. In the wiping process, the trapezoidal grooves were filled with the BS solution (a mixture of UV-curable urethane acrylate and carbon black), and the surplus solution was wiped off with a blade. Finally, in the curing process, the prepared CEF samples were hardened by exposure to UV.
Figure 4 shows a cross-sectional schematic of the CEF samples, where
[TABLE 2.] Summary of structural parameters for the fabricated CEF samples
Summary of structural parameters for the fabricated CEF samples
[TABLE 3.] Simulation and experimental results for BRCR values for CEF samples
Simulation and experimental results for BRCR values for CEF samples
3.2. Comparison of Simulation and Experimental Results
In this section, we present experimental and simulation results for the BRCR. We used the four types of CEF samples described in the preceding section to measure the BRCR values for the PDP module. Each CEF sample was attached to a CAF and placed in front of the PDP module. The gap between the PDP module and the CEF sample was 3 mm, and the wider side of the trapezoidal BS faced the PDP module.
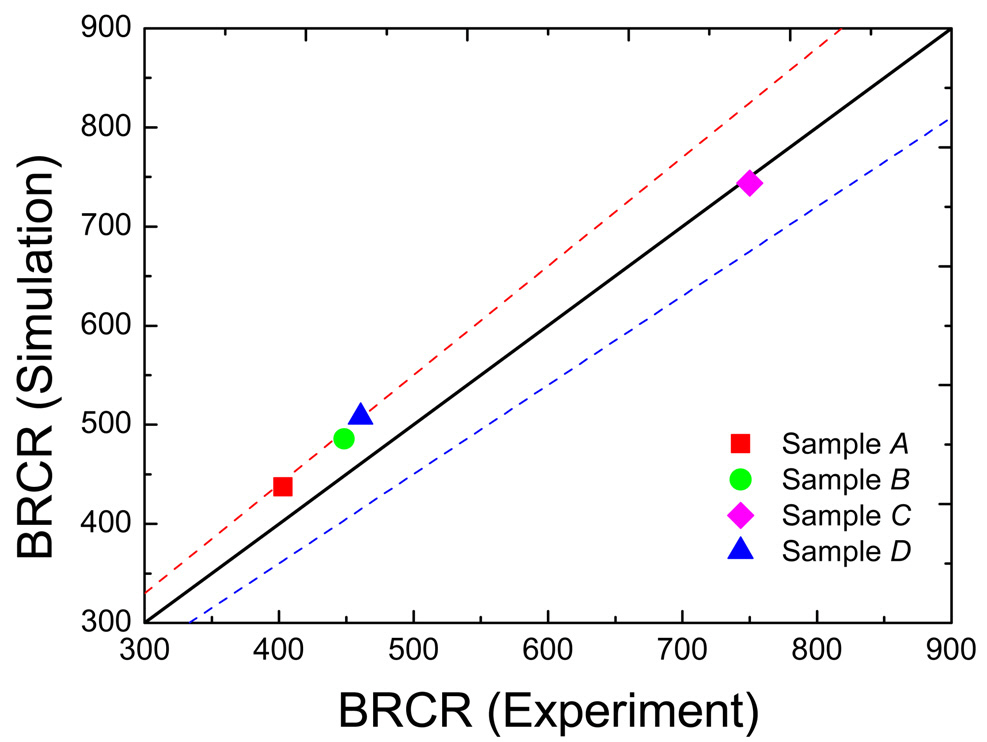
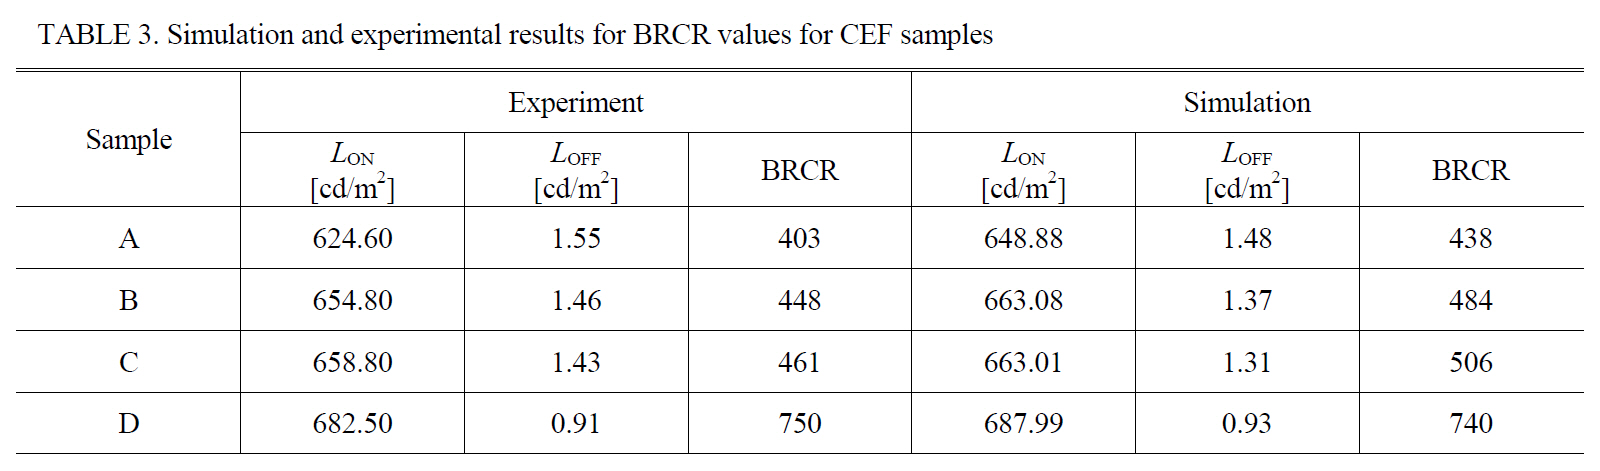
The results of the measurements are listed in Table 3 along with results from the simulations, which were performed with the model described in Section 2 and which took into consideration the structural and optical parameters of each CEF sample. For the four CEF samples, the experimental results are within 10% of the simulation results for the BRCR values. Figure 5 shows these results in a graphical format, where the dotted lines represent the ±10% relativeerror limit.
The luminance of the PDP module with the white pattern turned on (
In view of the experimental and simulation results, the determination of
In this study, we have developed a simplified model of a BRCR measurement system for PDPs. This model uses only the following four parameters to design the BRCR measurement system: flux of ambient light sources, scattering rate of the PDP module, illuminance of the white pattern of the PDP module, and the absorption coefficient of the CAF. These parameters are uniquely determined by simple experiments and matching simulations.
We have fabricated four types of CEF samples and measured BRCR values of the PDP module adopting the CEF samples. The measured results were compared with the simulated results obtained by using the model. Although the model considered the spectral characteristics and the angular properties of the constituent parts of the BRCR measurement system in very simple ways, i.e., lumped at one wavelength and Lambertian, respectively, we found that these results were in good agreement for the four CEF samples considered in this study. The model will be used for the development of high-performance CEFs by optimizing its structural and optical parameters.