Environmental conditions can influence the morphology of local biota through phenotypic plasticity or local adaptation.Macroalgal morphologies are often associated with wave-exposure conditions. We investigated the relationship between morphology and wave exposure in two common endemic subtidal macroalgae, Carpophyllum angustifolium and C. maschalocarpum, from the East Cape of New Zealand. Morphological comparisons were made between individuals from two sites and four different wave-exposure zones, as defined by fetch and barnacle composition. Of the seven morphological traits measured in C. angustifolium, only total length varied, and individuals were longer in more wave-exposed environments between the two exposure zones where the species were found. In contrast, total length,stipe thickness and vesicle presence all varied significantly between exposure zones in C. maschalocarpum. C. maschalocarpum specimens were shorter with thinner stipes, and fewer individuals had vesicles in the more wave-exposed zones. Morphological traits of both species also varied between sites, suggesting that other influences are important for determining species morphology. Further study is needed to investigate the role of phenotypic plasticity and genetic variability for driving morphological variation in C. angustifolium and C. maschalocarpum.
Local environmental conditions can influence the morphology of organisms as a result of selection or phenotypic plasticity, which has been shown in a range of taxa and environments (Trussell 2000, Hochkirch et al.2008, Mboumba and Ward 2008). In coastal environments,the morphology of local biota is significantly affected by wave exposure (Denny 2006, Stewart 2006). For example, Arsenault et al. (2001) found that leg length of the barnacle
In Phaeophyceae, brown macroalgae are significantly affected by wave exposure (Engelen et al. 2005, Wernberg and Thomsen 2005, Fowler-Walker et al. 2006, Tuya and Haroun 2006). Water motion around macroalgae affects their nutrient acquisition, creates mechanical fatigue,and can result in the loss of biomass or dislodgement of entire individuals (Hurd 2000, Kawamata 2001). Phaeophyceae are highly plastic organisms, with numerous examples of environmentally induced forms (Mathieson et al. 1981, 2006). Optimal morphologies exist for Phaeophyceae in different wave-exposure regimes. Traits that reduce drag (i.e., small size, streamlined shape, and flex-ibility) and increase strength (i.e., thickness and aggregation) are favoured in high wave-exposed areas (Stewart and Carpenter 2003, Puijalon and Bornette 2004, Thomsen et al. 2004, Ruuskanen and Nappu 2005, Wernberg 2005, Stewart 2006). Johnson and Koehl (1994) found that the blade morphology of the kelp
One of the major barriers when studying the relationship between morphology and wave exposure is measuring the wave exposure component. Measuring wave exposure on rocky shores is difficult due to spatial and temporal variability (Denny 1988, Eckman et al. 2003). Water motion can be directly measured using a range of equipment including dynamometers and plaster of Paris clod cards (Carrington Bell and Denny 1994, Thompson and Glenn 1994). But, these methods have limitations (Porter et al. 2000, Lindegarth and Gamfeldt 2005). One serious obstacle when deploying sensitive and expensive equipment is its attachment and survival in high wave-exposed environments. Consequently, direct measurements often rely on short-term data collected in calm water (Arsenault et al. 2001, Stewart and Carpenter 2003). For example, Coleman and Muhlin (2008) only measured water motion on days of ‘low to moderate water motion.’ However, short-term measurements can be misleading if extrapolated over long periods with varying environmental conditions (Gaylord 1999).
The difficulties associated with direct measurements have led many researchers to infer water motion from fetch or biological information (Ballantine 1961, McQuaid et al. 2000, Engelen et al. 2005). In two major 244journals, approximately half of the wave-exposure studies over a recent 10 year period developed categorical definitions of exposure using fetch or local biota (Lindegarth and Gamfeldt 2005). Fetch and local biota provide information about wave exposure over a relatively long time frame; however, both have their limitations. Fetch data have low spatial resolution, whereas geographically specific information on the distribution or morphology of local biota may not be available (Gaylord 1999, Arsenault et al. 2001, Lindegarth and Gamfeldt 2005). Barnacle distribution and its relationship to wave exposure in New Zealand have been well described (Foster 1967, 1978). Barnacles are one of the first taxa to be considered when defining wave exposure and are a useful guide due to their immobility and dominance on rocky shores (Ballantine 1961, Heaven and Scrosati 2008).
In this study, we compared the morphology of
Samples were collected from two sites on the East Cape of the North Island, New Zealand. The two sites were both within greater Whanarua Bay, which faces northwest and contains a number of smaller sandy bays divided by large rocky islands or outcrops. The first site was located at the southeastern end of Maraehako Bay (37°40.4´ S, 177°47.8´ E), and the second site was on the rock walls located at Uncles Bay (37°40.0´ S, 177°48.0´ E), which is the adjacent bay to the northeast. The two sites are approximately 500 m apart and are separated by Motu Kaimeanui Island and two deep inlets. Sampling was conducted during the 2007-2008 austral summer.
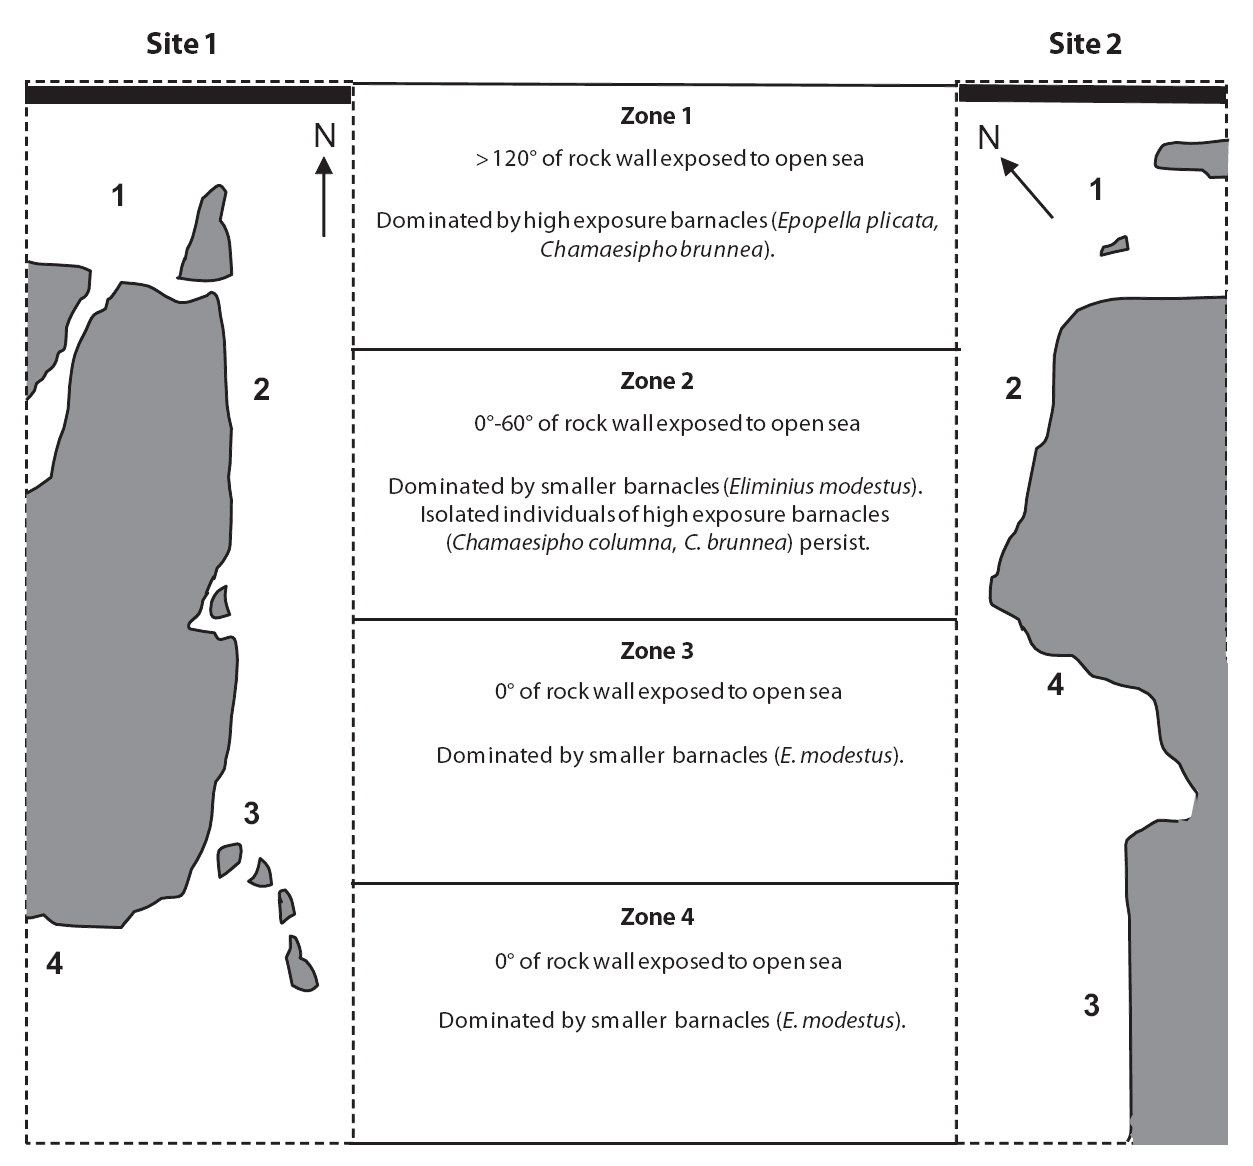
Four wave-exposure zones were selected from each of the two sites. These zones were determined based on fetch and barnacle distribution. The first sites were divided using an estimate of fetch based on the modified
Baardseth index. The Baardseth index is calculated by placing a transparent circular disc with a radius of 7.5 km on a map point and determining the number of 9° segments containing no land or islands (Baardseth 1970). In this study, the angle of open segments was summed
A single transect line was laid in each exposure zone at each site, and quadrat locations were selected randomly from the top 0.5 m of the
Adults were morphologically identified and cleared of any epiphytes. Individuals longer than 20 cm were considered adults. Only those individuals with complete haptera were used in the morphometric analysis to avoid pseudo-replication (i.e., the doubling up of measurements from the same individual). Individuals were measured using digital callipers and a metre rule.
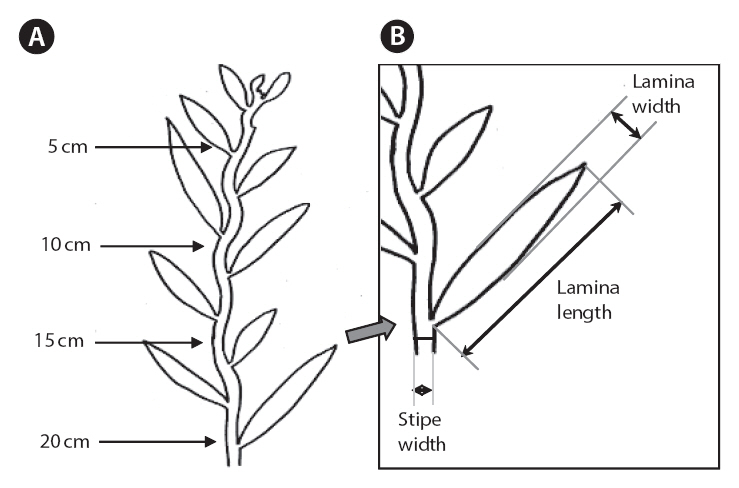
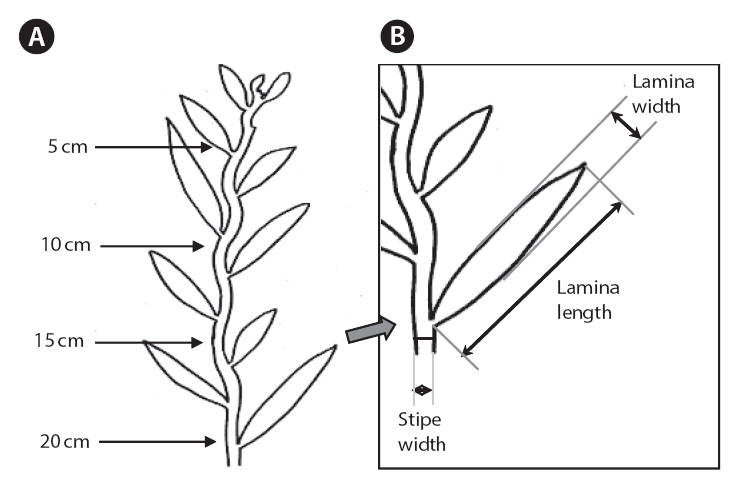
The morphometric characteristics selected for measurement were stipe width and thickness; as well as lamina length, width and thickness (Fig. 2). We focused on the stipe and lamina characteristics of the primary axes (defined as the dominant axis that arises directly from the holdfast). The stipe and lamina measurements were taken approximately 5, 10, 15, and 20 cm from the apex of the primary axis. Lamina length was measured from the edge of the stipe where the lamina forms a tip. Lamina and stipe width were measured at the widest point, perpendicular to an imagined mid-line. Thicknesses were measured at the thickest point. In some places, herbivory had altered morphology of the stipe and lamina; these could be detected by sudden and distinct changes in the lamina or stipe outline. Stipe and lamina measurements that were affected by herbivory were excluded and replaced by measurements of the nearest intact equivalent within 3 cm, if possible. The total length of the individual, presence of vesicles longer than 8 mm and presence of secondary branches longer than 20 cm, were also recorded.
The morphometric data contained missing values due to herbivory and wave exposure damage on parts of some individuals. No observable difference was found between the measurements taken at the different locations down the apex of individuals, when these values were graphed on a scatter plot. Consequently, these measurements were averaged for each individual. This resolved the missing values problem, as most individuals had at least one measurement for each morphological trait. For example, stipe width of an individual was an average from measurements at 5, 10, 15, and 20 cm from the apex.
Morphological characters from individuals in different wave-exposure zones were compared for each species. Data from the two sites were combined. An analysis of variance (ANOVA) and Tukey’s post-hoc comparisons were conducted when data were normally distributed and the variances were equal. Data were log transformed when the ANOVA assumptions were not met. Log transformed data that still did not meet the assumptions of normality was analysed non-parametrically with the Kruskal-Wallis test. The chi-square test was used to investigate the presence data on vesicles and branching. The level of significance for all statistical tests was α = 0.05.
>
Wave exposure and morphology
None of the other morphological traits varied significantly. Some non-significant trends were identified in
The average
A non-significant trend in lamina thickness of
Some morphological traits differed between exposure zones, suggesting that
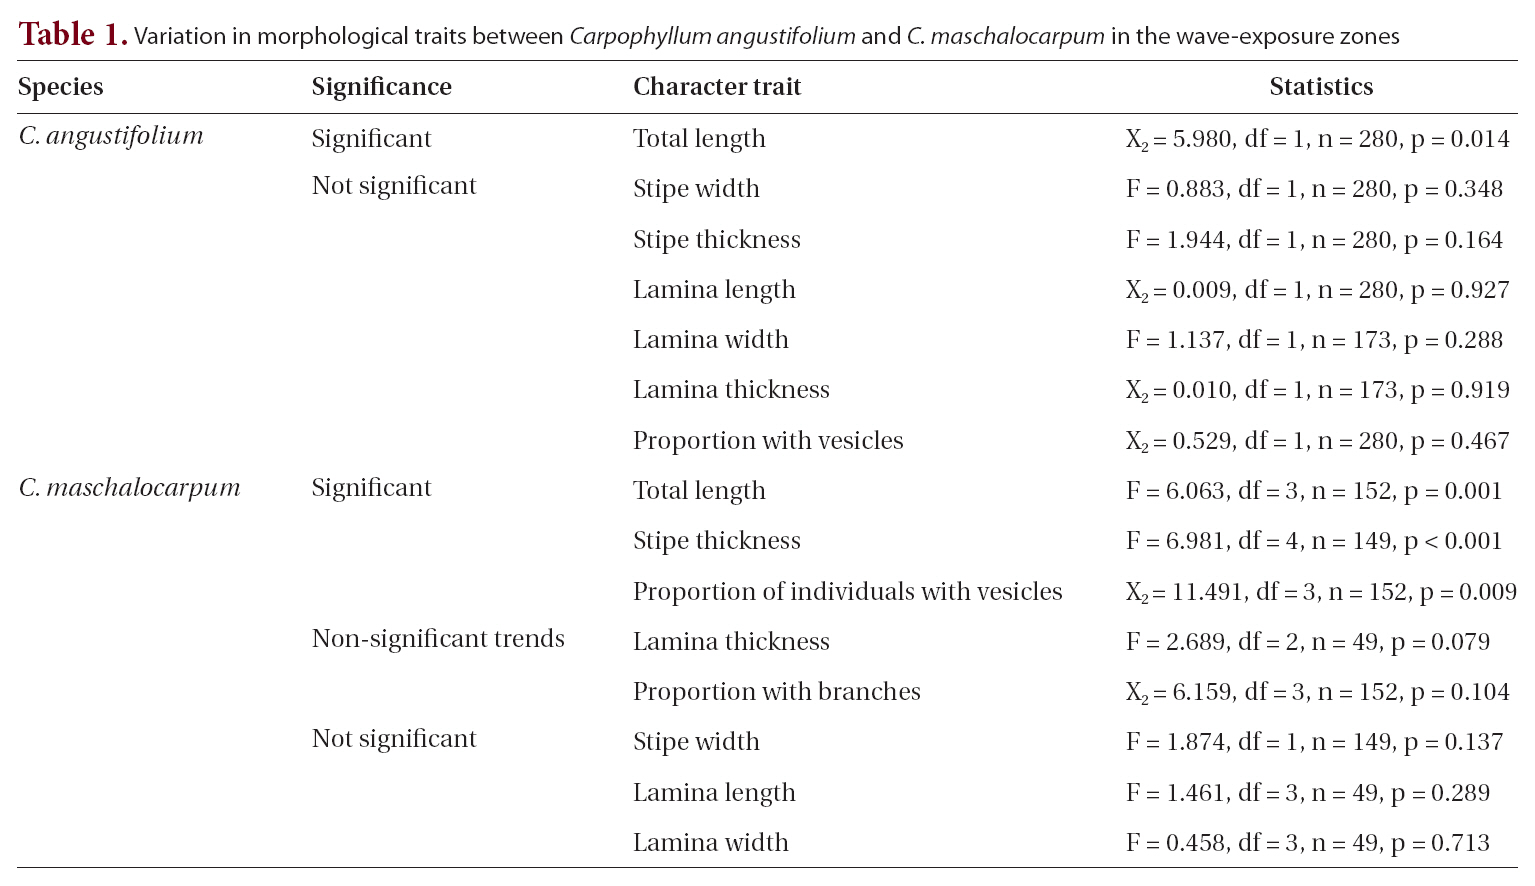
Variation in morphological traits between Carpophyllum angustifolium and C. maschalocarpum in the wave-exposure zones
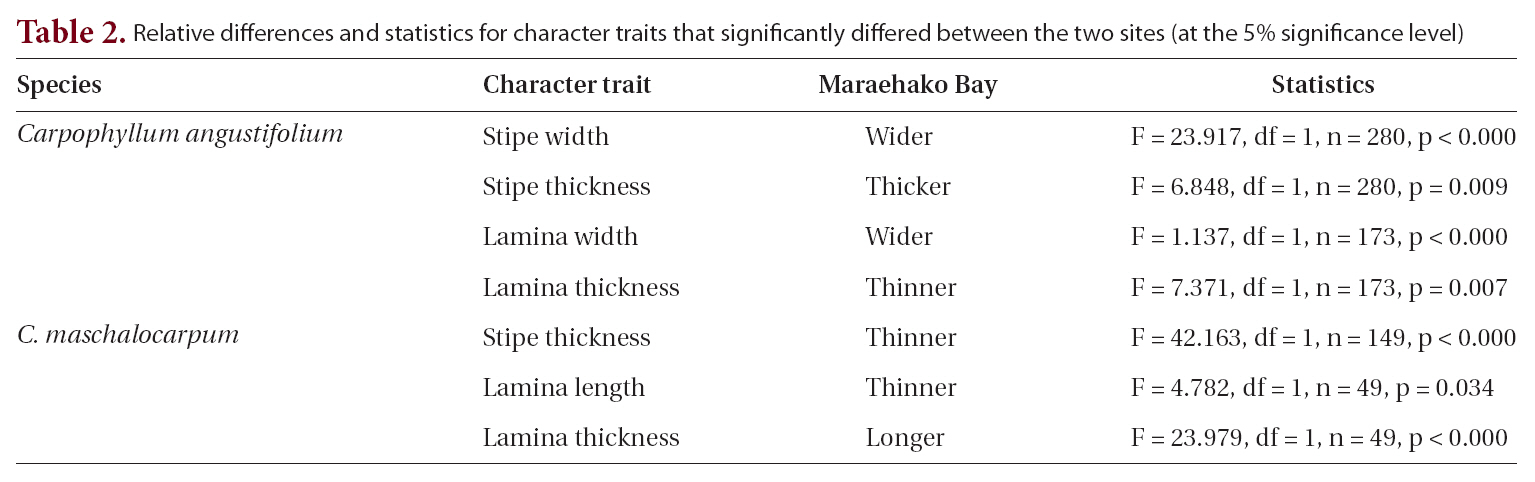
Relative differences and statistics for character traits that significantly differed between the two sites (at the 5% significance level)
Flexibility in some macroalgae results in reduced drag in higher flows (Carrington 1990, Gaylord et al. 1994).
Another opposing trend to that found in other macroalgae was in the thickness of the
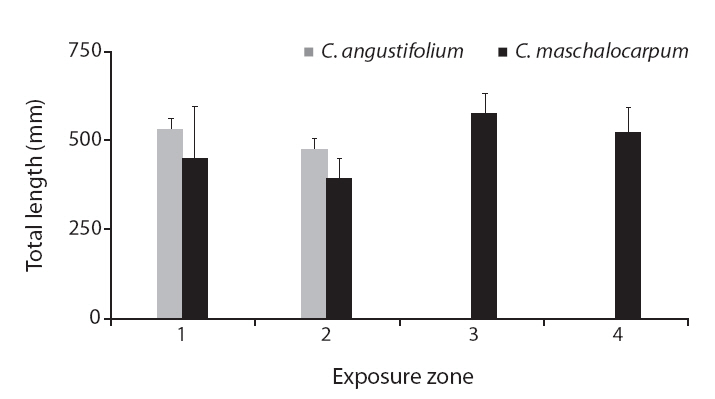
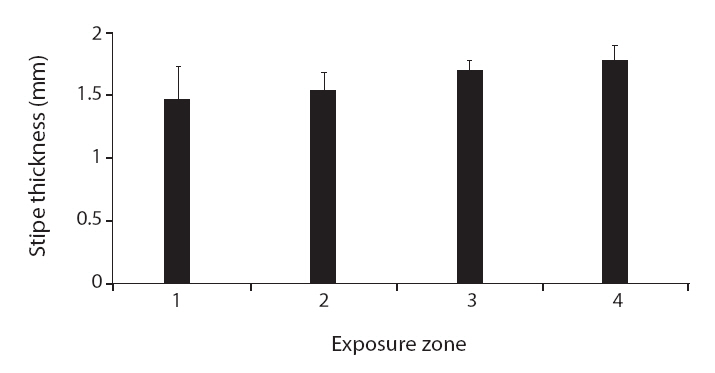
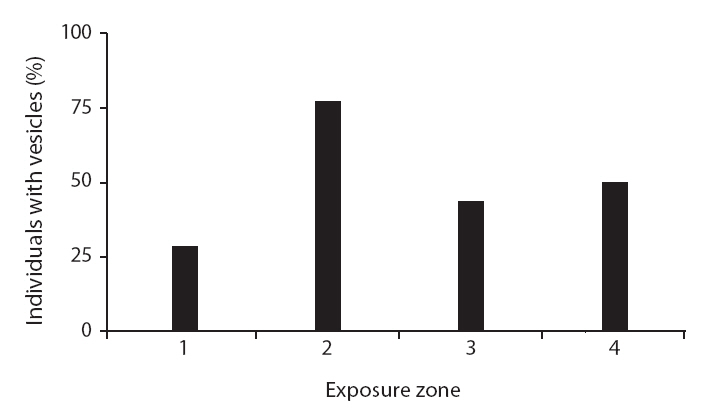
Interestingly, the relationships between wave exposure and morphology differed between the two species. The only trait that varied with wave exposure in both species was total length, which showed opposing trends in the two species. Furthermore, more morphological traits differed significantly with differences in wave exposure in
Differences in wave exposure-morphological relationships between the species could also be a reflection of different strategies for reacting to wave exposure. The consequences of wave exposure on an individual are influenced by drag and attachment strength (Kawamata 2001). Changes in length, stipe and lamina dimensions can alter drag but not attachment strength. Higher attachment strengths have been found in individuals with aggregating or larger holdfasts and in individuals from exposed locations (Dudgeon and Johnson 1992, Thomsen et al. 2004, Wernberg 2005). The relative importance of reducing drag and increasing attachment strength could differ between the two species, with a greater emphasis on reducing drag in
The relationship between morphology and wave exposure was consistent between the two sites, but morphology differed between the sites. Morphological variation between sites was found in a previous study on
It should be noted that we investigated wave exposure categorically, which has disadvantages. First, relationships between wave exposure and morphology can be obscured or confused by small-scale wave exposure variability (Kitzes and Denny 2005). In a study that compared algal morphology in exposed, semi-exposed and protected sites, Eckman et al. (2003) found that 30-50% of the variation in water flow occurred between replicates at the same site.
Further investigation of