검색 전체 메뉴
PDF
맨 위로
OA 학술지
Effect of light and sediment grain size on the vertical migration of benthic diatoms
  • 비영리 CC BY-NC
  • 비영리 CC BY-NC
ABSTRACT
Effect of light and sediment grain size on the vertical migration of benthic diatoms
KEYWORD
benthic diatom , chlorophyll fluorescence , phototaxis , pulse amplitude modulated , vertical migration
  • INTRODUCTION

    Benthic diatoms inhabiting intertidal sediments exhibit vertical migratory rhythms within the upper sediment layers, which are associated with diurnal and tidal cycles (Round and Palmer 1966, Palmer and Round 1967,Joint et al. 1982). This phenomenon is particularly well documented for estuarine intertidal microphytobenthos(MPB)(Guarini et al. 2000, Consalvey et al. 2004). Since vertical migration of microphytobenthos has been largely recognized as a key controlling factor of short-term variability in microphytobenthic productivity, it has been studied increasingly in recent years (Pinckney and Zingmark 1991, Serodio et al. 2001).

    It has been considered that the main reasons behind this vertical migration are endogenous phototaxis and geotaxis, primarily in response to light and tide (Harper 1977, Consalvey et al. 2004). Furthermore, the diel cycle of light is the main factor triggering MPB migration in subtidal zones with nearly no influence of tidal cycles (Ni Longphuirt et al. 2006). Due to the large variation of light intensity under in situ intertidal conditions, and the direct effects of light on the functioning of the photosynthetic apparatus, migratory response of MPB to light is particularly interesting (Serodio and Catarino 2000, Serodio et al. 2006).

    Some environmental factors, such as temperature and salinity, affect MPB motility (Paterson 1986, Cohn and Disparti 1994, Sauer et al. 2002, Cohn et al. 2003). Besides,sediments grain size is an important factor that is closely associated with light penetration, porosity, water content, and dissolved nutrients, as well as MPB biomass and species composition (Underwood and Kromkamp 1999, Mitbavkar and Anil 2002, Bale and Kenny 2005). This factor is also thought to influence the speed or depth to which diatom cells migrate (Hay et al. 1993, Consalvey et al. 2004). Previous studies have proven that speeds of diatom movement are different on various substrata, and vertical speeds are an order of magnitude lower than horizontal speeds (Hopkins 1963, Harper 1977, Hay et al. 1993). Migratory speed of diatoms is comparatively slower in sediments than on artificial substrata, such as glass slides. It has been observed in the field that the diatoms concentrated at a depth of 1 mm can migrate up to the surface in 1.5 hours (Hopkins 1963). Sediments components are different in grain size. Therefore, knowing the effect of grain size on migration is helpful for analyzing motility of diatoms in sediments, and for elucidating the distinction of species composition in different sediments.

    Various techniques have been utilized to investigate vertical migration, including direct observation of color change (Aleem 1950, Perkins 1960), the lens tissue technique(Eaton and Moss 1966), and cryofixation for low-temperature scanning electron microscopy (Paterson 1986, Janssen et al. 1999). In recent decade, the techniques utilizing spectral reflectance and fluorescence have been widely used to monitor changes in microphytobenthos biomass (Serodio et al. 1997, Kromkamp et al. 1998, Paterson et al. 1998, Perkins et al. 2001, Honeywill et al. 2002). Serodio et al. (1997) initially employed fluorescence techniques that use a pulse amplitude modulated(PAM) fluorometer to monitor biomass of benthic microalgae. It showed that minimum fluorescence (Fo) is lesssensitive to temperature and irradiance fluctuations compared to other fluorescence variables, and has a linear relationship with microphytobenthic biomass (Serodio et al. 1997, 2001, Barranguet and Kromkamp 2000, Honeywill et al. 2002). Furthermore, Imaging-PAM has more advantages than other types of PAMs. Because it can measure larger surface areas than other PAMs, and define numbers of interesting points simultaneously on one image. Therefore, this technique can decreases experimental error caused by the prolonged time required for measuring samples individually.

    Until now, no study has used Imaging-PAM to investigate vertical migratory behavior of benthic diatoms, even though several laboratory studies have examined this behavior by focusing on the influence of light, temperature,and salinity. In this study, we use Imaging-PAM to monitor surface biomass variation of thin layer sediment,which covers the artificial diatom biofilm in the wells of 24-well plates.

    We aim to investigate the effects of light and sediment grain size on vertical migration of individual diatom species, as well as analyze the migration mechanism through physiological and morphological characteristics of diatoms with a miniaturized experimental setup.

    MATERIALS AND METHODS

      >  Culture of diatoms

    Diatoms Amphora coffeaeformis (Agardh) Kutzing (B-95) and Cylindrotheca closterium (Ehrenber) Lewin (B-62), supplied by the Korea Marine Microalgae Culture Center (Busan, South Korea), were used as experiment species for their distinct cell shape. The diatoms were cultured in 2 L flask with f/2 medium and kept at 20oC and 12 h daily illumination with 100 ㎛ol photon m-2 s-1 of fluorescent light. The growth rates were monitored through increases in chlorophyll a concentration and cell number. Prior to experiments, and once the culture reached a constant cell number, diatom cells were harvested by centrifugation (1,000 × g, 5 min).

      >  Treatment of sediment

    The sediment, which was collected from the sand flats of Nakdong River estuary, was treated to remove organic materials. Firstly, sediment was sifted to remove shell fragments and gravel. Then, it was rinsed several times with tap water to remove most of the salt. Subsequently, 33% H2O2 was added to the sediment. It was mixed and left for several days to allow for the complete reaction to remove organic matters (Taylor et al. 2005). After decanting the overlying water, sediment was rinsed with distilled water at least 10 times, and then with deionized water at least 5 more times. Finally, sediment was dried at 60oC in a dry oven for 8 h. Certain sediment of specific grain sizes (63-125, 125-250 and 250-335 ㎛) was obtained by serially dry-sieving.

      >  Sediment chlorophyll a concentration and minimal fluorescence (Fo)

    This experiment determined variation of Fo with sediment chlorophyll a concentration in samples prepared from treated sediments to which diatoms were added. Harvested diatoms were increasingly diluted with f/2 medium to obtain a large range of chlorophyll a concentration.Each 2.0 mL diluted diatom sample was mixed well with identical sediment volumes (approximately 0.5 g). Due to the well depth influence on the imaging of samples in the marginal wells, 3.0 g of treated sediment (125-250 ㎛) was added to every well as a base to adjust the sample height. Before each sample was added, a piece of filter paper (2.3 ㎛ glass fiber) was placed to separate the base and the sample. Subsequently, each sample was added over the filter paper. All the sediments in wells were thoroughly saturated with fresh f/2 medium.

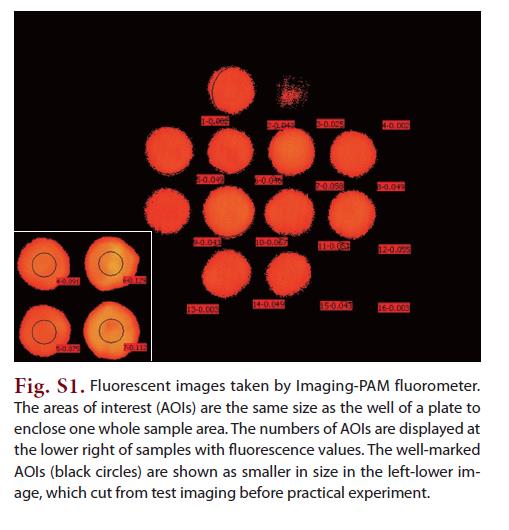
    During every measurement using the Imaging-PAM fluorometer (Max/L, Walz, Germany), the well plate was put on a fixed mounting stand position under the measuring head of the Imaging-PAM. Before measuring fluorescence,areas of interest (AOIs) were defined under Live Video Mode, with the same size as a plate well. The same AOIs were consistently used in one set of the experiment. After a 5 min dark adaptation, Fo of samples was measured.The fluorescence was induced by royal blue (450 nm) 3 W Luxeon LEDs, which have standard intensity of 0.5 ㎛ol m-2 s-1 and modulation frequency between 1 and 8 Hz. One fluorescence image was shown as an example in Appendix Fig. S1. The fluorescence values were exported as Microsoft Excel data.

    After measuring fluorescence, the chlorophyll a of sediments over filter paper was extracted in 90% acetone at 4oC under dark conditions. Chlorophyll a concentration was measured according to Lorenzen’s (1967) method by spectrometer (Agilent 8453; Agilent Technologies Inc., Santa Clara, CA, USA). The tested samples for two species, A. coffeaeformis and C. closterium, were 11 and 9, respectively.

      >  Experiments on vertical migratory photoresponse

    Preparation of the well plate was the same as previously described, viz. adjusting sample height in wells with 3.0 g treated sediments (125-250 ㎛). Cultured diatoms were deposited homogenously on glass microfiber filters (porosity 2.3 ㎛) by slow filtration (< 0.1 MPa), and then covered with approximately 1 mm thick sediments. The Fo measured by Imaging-PAM was used to monitor diatom migration from the filter surface up to the sediment surface.

    In every experiment set, initial Fo was measured before the filter with diatoms was covered by sediment. After covering with approximately 1 mm thick sediments, Fo was measured at certain time intervals after a 5 min dark adaptation. All wells with saturated samples were maintained during the experiment process.

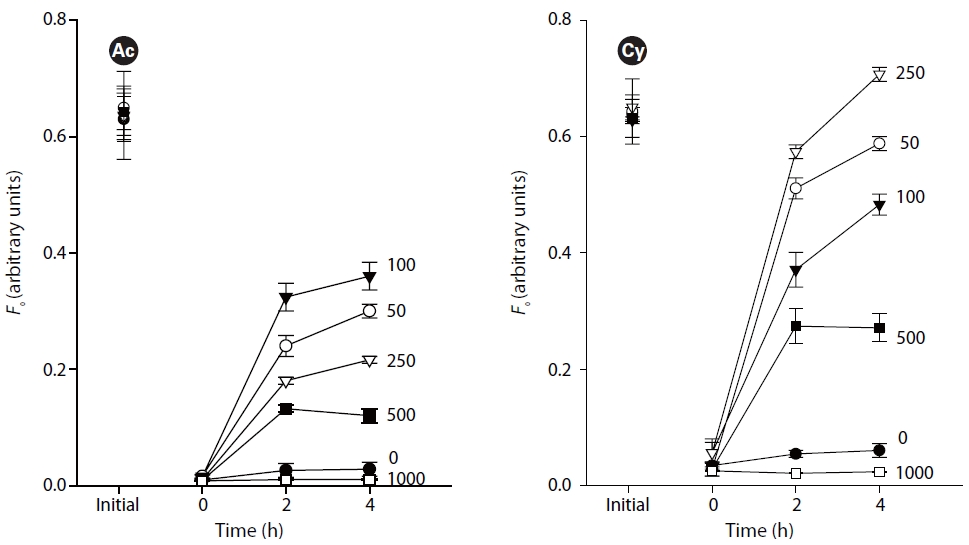
    The first set of experiments focused on the effect of light intensities on the vertical migratory response. Three replicates of each species were treated with 7 light intensities of 0, 50, 100, 250, 500, 1,000, 1,400 ㎛ol photons m-2 s-1, respectively. Covered sediments used 125-250 ㎛ grain size sand. Samples were incubated at 20oC. Fo was measured at 0 h, 2 h and 4 h.

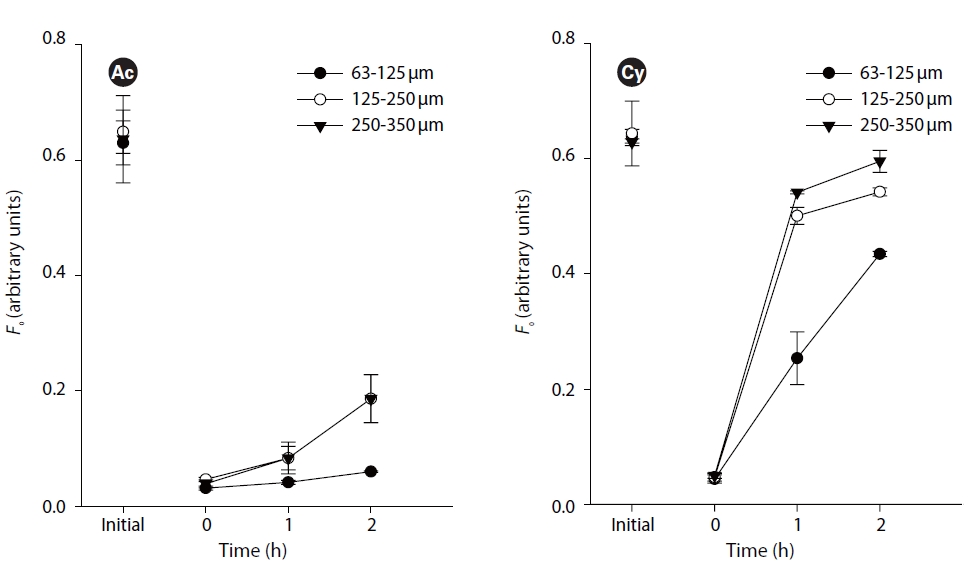
    The second set of experiments focused on the effect of sediment grain size on the upward vertical migration. Three kinds of grain size sediment (63-125, 125-250 and 250-335 ㎛) were used to cover the artificial biofilm of three replicates. Samples were incubated at 20oC and 100 ㎛ol photons m-2 s-1 for up to 2 h. Fo was measured at 0 h, 1 h and 2 h.

      >  Statistical analysis

    Univariate analyses, followed by post-hoc Tukey tests, were carried out to test the difference between different light intensities and different grain size sediment using SPSS version 17.0 (SPSS Inc., Chicago, IL, USA).

    RESULTS

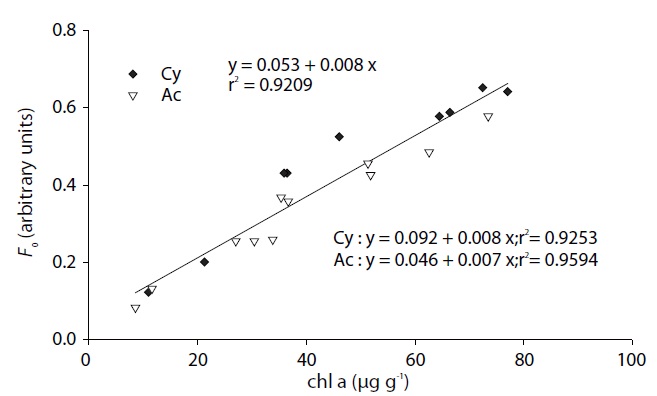
      >  Correlation of chlorophyll a concentration and Fo

    Sediment chlorophyll a concentration had a significantly linear correlation with Fo (r2 = 0.9209, p < 0.001, Fig. 1). This showed that Fo could be used as a proxy to indicate biomass variation at sediment surface. Correlation index (r2) was slightly higher than pooling of all data, but there were no differences in the slopes of the two species (p > 0.05), regarding to the linear equations of individual species (Fig. 1).

      >  Effect of light intensity

    Fig. 2 illustrates the migratory responses of individual species to different light intensities. The lowest Fo existed under 1,000 and 1,400 ㎛ol photons m-2 s-1 (not shown) which equaled that of blank samples (0.002-0.0025 arbitrary unit) and was even lower than under dark conditions.Under 500 ㎛ol photons m-2 s-1, both species showed decreased surface biomass after 4 h of illumination.The light intensity inducing the maximum surface migration for A. coffeaeformis was 100 ㎛ol photons m-2 s-1, while C. closterium was 250 ㎛ol photons m-2 s-1. Univariate analysis following the post-hoc Tukey tests showed there was no significant difference between 0 and 1,000 ㎛ol photons m-2 s-1 for either species (p > 0.05). After 4 h of illumination, there was no significant difference in the effect on either species among 50, 100 and 250 ㎛ol photons m-2 s-1 light intensity (p > 0.05). The difference of 500 ㎛ol photons m-2 s-1 with 50, 100 and 250 ㎛ol photons m-2 s-1 was significant for C. closterium (p < 0.05). However, for A. coffeaeformis, the difference between 250 and 500 ㎛ol photons m-2 s-1 was not significant(p > 0.05, Fig. 2).

      >  Effect of grain size

    Small (63-125 ㎛) grain size showed significant difference from medium (125-250 ㎛) and large (250-335 ㎛) grain size (p < 0.05, Fig. 3). However, there was no difference between middle and large grain sizes (p > 0.05, Fig. 3). Comparing similar initial values, C. closterium showed evidently higher motility than A. coffeaeformis, which surfaced up to 60% of initial biomass on the artificial biofilm within the first 1 h.

    DISCUSSION

      >  Validity of laboratory studies

    The designed experimental setting in this study was proven valid, practical and convenient for studying vertical migratory behaviors of benthic diatoms. Despite an unavoidable oversimplification of natural variability, a laboratory-based investigation was still appropriate for studying the effects of some main environmental factors on vertical migration. Under the experimental conditions in this study, it was evident that cultured diatoms showed their phototaxis by moving towards the light. The stratified structure used in the experimental design was representative for benthic biofilms in situ, and was convenient and feasible for monitoring vertical migration. Meleder et al. (2003) also employed a filtering method that allowed diatom cells to uniformly deposit on microfiber filters for the reflectance measurement of monospecific diatom cultures. Additionally, the filtering method showed no obvious damage to cells by scanning electron microscopy. Furthermore, a 24-well plate with Imaging-PAM allowed the synchronous and rapid measuring of a number of samples with less influence on the experiment treatment.

      >  Monitoring benthic diatoms biomass through minimal fluorescence (Fo)

    By measuring minimum fluorescence Fo, PAM fluorometry allows a rapid, sensitive and non-destructive monitoring of variations in surface microphytobenthic biomass. In this study, the expected linear relationship of Fo and the sediment chlorophyll a concentration were obtained and consistent with previous studies (Serodio et al. 1997, Honeywill et al. 2002, Kromkamp et al. 2006). Fo has shown the least variation in different communities (Serodio et al. 2001), which can be corroborated by no observed differences between the two species in the slope of the linear relationships in this study. However, in the field, sampling depths for chlorophyll a measurement are usually more than 1 mm and cannot be as precise as the ㎛ level unless they are cryo-cut by microtome. Given that the measuring depth of PAM fluorometer was 100 to 200 ㎛, Fo could only stand for the very surface biomass of 0-100 or 0-200 ㎛ sediments as diatom distribution or movement in deeper sediments could not be detected. Although Fo is still a good indicator for monitoring variation of surface biomass, a vertical scale mismatch may exist between it and chlorophyll a concentration of sediment in practical sampling depths (Barranguet and Kromkamp 2000).

    A dark adaptation period of 15 min has been suggested to measure Fo (Honeywill et al. 2002, Consalvey et al. 2004, Kromkamp et al. 2006), even though it was thought to be insufficient for complete reversal of non-photochemical quenching (Honeywill et al. 2002). However, due to downwards migration, a dark adaptation period of over 2 min would cause changes in biomass (Serodio et al. 2006). Also, significantly lower Fo was observed for migratory biofilms after a 5 min dark adaptation as compared to non-migratory biofilms (Jesus et al. 2006a). However, studies have shown that, for migratory biofilms, Fo does not vary significantly between 10 s, 5 min, 10 min, and 15 min dark adaptation (Jesus et al. 2006b). Short periods of dark adaptation, such as 2 min (Serodio et al. 2006) and 5 min (Serodio et al. 1997, 2001), have also been used. Therefore, with known light histories, this study used a 5 min dark adaptation, and it showed no influence on the results.

      >  Light effect on vertical migration

    The study revealed obvious phototaxis of diatoms under low to moderate irradiances (50-500 ㎛ol photons m-2 s-1). Under dark conditions, without light, there were no evident surfacing movements. High light intensity over 1,000 ㎛ol photons m-2 s-1 kept the diatoms out of the very surface of sediments where Fo could be measured by PAM. This implies that diatom cells can sense penetrated light intensity and light direction under the sediment. An additional implication is that diatoms can adjust their position through migration to avoid irradiance that is too strong and obtain optimum light intensity for photosynthesis. In regard to the decreased surface biomass after 4 h of illumination under 500 ㎛ol photons m-2 s-1, we supposed that diatoms would leave the very surface sediment after enough photosynthesis, or as a result of increasing photoinhibition during prolonged high-light treatment.

    Vertical migratory response to different irradiances has also been observed on intact biofilms of estuarine sediments (Serodio et al. 2006), namely that surface biomass increases under irradiances below 100 ㎛ol photons m-2 s-1, reaches maximum under 100-250 ㎛ol photons m-2 s-1, and gradually decreases under higher irradiances.

      >  Grain size effect on vertical migration

    Light penetration depth in sediment is closely related with sediment characteristics. Penetration depth in reconstituted and intact sediment was 2-3 mm at most, and deeper in larger size sediment under higher light intensity (MacIntyre et al. 1996). Sediment porosity (i.e., the space that diatoms move through between the grains) is closely related to sediment compaction and grain size (Flemming and Delafontaine 2000). However, the influence of sediment fabric, bulk density, and porosity on the speed of diatom locomotion through sediments has remained unclear until now.

    This study is the first attempt to determine the effect of sediment grain size on vertical migration of different species. The obvious difference between small grain size sediment and medium and large grain size sediment is the effect on the upwards migratory photoresponse. It confirmes that sediment characteristic are important factors in influencing the diatoms migration. One reason is that diatom cells can easily sense stronger light stimuli,inducing upward migration in sediment with larger grain size. Another important reason is that larger size sediment grains supply a larger space and shorter traveling distance for the movement of diatom cells. In other words, under experimental conditions without disturbance by hydrodynamic forces, grain size effect on diatom migration is mostly related to its physical property of porosity and surface area.

      >  Species-specific migratory response and ability

    In this study, migratory response to light was different between two species. The diatom C. closterium showed a maximum surface migration under 250 ㎛ol photons m-2 s-1, which was higher than that of A. coffeaeformis (100 ㎛ol photons m-2 s-1). This species-specific variation in migration has already been found in field investigations, which different species migrated to sediment surface at different time during a day following varied irradiance (Paterson 1986, Hay et al. 1993, Underwood et al. 2005, Serodio et al. 2006).

    These species-specific responses have their origin in physiological characteristics. Round and Palmer (1966) observed that Pleurosigma angulatum, which is dominant in diatom biofilms at midday, had a higher Ek (minimum saturating irradiance) between 500 and 600 ㎛ol photons m-2 s-1, while Nitzschia dubia, which displays rapid vertical migration away from the surface with increasing irradiance, has an Ek of 300 ㎛ol photons m-2 s-1. The Ek of our two cultured diatoms, C. closterium and A. Coffeaeformis, were 149 and 113 ㎛ol photons m-2 s-1, respectively(data not shown). The slightly higher Ek of C. closterium may determine its higher irradiance (250 ㎛ol photons m-2 s-1) inducing maximum surfacing biomass.

    Besides, higher motility of C. closterium was proven by its quicker migration than A. coffeaeformis. Comparing cell shape and size, C. closterium has long, narrow and only lightly or partially silicified valves (approximately 110 × 5 ㎛), while A. coffeaeformis has a hemispherical shape and nearly semi-circular valves in the lateral view (approximately 20 × 5 ㎛). Consequently, cells of C. closterium can move more quickly through sediment by rotating their frustules than A. coffeaeformis, which slide relatively slowly with their bulky bodies.

      >  Appendix

참고문헌
  • 1. Aleem A. A 1950 The diatom community inhabiting the mud-flats at Whitstable [New Phytol] Vol.49 P.174-188 google cross ref
  • 2. Bale A. J, Kenny A. J, Eleftheriou A, Mclntyre A 2005 Sediment analysis and seabed characterization. In Methods for the Study of Marine Benthos P.43-86 google
  • 3. Barranguet C, Kromkamp J 2000 Estimating primary production rates from photosynthetic electron transport in estuarine microphytobenthos [Mar. Ecol. Prog. Ser] Vol.204 P.39-52 google cross ref
  • 4. Cohn S. A, Disparti N. C 1994 Environmental factors influencing diatom cell motility [J. Phycol] Vol.30 P.818-828 google cross ref
  • 5. Cohn S. A, Farrell J. F, Munro J. D, Ragland R. L, Weitzell R. E, Wibisono B. L 2003 The effect of temperature and mixed species composition on diatom motility and adhesion [Diatom Res] Vol.18 P.225-243 google
  • 6. Consalvey M, Paterson D. M, Underwood G. J. C 2004 The ups and downs of life in a benthic biofilm: migration of benthic diatoms [Diatom Res] Vol.19 P.181-202 google
  • 7. Eaton J. W, Moss B 1966 The estimation of numbers and pigment content in epipelic algal populations [Limnol. Oceanogr] Vol.11 P.584-595 google cross ref
  • 8. Flemming B. W, Delafontaine M. T 2000 Mass physical properties of muddy intertidal sediments: some applications misapplications and non-applications [Cont. Shelf Res] Vol.20 P.1179-1197 google cross ref
  • 9. Guarini J. M, Blanchard G. F, Gros P, Gouleau D, Bacher C 2000 Dynamic model of the short-term variability of microphytobenthic biomass on temperate intertidal mudflats [Mar. Ecol. Prog. Ser] Vol.195 P.291-303 google cross ref
  • 10. Harper M. A, Werner D 1977 Movements. In The Biology of Diatoms P.224-249 google
  • 11. Hay S. I, Maitland T. C, Paterson D. M 1993 The speed of diatom migration through natural and artificial substrata [Diatom Res] Vol.8 P.371-384 google
  • 12. Honeywill C, Paterson D. N, Hagerthey S. E 2002 Determination of microphytobenthic biomass using pulse-amplitude modulated minimum fluorescence [Eur. J. Phycol] Vol.37 P.485-492 google cross ref
  • 13. Hopkins J. T 1963 A study of the diatoms of the Ouse Estuary Sussex (I). The movement of mudflat diatoms in response to some chemical and physical changes [J. Mar. Biol. Assoc. U.K] Vol.43 P.653-663 google cross ref
  • 14. Janssen M, Hust M, Rhiel E, Krumbein W. E 1999 Vertical migration behaviour of diatom assemblages of Wadden Sea sediments (Dangast Germany): a study using cryo-scanning electron microscopy [Int. Microbiol] Vol.2 P.103-110 google
  • 15. Jesus B, Perkins R. G, Consalvey M, Brotas V, Paterson D. M 2006a Effects of vertical migrations by benthic microalgae on fluorescence measurements of photophysiology [Mar. Ecol. Prog. Ser] Vol.315 P.55-66 google cross ref
  • 16. Jesus B, Perkins R. G, Mendes C. R, Brotas V, Paterson D. M 2006b Chlorophyll fluorescence as a proxy for microphytobenthic biomass: alternatives to the current methodology [Mar. Biol] Vol.150 P.17-28 google cross ref
  • 17. Joint I. R, Gee J. M, Warwick R. M 1982 Determination of fine-scale vertical distribution of microbes and meiofauna in an intertidal sediment [Mar. Biol] Vol.72 P.157-164 google cross ref
  • 18. Kromkamp J, Barranguet C, Peene J 1998 Determination of microphytobenthos PSII quantum efficiency and photosynthetic activity by means of variable chlorophyll fluorescence [Mar. Ecol. Prog. Ser] Vol.162 P.45-55 google cross ref
  • 19. Kromkamp J. C, Morris E. P, Forster R. M, Honeywill C, Hagerthey S, Paterson D. M 2006 Relationship of intertidal surface sediment chlorophyll concentration to hyperspectral reflectance and chlorophyll fluorescence [Estuar. Coast] Vol.29 P.183-196 google cross ref
  • 20. Lorenzen C. J 1967 Determination of chlorophyll and pheo-pigments: spectrophotometric equations [Limnol. Oceanogr] Vol.12 P.343-346 google cross ref
  • 21. MacIntyre H. L, Geider R. J, Miller D. C 1996 Microphytobenthos: the ecological role of the “secret garden” of unvegetated shallow-water marine habitats: I. distribution abundance and primary production [Estuaries] Vol.19 P.186-201 google cross ref
  • 22. Meleder V, Barille L, Launeau P, Carrere V, Rince Y 2003 Spectrometric constraint in analysis of benthic diatom biomass using monospecific cultures [Remote Sens. Environ] Vol.88 P.386-400 google cross ref
  • 23. Mitbavkar S, Anil A. C 2002 Diatoms of the micropytobenthic community: population structure in a tropical intertidal sand flat [Mar. Biol] Vol.140 P.41-57 google cross ref
  • 24. Ni Longphuirt S, Leynaert A, Guarini J. M, Chauvaud L, Claquin P, Herlory O, Amice E, Huonnic P, Ragueneau O 2006 Discovery of microphytobenthos migration in the subtidal zone [Mar. Ecol. Prog. Ser] Vol.328 P.143-154 google cross ref
  • 25. Palmer J. D, Round F. E 1967 Persistent vertical-migration rhythms in benthic microflora VI: the tidal and diurnal nature of the rhythm in the diatom Hantzschia virgata [Biol. Bull] Vol.132 P.44-55 google cross ref
  • 26. Paterson D. M 1986 The migratory behaviour of diatom assemblages in a laboratory tidal micro-ecosystem examined by low temperature scanning electron microscopy [Diatom Res] Vol.1 P.227-239 google
  • 27. Paterson D. M, Wiltshire K. H, Miles A, Blackburn J, Davidson I, Yates M. G, McGrorty S, Eastwood J. A 1998 Microbiological mediation of spectral reflectance from intertidal cohesive sediments [Limnol. Oceanogr] Vol.43 P.1207-1221 google cross ref
  • 28. Perkins E. J 1960 The diurnal rhythm of the littoral diatoms of the river Eden estuary [Fife. J. Ecol.] Vol.48 P.725-728 google cross ref
  • 29. Perkins R. G, Underwood G. J. C, Brotas V, Snow G. C, Jesus B, Ribeiro L 2001 Response of microphytobenthos to light: primary production and carbohydrate allocation over an emersion period [Mar. Ecol. Prog. Ser.] Vol.223 P.101-112 google cross ref
  • 30. Pinckney J, Zingmark R. G 1991 Effects of tidal stage and sun angles on intertidal benthic microalgal productivity [Mar. Ecol. Prog. Ser.] Vol.76 P.81-89 google cross ref
  • 31. Round F. E, Palmer J. D 1966 Persistent vertical-migration rhythms in benthic microflora: II. field and laboratory studies on diatoms from the banks of the river Avon. [J. Mar. Biol. Assoc. U.K] Vol.46 P.191-214 google cross ref
  • 32. Sauer J, Wenderoth K, Maier U. G, Rhiel E 2002 Effects of salinity light and time on the vertical migration of diatom assemblages [Diatom Res] Vol.17 P.189-203 google
  • 33. Serodio J, Catarino F 2000 Modelling the primary productivity of intertidal microphytobenthos: time scales of variability and effects of migratory rhythms [Mar.Ecol. Prog. Ser] Vol.192 P.13-30 google cross ref
  • 34. Serodio J, da Silva J. M, Catarino F 1997 Nondestructive tracing of migratory rhythms of intertidal benthic microalgae using in vivo chlorophyll a fluorescence [J. Phycol] Vol.33 P.542-553 google cross ref
  • 35. Serodio J, da Silva J. M, Catarino F 2001 Use of in vivo chlorophyll a fluorescence to quantify short-term variations in the productive biomass of intertidal microphytobenthos [Mar. Ecol. Prog. Ser] Vol.218 P.45-61 google cross ref
  • 36. Serodio J, Coelho H, Vieira S, Cruz S 2006 Microphytobenthos vertical migratory photoresponse as characterized by light-response curves of surface biomass [Estuar. Coast Shelf Sci] Vol.68 P.547-556 google cross ref
  • 37. Taylor J. C, de la Rey P. A, van Rensburg L 2005 Recommendations for the collection preparation and enumeration of diatoms from riverine habitats for water quality monitoring in South Africa [Afr. J. Aquat. Sci] Vol.30 P.65-75 google
  • 38. Underwood G. J. C, Kromkamp J, Nedwell D. B, Raffaelli D. G 1999 Primary production by phytoplankton and microphytobenthos in estuaries. In Advances in Ecological Research. Vol. 29.Estuaries P.93-153 google
  • 39. Underwood G. J. C, Perkins R. G, Consalvey M. C, Hanlon A. R. M, Oxborough K, Baker N. R, Paterson D. M 2005 Patterns microphytobenthic primary productivity: species-specific variation in migratory rhythms and photosynthetic efficiency in mixed-species biofilms [Limnol. Oceanogr] Vol.50 P.755-767 google cross ref
OAK XML 통계
이미지 / 테이블
  • [ Fig. 1. ]  The correlation of chlorophyll α concentration and Fo. Ac and Cy represent Amphora coffeaeformis and Cylindrotheca closterium respectively.
    The correlation of chlorophyll α concentration and Fo. Ac and Cy represent Amphora coffeaeformis and Cylindrotheca closterium respectively.
  • [ Fig. 2. ]  Effect of light intensity on the upward migration of individual species Ac: Amphora coffeaeformis and Cy: Cylindrotheca closterium. Error bars indicate standard deviation of triplicates. Uints of light intensities 0 50 250 500 1000 are ㎛ol photons m-2 s-1. The initial on x-axes is measurement time before covering the diatoms biofilms with sands.
    Effect of light intensity on the upward migration of individual species Ac: Amphora coffeaeformis and Cy: Cylindrotheca closterium. Error bars indicate standard deviation of triplicates. Uints of light intensities 0 50 250 500 1000 are ㎛ol photons m-2 s-1. The initial on x-axes is measurement time before covering the diatoms biofilms with sands.
  • [ Fig. 3. ]  Effects of grain size on the upward migration of individual species Ac: Amphora coffeaeformis and Cy: Cylindrotheca closterium. Error bars indicate standard deviation of triplicates. The initial on x-axes is measurement time before covering the diatoms biofilms with sands.
    Effects of grain size on the upward migration of individual species Ac: Amphora coffeaeformis and Cy: Cylindrotheca closterium. Error bars indicate standard deviation of triplicates. The initial on x-axes is measurement time before covering the diatoms biofilms with sands.
  • [ Fig. S1. ]  Fluorescent images taken by Imaging-PAM fluorometer. The areas of interest (AOIs) are the same size as the well of a plate to enclose one whole sample area. The numbers of AOIs are displayed at the lower right of samples with fluorescence values. The well-marked AOIs (black circles) are shown as smaller in size in the left-lower image which cut from test imaging before practical experiment.
    Fluorescent images taken by Imaging-PAM fluorometer. The areas of interest (AOIs) are the same size as the well of a plate to enclose one whole sample area. The numbers of AOIs are displayed at the lower right of samples with fluorescence values. The well-marked AOIs (black circles) are shown as smaller in size in the left-lower image which cut from test imaging before practical experiment.
(우)06579 서울시 서초구 반포대로 201(반포동)
Tel. 02-537-6389 | Fax. 02-590-0571 | 문의 : oak2014@korea.kr
Copyright(c) National Library of Korea. All rights reserved.