Phenological variables derived from remote sensing are useful in determining the seasonal cycles of ecosystems in a changing climate. Satellite remote sensing imagery is useful for the spatial continuous monitoring of vegetation phenology across broad regions; however, its applications are substantially constrained by atmospheric disturbances such as clouds, dusts, and aerosols. By way of contrast, a tower-based ground remote sensing approach at the canopy level can provide continuous information on canopy phenology at finer spatial and temporal scales, regardless of atmospheric conditions. In this study, a tower-based ground remote sensing system, called the “Phenological Eyes Network (PEN)”,which was installed at the Gwangneung Deciduous KoFlux (GDK) flux tower site in Korea was introduced, and daily phenological progressions at the canopy level were assessed using ratios of red, green, and blue (RGB) spectral reflectances obtained by the PEN system. The PEN system at the GDK site consists of an automatic-capturing digital fisheye camera and a hemi-spherical spectroradiometer, and monitors stand canopy phenology on an hourly basis. RGB data analyses conducted between late March and early December in 2009 revealed that the 2G_RB (i.e., 2G - R - B) index was lower than the G/R (i.e., G divided by R) index during the off-growing season, owing to the effects of surface reflectance,including soil and snow effects. The results of comparisons between the daily PEN-obtained RGB ratios and daily moderate-resolution imaging spectroradiometer (MODIS)-driven vegetation indices demonstrate that ground remote sensing data, including the PEN data, can help to improve cloud-contaminated satellite remote sensing imagery.
Phenology is the study of seasonality in animals and plants (Rathcke and Lacey 1985, Bullock and Solis-Magallanes 1990). Phenological variables from satellite remote sensing have been recognized as reliable variables in examining ecological dynamics in a broad region(Schwartz et al. 2006). The forest ecosystem is anticipated to undergo dynamical variations or changes as the consequence of global warming (Begue et al. 1991). Therefore,the stable maintenance of accurate and precise observation systems is critically important to the spatially and temporally continuous monitoring of ecosystems(Bradley et al. 1999, Wingate et al. 2008). The spatial coverage of satellite imagery permits us to monitor vegetation processes on regional (Kim et al. 2008), continental (Schwartz and Reiter 2000), or global scales (Arvidson et al. 2001, Zhang et al. 2003, Maignan et al. 2008).
Thus far, a variety of remote sensing techniques for phenological observations--including satellite imagery and air plane-based photography--have been employed in ecosystem studies (Gamon et al. 1995, Fensholt et al. 2004). In particular, biophysical parameters derived from satellite remote sensing, including vegetation indices (e.g., Normalized Difference Vegetation Index [NDVI], Enhanced Vegetation Index [EVI]), have been recognized as useful indicators that show vegetation phenology from regional to global scales (Myneni et al. 1997, Nasahara et al. 2008). However, satellite remote sensing imagery is limited to some degree, owing to degradations of data quality caused by atmospheric disturbances such as clouds, dusts, and aerosols. These circumstances hamper our understanding of dynamically-varying ecosystem processes at finer spatial and temporal scales. In an effort to circumvent these limitations of the satellite-based remote sensing approach, webcam or digital camera-based ground remote sensing techniques have been actively employed in recent ecological studies. The applications that have benefited from this approach thus far include mountain landscape changes (Byers 1987, Hart and Laycock 1996) and plant phenology observations (Richardson et al. 2007, Crimmins and Crimmins 2008).
In 2009, a ground remote sensing system referred to as the "Phenological Eyes Network (PEN)" System was established at the Gwangneung Deciduous KoFlux (GDK) flux tower site (Nishida 2007). The PEN system is generally installed onto a tower platform. The PEN system at the GDK site consists of an automatic-capturing digital fisheye camera (ADFC) and a hemi-spherical spectroradiometer (HSSR). The ADFC can capture the red-green-blue (RGB) reflectance imagery, which shows canopy-level phenological progression on an hourly basis. The PEN system can also generate temporal high-resolution remote sensing imagery at the canopy-scale regardless of bad weather conditions such as typhoons or rainy seasons. Thus, the PEN system allows for the collection of long-term plant phenology data at the canopy-scale without temporal data gaps.
The principal objectives of this study were: (1) to assess the precision and utility of the PEN system; and (2) to demonstrate how the RGB ratio derived from the PEN system progressed during the year 2009; and furthermore, (3) to investigate the possibility that the PEN system-driven data can improve spatial continuous satellite remote sensing data, most notably moderate-resolution imaging spectroradiometer (MODIS) products.
The PEN system was installed at the Gwangneung ecological tower in the mid-western region of the Korean Peninsula (37.74878 N, 127.14898 E). The tower is approximately 50-m away from the GDK flux tower site (http://www.koflux.org/). Hereafter, the Gwangneung PEN site will be referred to as the GDK-PEN site. This site is within a forest watershed of a 220 ha area covered largely with deciduous hardwoods. The site elevation is 330 m and the watershed elevation ranges from 270 to 490 m from mean sea level. The annual average mean temperature and annual total precipitation are 11.5°C and 1,332 mm, respectively. In the vicinity of the ecological tower, 80-200 year old deciduous broadleaf forests--primarily
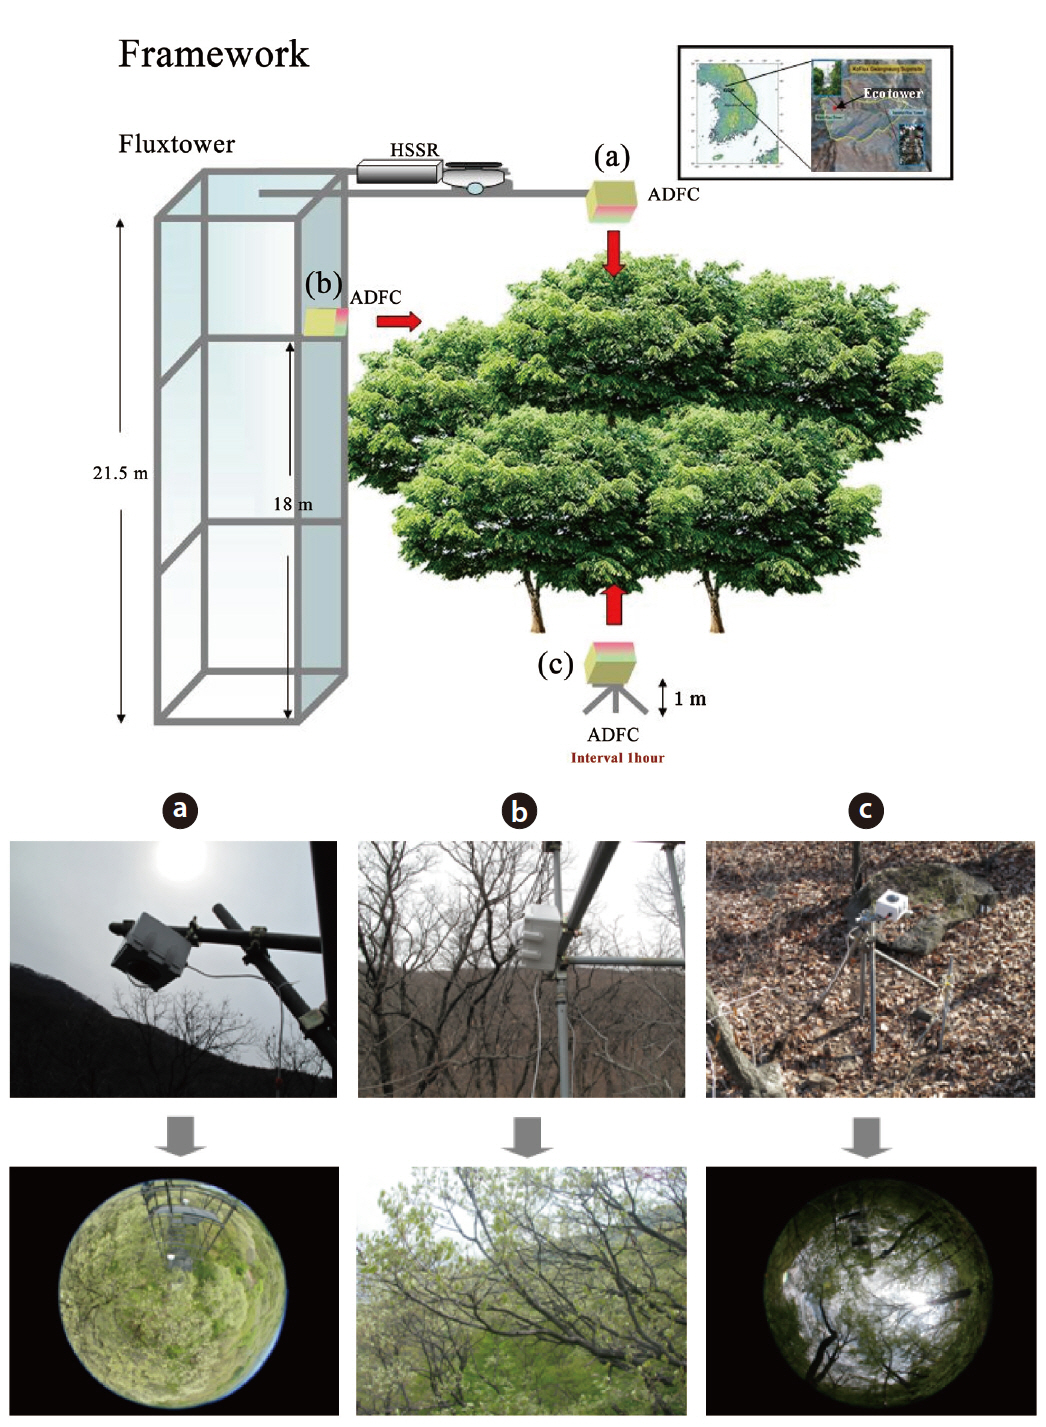
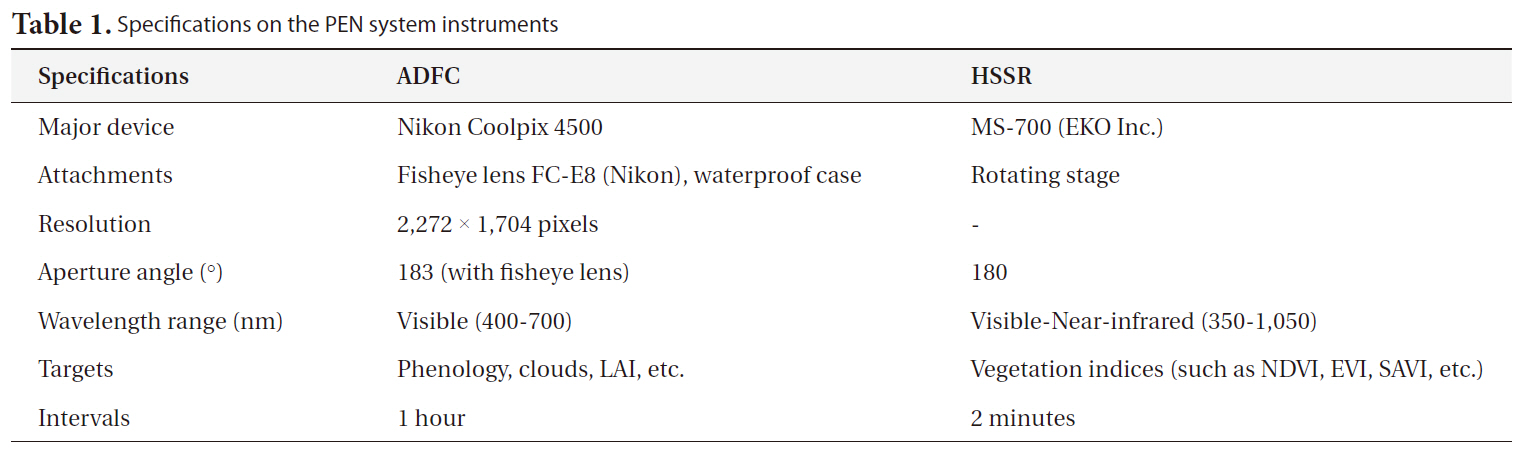
The PEN system was installed at the GDK-PEN site in March of 2009. The PEN system consists of three ADFCs and one HSSR. The characteristics of the instrument are summarized in Table 1 and Fig. 1 shows the framework of the PEN system at the GDK-PEN site. In detail, the ADFC consists of a high-quality digital camera (Nikon Coolpix 4500; Nikon, Tokyo, Japan), a fisheye lens (FC-E8; Nikon) and a waterproof case. Three ADFCs were installed at the top (21 m), middle (18 m), and ground (1 m) levels of the canopy, respectively; thus, the imagery from the PEN is not contaminated by clouds or dusts in the atmosphere. The imagery from the ADFC contains the combined brightness values at the RGB wavelength bands. The ADFC was scheduled to collect RGB brightness data on an hourly basis between 6 AM and 8 PM. The three cameras were connected to a laptop PC using a LAN cable, such that all digital image files are automatically stored in the laptop PC in JPEG format.
The HSSR consists of a rotating-stage and MS-700 spectroradiometer (EKO instruments Co., Ltd., Tokyo, Japan). It is mounted atop an ecological tower (Fig. 1). It measured irradiance in both the sky and forest canopy at 2-min intervals with a wavelength range from 350 nm to 1050 nm. We can calculate various vegetation indices (such as NDVI, EVI, PRI, etc.) with the HSSR irradiance data. In this study, however, we utilized data from the ADFC only.
[Table 1.] Specifications on the PEN system instruments

Specifications on the PEN system instruments
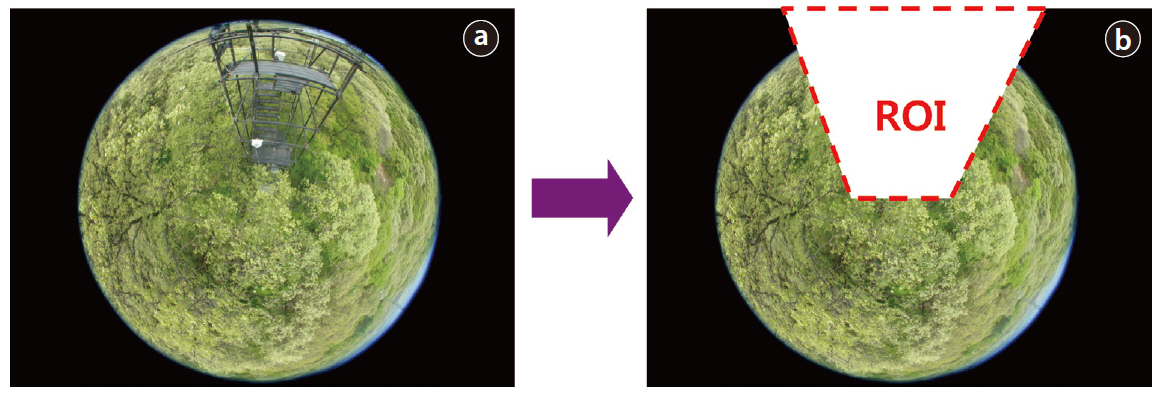
In this study, the canopy top RGB brightness data observed at midday from noon to 2 PM were averaged to assess daily variations in canopy phenology from day of year (DOY) 80 (March 21) to DOY 337 (December 3) in 2009. During this study period, a total of 53 days of data were missing due to power failures caused by stormy weather conditions, but the remaining 205 days of data proved sufficient to assess the seasonal progression of the canopy phenology. Fig. 2a shows a sample image taken from the ADFC at the top of the ecological tower on DOY 153. Analyses of the RGB average values were conducted, except for the portion in the image occupied by the flux-tower materials. IDL software ver. 6.3 (ITT Visual Information Solution, Boulder, CO, USA) was applied to remove the tower part from the region of interest, as shown in Fig. 2b. To extract the RGB digital numbers (DNs), which are brightness values, all of the JPEG imagery files were converted to IDL IMAGE format. Each image consists of 2,272 × 1,704 pixels and was saved as 8-bit RGB colors. Then, the brightness ratios of each R, G, and B DN value were calculated for each temporal image; R_ratio = R/(R + G + B), G_ratio = G/(R + G + B) and B_ratio = B/(R + G + B).
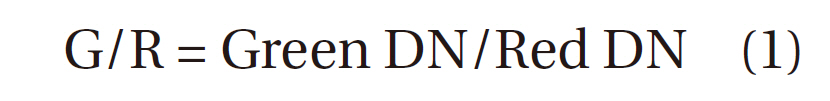
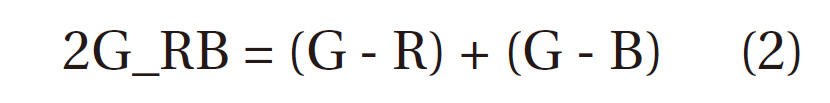
Together with the brightness ratios, this study adopted two additional indices for spectral analysis based on the ratio and difference between band DN values. One is the G/R ratio (Eq. 1) and the other is the 2G_RB index (Eq. 2), as previously proposed by Richardson et al. (2007).
>
Satellite remote sensing data
For comparison with the PEN data, in this study, daily vegetation indices from the MODIS09GA reflectance products of the National Aeronautics and Space Administration’s (NASA) Terra satellite were employed. The MODIS09GA product includes daily information on temporal resolution, and a spatial resolution of 500 m × 500 m. The NDVI and EVI were calculated from the MODIS09GA data using the following equations:


where NIR, RED, and BLUE are the surface reflectance of near-infrared (700-1,200 nm), red (600-650 nm) and blue (450-500 nm) band wavelengths, respectively. L, C1, and C2 included in the EVI equation are coefficients used to correct for the effects of atmospheric aerosols and back canopy background soil. L is used to correct the canopy background adjustment, and C1 and C2 in Eq. 4 are the coefficients used to correct for aerosol resistance in the air. In this study, the values for C1, C2, and L were 6, 7.5, and 1, respectively (Huete et al. 2002).
In comparison to the NDVI, EVI can distinguish between canopy and canopy background signals, and can also correct for atmospheric influences such as aerosol (Miura et al. 2001). MODIS09GA provides quality control (QC) flags for each band reflectance, and the state flags were used to distinguish pixels free from cloud and cloud shadow effects.
>
Intra-annual variations of the red, green, and blue ratios
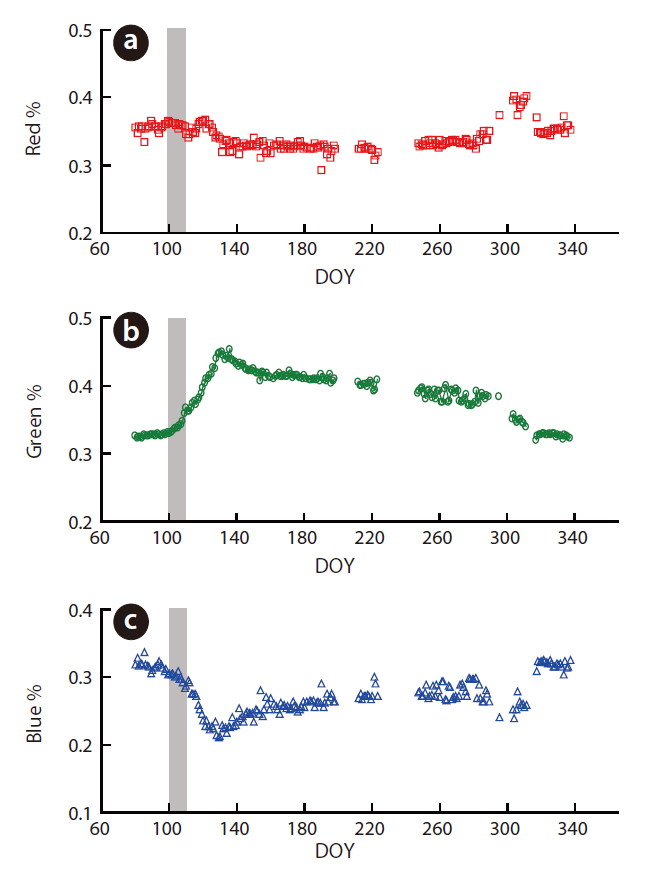
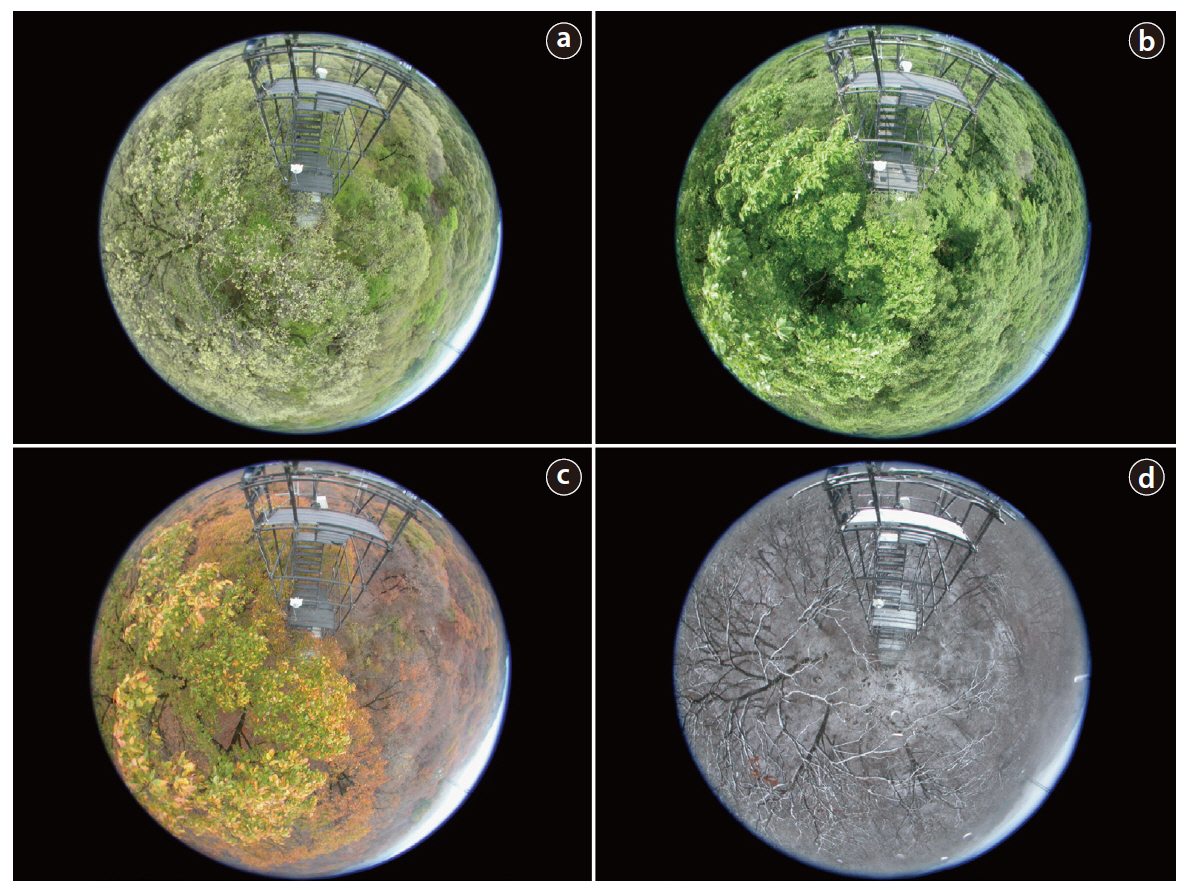
Fig. 3 shows sample seasonal imagery captured by the ADFC at the top of the flux tower at the GDK site in 2009. The time series of R, G, and B ratios from the imagery were illustrated for the period spanning March 21 (DOY 80) to December 3 (DOY 337) in 2009, as seen in Fig. 4. The shaded bar in the time series is indicated as the onset periods based on Lim’s detection data (unpublished data from the Korea Forest Research Institute [KFRI]). The R_ratio evidenced a slight pattern of decline after DOY 110, which might correspond to the leaf sprouting period, whereas after DOY 290, the R_ratio increases rapidly, reflecting leaf coloration. The G_ratio increased substantially (13%) between DOY 100 and DOY 130, whereas the B_ratio evidenced a commensurate decline. By way of contrast, the B_ratio exhibited a pattern of decrease (12%) during the periods in which the G_ratio increased. Thus, in this season, the R and B_ratios predominated over the G_ratio because red and blue wavebands were absorbed by leaf chlorophyll for photosynthesis during the leaf growing season, whereas green was reflected more than blue and red by leaves. During the off-growing season, the ADFC captures reflected radiation from the soil and fallen leaves, as shown in Fig. 3d.
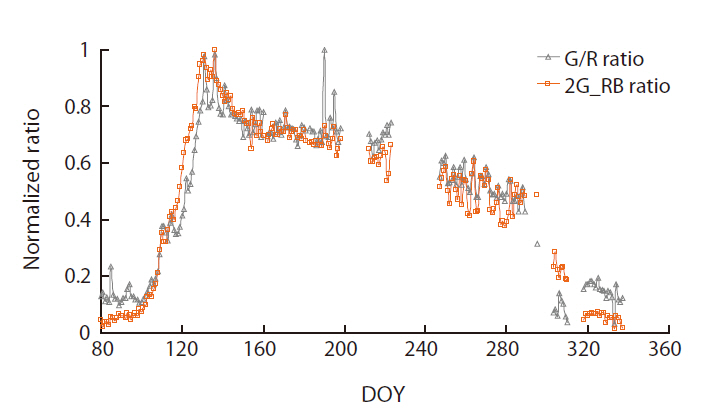
Fig. 5 represents the intra-annual time series of normalized G/R and 2G_RB indices in 2009 at the GDK site. After the normalization of both indices from 0 (minimum)
to 1 (maximum), the indices evidenced similar intra-annual patterns, such as springtime rapid increase, gradual decrease, and then rapid decrease in late autumn. Prior to DOY 100 (April 9), both indices were as low as 0.05 and 0.15. Between DOY 100 and DOY 130, the indices rapidly increased (Fig. 5). After a marked peak around DOY 130, both indices decreased gradually until the leaf-coloring season around DOY 290, followed by a rapid decline. This gradual decrease of the indices seems relevant to the finding that, after DOY 130, the relative green brightness (G_ratio) decreased but the B_ratio increased, while the R_ratio remained almost unchanged (Fig. 4).
>
Comparison with MODIS-driven vegetation indices
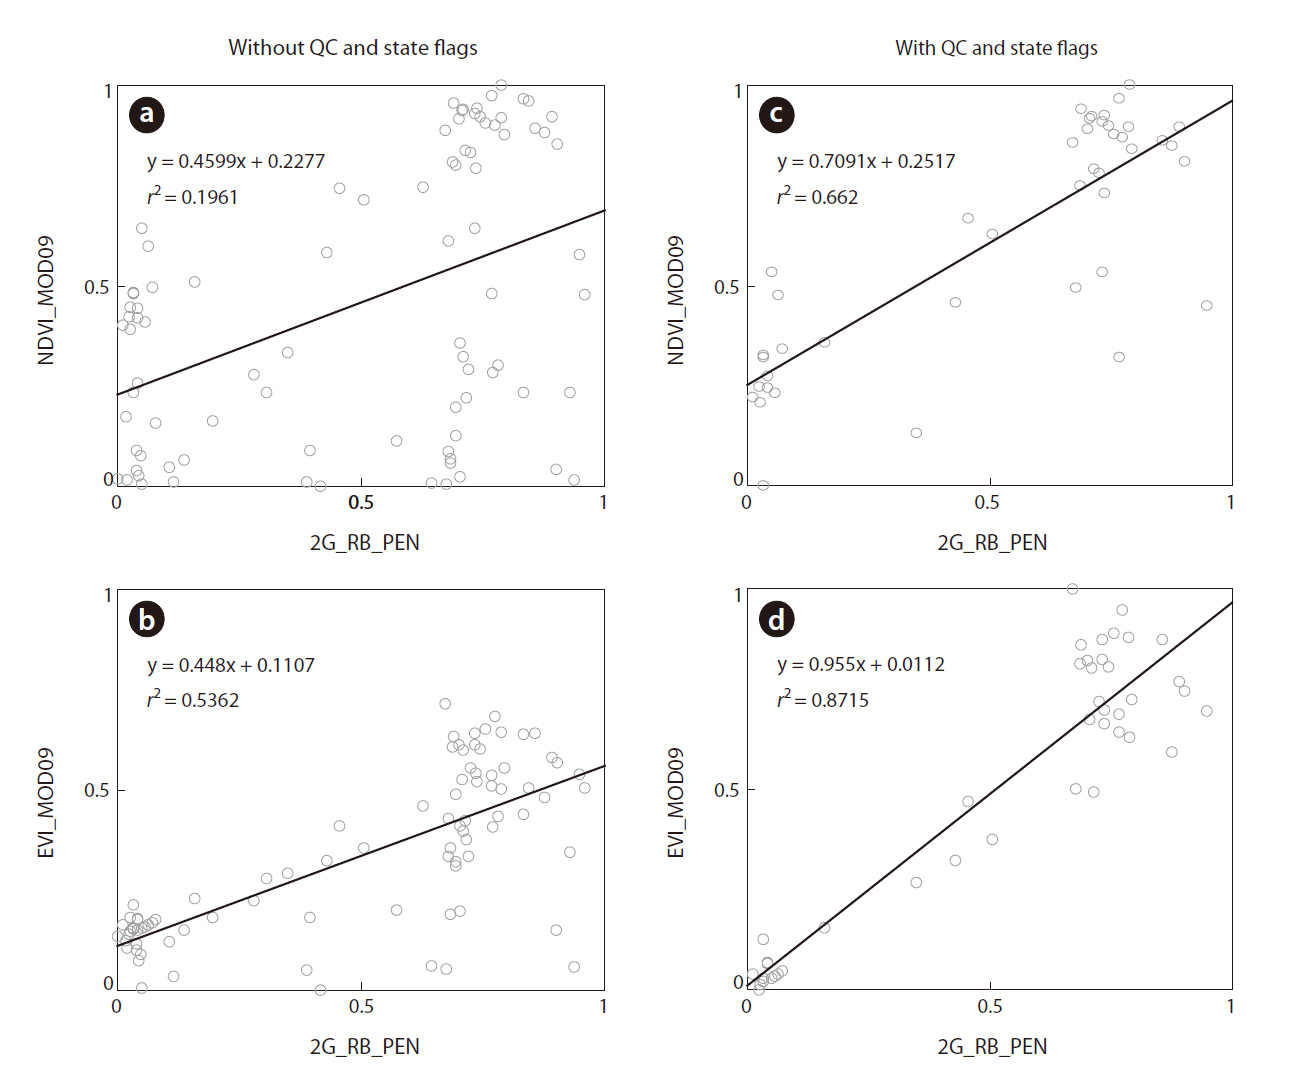
The 2G_RB index obtained by the ADFC was compared with the NDVI and EVI values derived by the MOD09 daily products for the spring season from DOY 80 to DOY decid180 in 2009 (Fig. 6). This comparison was conducted to evaluate the sensitivity of satellite-driven MODIS vegetation indices to the rapid springtime change of the forest canopy reflected in the PEN ADFC data. After the calculation of daily NDVI and EVI values from the MODIS band reflectance data (Eqs. 3 and 4), the MODIS indices were normalized from 0 to 1, as was also done for the G/R and 2G-RB indices for direct comparison. In this comparison, we prepared two sets of MODIS data, including and excluding MODIS data with inappropriate QC flags (i.e., contaminated by cloud, cloud shadow, or snow). Fig. 6a and 6b are the former case, and Fig. 6c and 6d show the latter case.
The latter case (exclusion) evidenced a stronger correlation with the 2G_RB index than the former case; this reflects the importance of considering QC flags in deriving reliable MODIS NDVI and EVI values from MODIS09GA data. Additionally, in the comparison of the 2G_RB index with uncontaminated NDVI and EVI (Fig. 6c and 6d), EVI agreed more strongly with the 2G_RB index than with the NDVI, which implies that EVI performs better than NDVI in the detection of the rapid springtime change in forest canopy phenology. This result is likely attributable to the effects of background soil and branches, as shown in the early springtime digital images obtained by the ADFC (Fig. 3a). Overall, our results demonstrate that the spectral index derived from PEN ADFC (e.g., 2G_RB) can capture optical signals free from atmospheric disturbances and hence, is useful for the reliable testing of spectral vegetation indices from satellite remote sensing data.
The results of this study clearly demonstrate that the PEN system may prove potentially useful in the continuous monitoring of ecosystems, regardless of weather conditions. The spectral indices derived from the ground remote sensing data provided by the PEN system permits observations of ecosystem phenology at higher temporal resolutions than are currently possible with satellite imagery. For instance, the inflection points observed in the time series of the 2G_RB and G/R indices of the DBF vegetation type of the GDK site can be used to detect accurately the onset (DOY_100, April 10) and offset (DOY_290, October 17) of the leaf growth period. Additionally, after a peak on approximately DOY_130 (May 10), the time series 2G_RB and G/R indices reflected leaf darkening, from a beginning pale green to dark green. Thus, the PEN system provides canopy development imagery on a realtime basis that reveals intra-annual canopy phenology.
It has been determined that some synchronies exist between the PEN vegetation index and NDVI and EVI derived from the MODIS09 satellite remote sensing data. In particular, at the onset of canopy leafing, MODIS NDVI evidenced a dramatic increase with the PEN 2G_RB index. Meanwhile, the MODIS09 data, to which no QC was applied, evidenced lower accuracy because satellite remote sensing is affected profoundly by cloud conditions. During the period of comparison from DOY 80 to 180 (total 101 days), the MODIS data used only 42 days; however, the PEN data used almost all of the data. Furthermore, the PEN system provides high-resolution digital image data and highly accurate spectral data.
In fact, there are some clear differences in observational temporal and spatial scales between the ground-based PEN system and the space-based MODIS satellite system. With regard to temporal resolution, the PEN system is superior to the MODIS09 system. The quality of the PEN system data can monitor both upward and downward canopy phenology with no cloud contamination issues, whereas the MODIS satellite data suffers from weather conditions. However, the weakness of the PEN system is that it is a point observational method. The coverage area of a PEN system based on the tower height covers an area of approximately 30 m × 30 m only, whereas a pixel in the MODIS09 satellite imagery covers a 500 m × 500 m region. This means that PEN system installations at multiple sites will be necessary to monitor ecosystems over broad areas containing various types of vegetation.
The PEN system is capable of continuously observing upward and downward canopy phenology with high resolution, regardless of air contaminants. In this study, the downward ADFC (Fig. 1a) was used only to calculate various spectral indices via RGB analysis. Meanwhile, the upward ADFC (Fig. 1c) can be effectively applied to estimations of the Leaf Area Index (LAI) using hemispherical photograph analysis software such as Hemiview, Winscanopy, etc. The estimation of LAI is somewhat difficult; however, digital images of the upward ADFC should aid in the development of a simple and useful method for estimating LAI.
Results indicate that RGB data derived from digital image captured by the PEN system are useful to monitor canopy phenology from leaf growth to leaf fall of a deciduous broadleaf forest in GDK site in 2009. The RGB ratio analyzed from Downward ADFC digital images are sensitive enough to demonstrate canopy vegetation phenology during leaf expansion or leaf coloring or leaf fall. The tower-based ground PEN remote sensing system is useful in the high-accuracy monitoring of intra-annual canopy phenology, and should also prove valuable in refining of satellite remote sensing data in areas containing various types of vegetation.


![Phenology at the Gwangneung Deciduous KoFlux site. (a) Spring (day of year [DOY] 115). (b) Summer (DOY 180). (c) Late autumn (DOY 305). (d) Early winter (DOY 339).](http://oak.go.kr/repository/journal/10653/STHHCL_2011_v34n2_149_f003.jpg)