Analyzing ecological data and interpreting its attributes is one of the most difficult tasks in ecological research.The intrinsic complexity of analysis increases due to uncertainty in an ecosystem, particularly when considering field-survey based data. Subsequently, some ecologists have developed and used reliable models representing a target ecosystem that they want to predict and understand. Nevertheless, modeling still has limitations in real world applications, because it is essentially a simplification and approximation of actual processes in a variable and complex system. For this reason, data-driven methods, regardless of statistics or data-learning approaches, are readily used and applied in ecological research. However, these methods require a large volume of data to analyze ecological patterns. Particularly, it is very difficult to expect significance from results without a sufficient number of data samples. Thus, this type of analytical method commonly favors long-term monitoring data.
The history of long-term studies in ecology begins with Rothamsted research in the 1850s (Taylor 1989).Since then, intensive and comprehensive research has been conducted through the efforts of International Long Term Ecological Research (LTER). For example, the US LTER program expanded from six projects in 1980 to 24 projects involving more than 1,100 scientists in 2003 (Hobbie et al. 2003). Many other countries are becoming interested in the historical changes in ecosystems to understand the present and anticipate the future. Environmental problems are difficult to recognize, identify and solve without a long-term sustainable and consistent approach. Therefore, the importance of LTER networks is being emphasized in ecological research. In 2004, the Korean Ministry of Environment initiated the National LTER program comprised of three stages and four research areas (i.e., terrestrial, animal, freshwater and coastal ecosystems) designed to investigate ecosystem dynamics with respect to climate change and environmental pollution. In the present study, we analyzed LTER monitoring data from a freshwater ecosystem, the Nakdong River, to evaluate relationships among measured parameters for different river reaches.
The Nakdong River is typical of a regulated river ecosystem whose flow is controlled by dams and an estuarine barrage. Changes in precipitation patterns have led to morphological alterations in the river, and the high demand for water resources in South Korea has further accelerated these changes. Because this river is principally characterized as a reservoir-river ecosystem, eutrophication has become an increasing concern for the lower Nakdong River (Kim et al. 1998). Subsequently summer cyanobacterial (Ha et al. 1999) and winter diatom blooms (Kim et al. 2007) often recur. For this reason, it is important to understand how to control water quality in the Nakdong River. Jeong et al (2007) reported that phytoplankton biomass is subject to flow variations and dam operation on this river. However, research interpreting the relationship between water quality parameters at multiple study sites in the Nakdong River is rare.
In this study, we focus on analyzing LTER data and extracting significant information. Subsequently this study aims to elucidate spatio-temporal relationships and longitudinal differences among limnological parameters obtained through long-term monitoring research. Then, we describe the environmental characteristics of the study sites with respect to the longitudinal aspect of the river. The remainder of the article considers data issues for ecological analysis and emphasizes the necessity for the National LTER program in South Korea.
>
Study sites on the Nakdong River
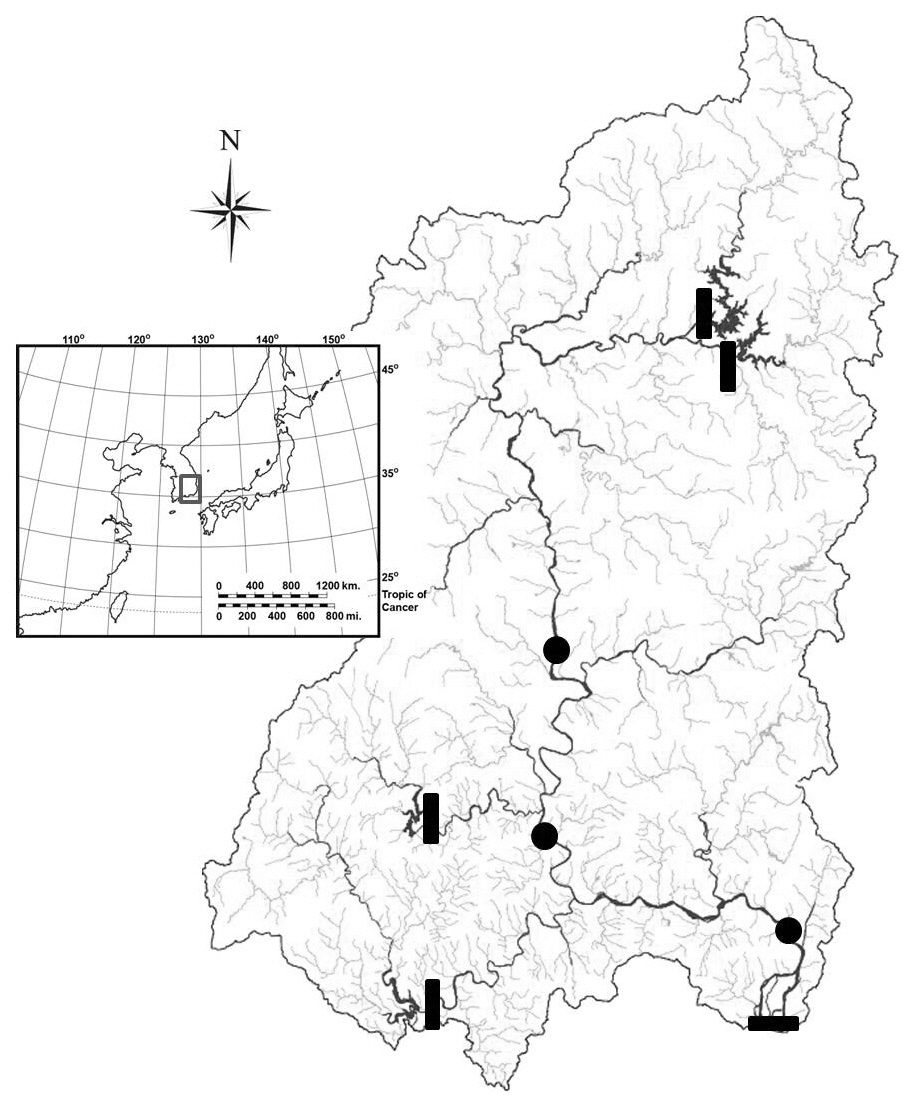
The Nakdong River is the second longest river (ca. 525 km) on the Korea peninsula. Over 10 million people rely on this catchment as a water resource. As more than 60% of the precipitation is intensively concentrated in summer, such circumstances cause difficulties for efficient utilization (Park et al. 2002). Subsequently, the river-regime coefficient (ca. 370) of the Nakdong River is larger than other world-wide rivers; the Thames (8), the Rhine (14), the Yangtze (22) and the Mississippi (119). Hence, this river has been physically modified for flow regulation and appropriate allocation of water resources. The Korean Ministry of Environment has designated LTER sites in the four major river basins and is facilitating ecological projects for collecting data on various environmental parameters.
We selected three sites in the Nakdong River basin among the National LTER measuring stations (Fig. 1). The study sites are approximately 80 km from each other longitudinally. Waegwan (site 1) is the furthest upstream of the study sites (river kilometer from the river mouth, RK 192). As it is located above two large population cities (Busan and Daegu), this site is recognized as less polluted than other downstream areas. Jeokpo (site 2, RK 107) is located between two major confluences of the Geumho and Nam rivers. The pollution level of the Geumho River was severe in the early 1990s (Kwon and An 2006) and has since been mitigated by improvements through water treatment (Bae et al. 2000). Mulgeum (site 3, RK 27) is a representative freshwater ecosystem in which limnological characteristics are hybridized between an estuary and a river-reservoir due to flow regulation from an estuarine barrage (Kim et al. 1998). Algal blooms appear more explicitly here than at the other sites further upstream. Nevertheless, this site is very important and strictly preserved due to the presence of Busan City water intakes (Joo et al. 1997).
>
Data measurement and collection
Data measurements were divided into two procedures; 1) field-measurements and 2) lab analysis. Water samples have been collected biweekly since June 1994; thus, 14 years of data were derived from three measuring stations (i.e., Waegwan, Jeokpo and Mulgeum; sites 1, 2 and 3 respectively) from June 1994 to May 2008 (N = 349). Field-sampling parameters assessed included water temperature, dissolved oxygen (DO) (YSI model 55; Yellow Springs Instrument, Yellow Springs, OH, USA), pH (Orion Model
250A; Orion Research Inc., Boston, MA, USA), conductivity (YSI model 30; Yellow Springs Instrument) and Secchi disc depth (20 cm diameter). Other parameters, such as turbidity (Model 100B; HF Scientific Inc., Ft. Myers, FL, USA), alkalinity, nutrient concentration (e.g., nitrogen, phosphorus and silica) and chlorophyll a were analyzed in the laboratory. Most analyses for measuring the limnological variables utilized standard methods devised by Wetzel and Likens (2000).
In addition to field-sampled parameters, we considered data available from the public domain. Most hydrological and meteorological data were obtained from the Korean Water Management Information System (http://www.wamis.go.kr). We used 7-day-accumulated rainfall for Andong, Daegu, Hapcheon, Jinju and Miryang, and averaged it based on how 7 day’s of precipitation would fully affect the limnological aspects of the sites (Waegwan, Jeokpo, and Mulgeum). This was then referred to as the hydrological rainfall-runoff impact. Furthermore, we also used 7-day-average dam discharges from the four major multi-purpose dams to establish flow rates.
Factor analysis (FA) was employed to pattern the longitudinal aspects of water quality variables in the Nakdong River. This multivariate statistical method reveals relationships among variables by extracting significant components. Forty variables from three study sites were used in the FA. During the analysis, principal component analysis was employed as an extraction method, and varimax with Kaiser normalization was used as the rotation method. All methodologies were performed using the commercially available statistical software package, PASW Statistics ver. 18 (SPSS Inc., Chicago, IL, USA).
>
Basic statistical results for the parameters
Prior to applying the multivariate ordination method, all data (
First, the trophic status of the river is conditionally hypertrophic. Total nitrogen (TN) was more than 3.0 mg/L, and total phosphorus (TP) was more than 100 μg/L. As reported by Shim et al. (1995), hypertrophic levels are described when TN and TP are greater than 1.5 mg/L and 0.1 mg/L respectively. Additionally, chlorophyll
Secondly, many of the environmental parameters seldom differed between sites. Water temperature, DO (mg/L and %), alkalinity, turbidity and some nutrients did not show distinctive changes longitudinally along the river. However, some variables changed slightly upstream to downstream or vice-versa. Conductivity was relatively high at site 2, Jeokpo, whereas pH was highest at site 3. The silica concentration was reduced in the lower reaches of the river (site 3), although other nutrients showed similarities upstream to downstream. River volumetric flow was lowest at site 1 (upper part) and highest at site 3 (lower part), where the volume was approximately three
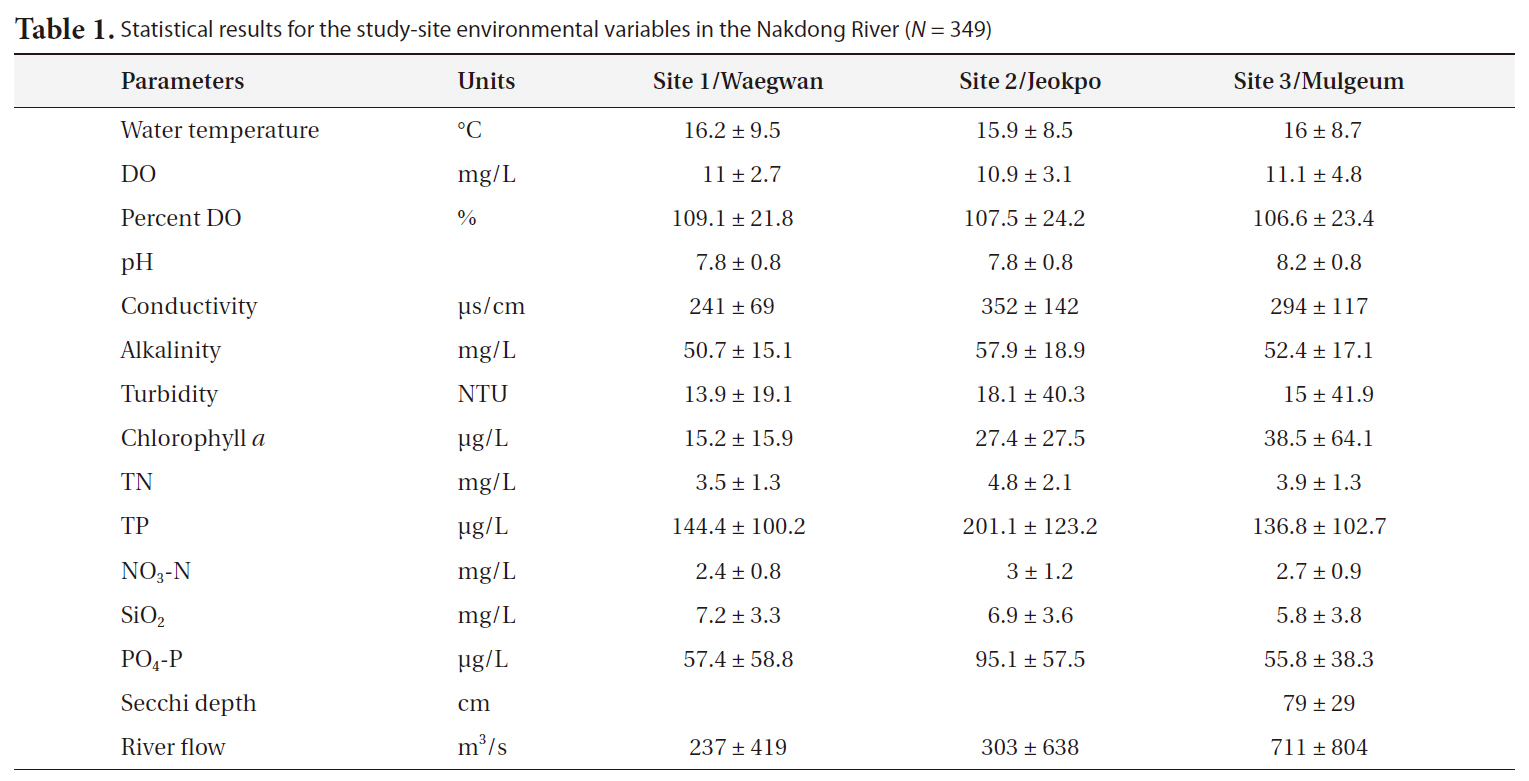
Statistical results for the study-site environmental variables in the Nakdong River (N = 349)
times larger.
Finally, chlorophyll a concentration showed an increasing gradient progressing downstream from sites 1 to 3. At site 3, Mulgeum, average chlorophyll
>
Temporal patterns of the major parameters
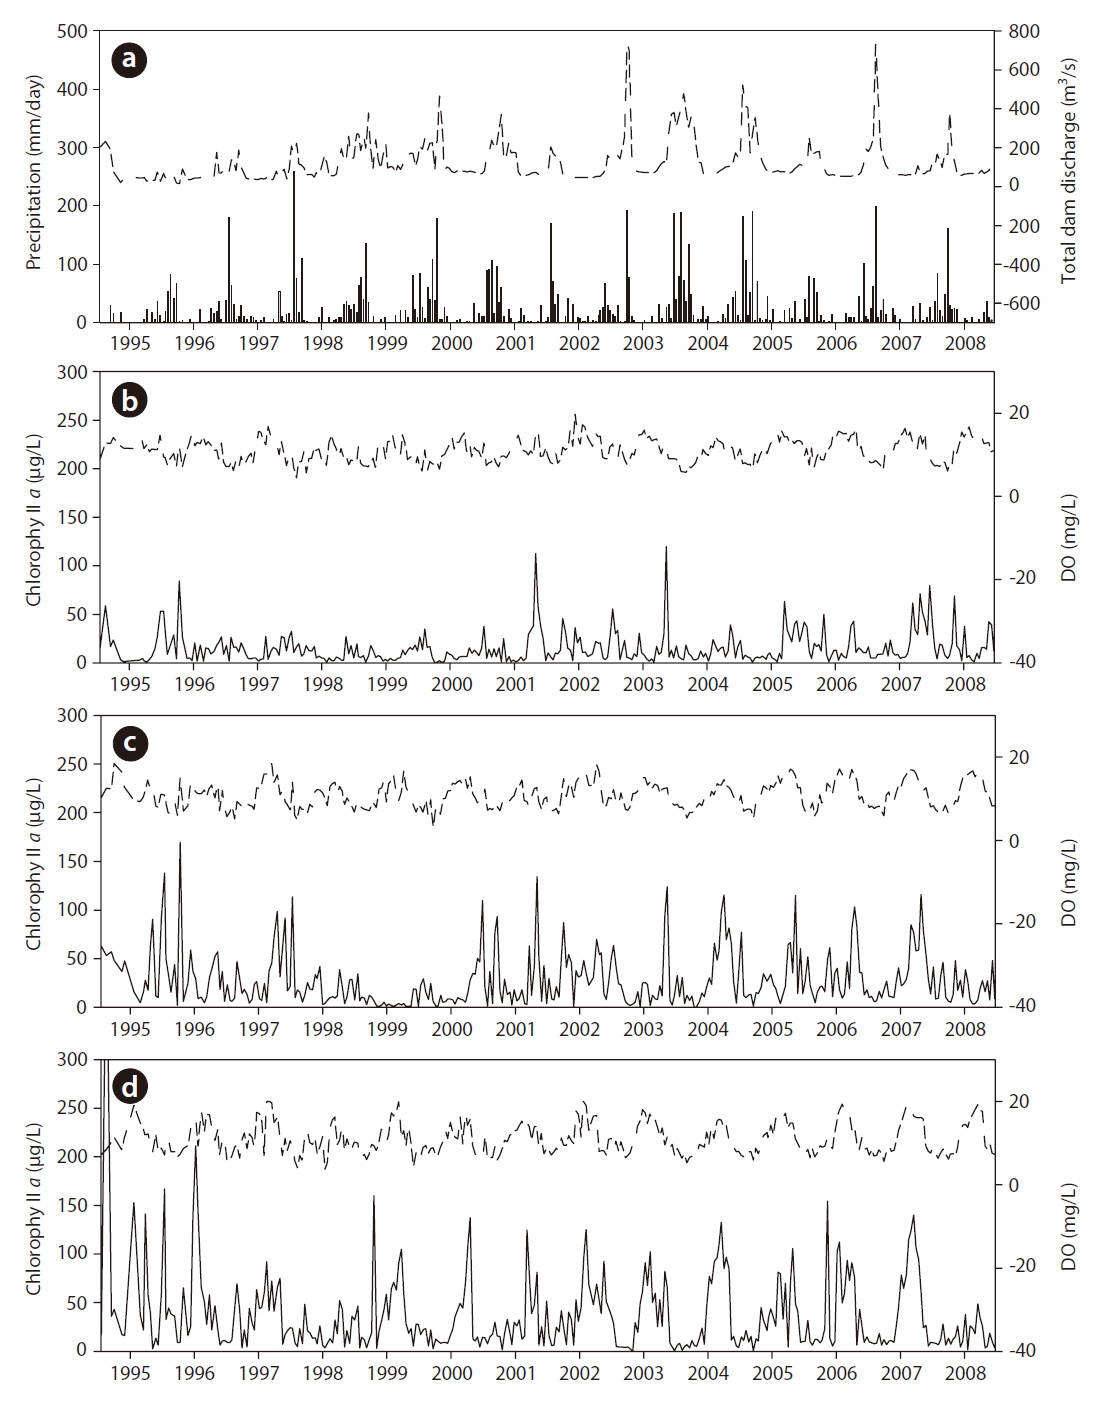
Some important variables were identified from the time-series data (Fig. 2). First, precipitation and total dam discharge were compared through time. Total discharge was reflected by the amount of precipitation. The magnitude of discharge was almost proportional to rainfall intensity. However, in the mid 1990s, precipitation did not cause increased dam discharge (Fig. 2a).
Next, chlorophyll a dynamics were determined for the study sites and compared to the change in DO (Fig. 2b-2d). DO showed regular fluctuations, which were normally high in winter and low in summer. This regularity was relatively weak in the 1990s, particularly when algal blooms occurred more frequently. Chlorophyll a was the most moderate, except for some high spring peaks. The highest chlorophyll a peak was observed in the summer of 1994 at site 3, and both the frequency and magnitude of algal blooms were larger than for other sites.
Overall, the pattern of chlorophyll a concentration was irregular and non-stationary. Therefore, it was difficult to extract significant characteristics from the parameters and explain their ecological features for each site, specifically based on a time-domain graphical analysis.
>
Spatial differences in limnological attributes
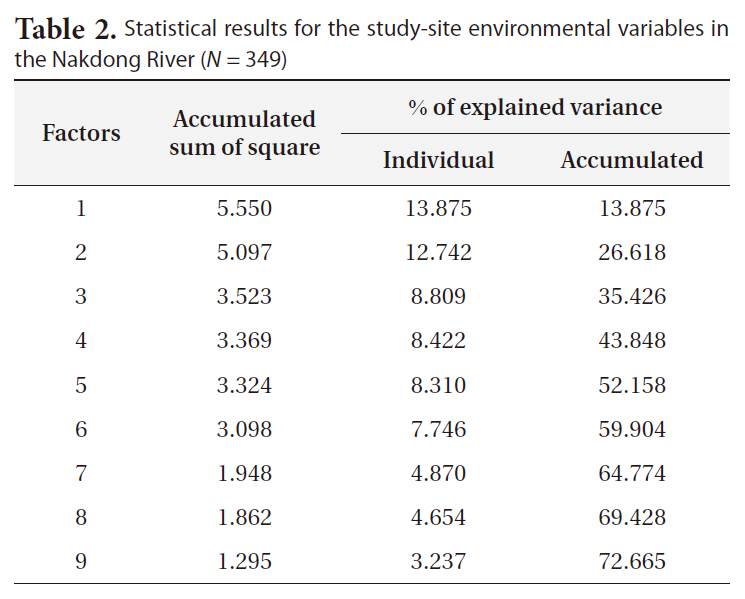
Parameter ordination was performed using 40 physicochemical variables and a FA. The factors were sorted along eigenvalues, and nine principal components with
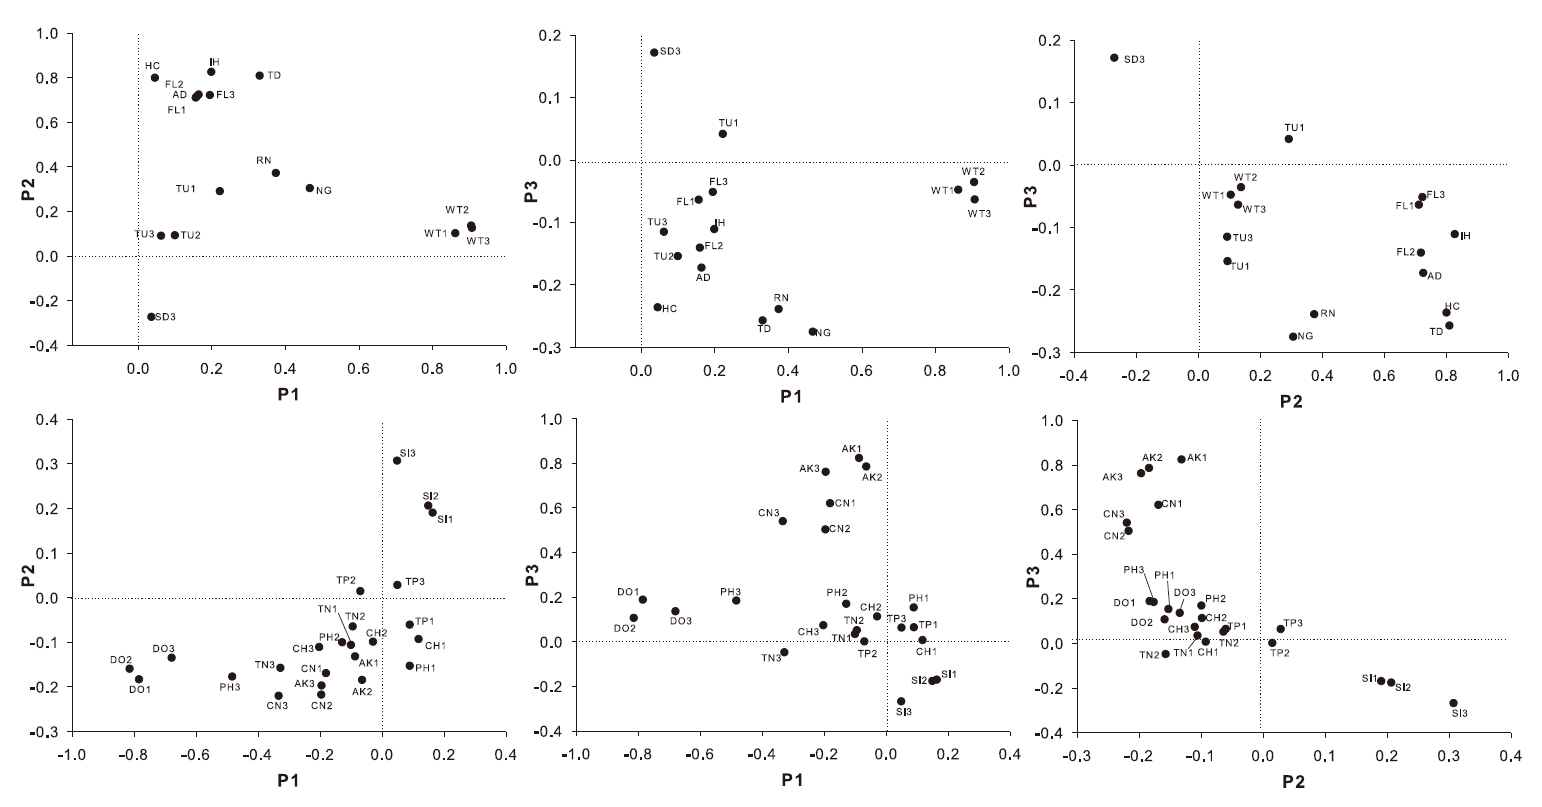
eigenvalues greater than 1.0, which explained approximately 70% of the total variance, were identified (Table 2). Their relationships are illustrated in Fig. 3, particularly for the three primary components with the highest eigenvalues. The same environmental parameters were distributed adjacently on the ordination diagram. Water temperature, DO, and silica concentration showed a similar distribution pattern. Only a few limnological variables separated out from those at the other sites. Most dam discharges were correlated with flow rates for each site. However, the Namgang Dam discharge was an out-

Statistical results for the study-site environmental variables in the Nakdong River (N = 349)
lier. TP did not show any distinctive pattern; however, TN and silica were slightly different at site 3. Furthermore, pH and chlorophyll
As interpreted from the parameter ordination, the first factor showed a high correlation with water temperature and dissolved oxygen. The second factor consisted of the hydrological parameters, rainfall and discharge.
The third factor included conductivity and alkalinity parameters for the three study sites. We defined the factor characteristics as follows: 1) the first factor related to photosynthetic activity, 2) the second factor related to hydrological variations, and 3) the third factor was water stagnancy represented by ion distribution
>
Water flow and limnology in the mid to lower Nakdong River
Limnological factors observed in the Nakdong River exhibited differences between study sites. Although the data were not statistically significant due to the large degree of data complexity, the FA results provided useful information regarding the nature of the limnological parameters. The LTER data showed differences in phytoplankton biomass changes during the study period and also for the site at the lowest reach (i.e., Mulgeum). These differences were due to the elongated residence time of the water in the main channel of the Nakdong River. A clear fresh- and seawater division has occurred since construction of the estuarine barrage (Kwon 1991), and changes in phytoplankton distribution and water quality have been reported (Choi and Park 1986, Doornbos et al. 1986, Moon and Choi 1991, Lee and Kwon 1992, Cho et al. 1993, Chung et al. 1994, Seo and Chung 1994, Joo 1995). The regulation of river flow by dams is responsible for the proliferation of phytoplankton such as cyanobacteria and diatoms (Jeong et al. 2007). The lowest site is directly above the estuarine barrage; therefore, a direct influence due to increased retention time was expected.
Water flow, as represented by dam and river discharge, showed different patterns at the study sites. Water flow at the upper study site (i.e., Waegwan) was not strongly related to photosynthetic activity compared to other sites. This was due to changes in retention time for the study sites. While the flow volume at the upper study sites was not greater than that at the lower study sites, the relatively high water velocity at this site might have inhibited potential phytoplankton growth. Therefore, changes in water quality for the mid to lower Nakdong River were basically governed by changes in water flow, and stagnant reaches, such as the lower reach, created limnological conditions similar to a reservoir.
>
Future of LTER with an understanding of the ecological data and uncertainty
An ecosystem is a very complex and highly nonlinear system. Consequently, the attributes of ecological data are substantially different from data in other areas such as signal processing, financial indices, and digitalized image data. Most ecological data are collected manually, although some parameters have recently been obtained from cutting-edge data loggers. Although automated measuring equipment is being developed, it is very difficult to provide consistent accuracy during data collection due to difficulties maintaining equipment (Shan et al. 2006). It is almost impossible to use automated systems for species identification and tabulation using a microscope, for which observational errors can result in measurement errors. In addition to measurement issues, another issue creating data analysis errors is missing data. Because most surveys and measurements are conducted by hand, missing values typically result from a random variable such as illness, car accidents and holidays (Regan et al. 2002). In field biology, a wide variety of variables is required to understand a particular phenomenon. Therefore, the more variables we include, the greater the risk of error.
Such ecological uncertainty has decreased the accuracy of ecological modeling and analyses. Arhonditsis et al. (2007) stated that highly variable and scarce data may lead to an inaccurate picture of ecosystem behavior during modeling. Another problem is that we cannot readily measure data quality. In particular, ecological data contains internal noise that may cause amplification of errors during analysis.
For this reason, some ecological analyzing methods based on machine learning have recently been applied to forecasting and patterning ecosystem behavior. Machine learning is a powerful tool capable of exploring accurate models through training. Goethals et al. (2007) successfully predicted macroinvertebrate communities in freshwater using artificial neural networks. Kim et al. (2007) elucidated ecological features of diatom blooms based on evolutionary computations. Talib et al. (2007) compared the ecological patterns of phytoplankton dynamics in two different lakes using self-organizing maps. These studies have provided informative research that has attracted many field biologists. Nonetheless, these types of empirical methods mostly require a large volume of data to increase model accuracy (Fielding 1999), which can only be obtained through the LTER programs.
The LTER program commonly generates a large dataset with a large number of variables. To date, ecological data collection, particularly field sampling, has been conducted to specifically investigate peculiar phenomenon over the short term. Thus, the quantity of data was small and data continuity was discrete. This circumstance would limit the ability to reveal historical changes in a desired variable. Change in an ecosystem (e.g., global warming) may occur at time frames exceeding a human lifetime, so extending the time scale is necessary. Additionally, the current environmental problems we face may involve extremely long time frames to adequately analyze and measure change. Therefore, it will be very difficult to extract precise solutions with respect to ecosystem conservation and management without long-term baseline monitoring data. Further, recent ecological issues have considered ecosystem dynamics such as water quality changes with respect to global climate changes. Long-term informative datasets collected by sustainable monitoring program (e.g., LTER) will be indispensable for ecological characterization.
The initiation of the LTER program in Korea in 2004 led to collaborations between domestic ecologists. A very large data information system was provided from fragments of smaller data units. This identifies the potential advantage of a LTER program. In this study, we employed a large volume dataset collected over a 14-year period (N = 349 for each site) to analyze longitudinal patterns in the limnological characteristics of a regulated river ecosystem, the Nakdong River. Significant relationships among measured parameters were spatially described along the river using multivariate ordination. It was established that recurrent algal blooms appeared in the lower part of the river. Data consistency and precision with repeated LTER observations will be helpful for ecosystem management and conservation in the future.