Landscape change is one of the main driving forces of global environmental change and strongly impacts the world’s environmental and landscape attributes (Baker 1995). Rural landscape ecosystems are established through a reciprocal relationship between nature and human impacts (Kamada and Nakagoshi 1996, Hong 1998, 2007, Golley and Bellot 1999, Berkes et al. 2000, Kim et al.2006). Rural landscapes have been influenced by increasing demands for agricultural productivity and efficiency, which caused humans to begin using chemical fertilizers, pesticides, and herbicides, and finally led to changes in agro-forest management strategies (Hietala-Koivu 1999, Fukamachi et al. 2001, Nakagoshi and Hong 2001). Therefore, changes in socio-economic environments affect rural landscape ecosystems and, particularly, secondary vegetation in agro-forests (Hong 1998, van Lier 1998, Pinto-Correia 2000, Nakagoshi and Hong 2001, Croissant 2004, Woodhouse et al. 2005).
The traditional Korean rural landscape known as“Maeul” is an ecosystem composed of high mountains,easy slopes with low mountains, human settlements,plains with agricultural fields, and streams (Lee 2004, Kim et al. 2006, 2007, Hong 2007). The term Maeul means village with forest and stream, reflecting the concept that villages in this traditional rural landscape are united with surrounding forests and streams. Traditional Maeul landscapes mainly consist of
The Korean government established a national land-development program to economically boost rural areas. While this program includes introducing ecotourism and industrial infrastructure into rural areas, it ignores the value that traditional management practices could have to sustain and revive the Maeul landscape. As a result, many of the various ecological functions and integrity in Maeul landscapes are rapidly disappearing.
The management of rural landscapes, such as Korean Maeul landscapes, must include multiple aspects, from both economic and ecological perspectives, to support future landscape planning and management. Researchers can provide the government and farmers with useful information about ecological issues as well as promote sustainable human activities (Hong 2007, Kim et al. 2007). Additionally, long-term ecological studies are necessary to support ecosystem management.
This study considers the effects of land-use changes due to changing socio-economic environments in the Maeul landscape of Korea, because limited information is available on spatial patterns and vegetation structure. We analyzed landscape structures, spatial patterns, and vegetation changes. This study contributes to explaining the relationship between land-use change and forest ecosystems in rural landscapes, which will support the formulation of a basic theory for the planning and sustainable management of these landscapes.
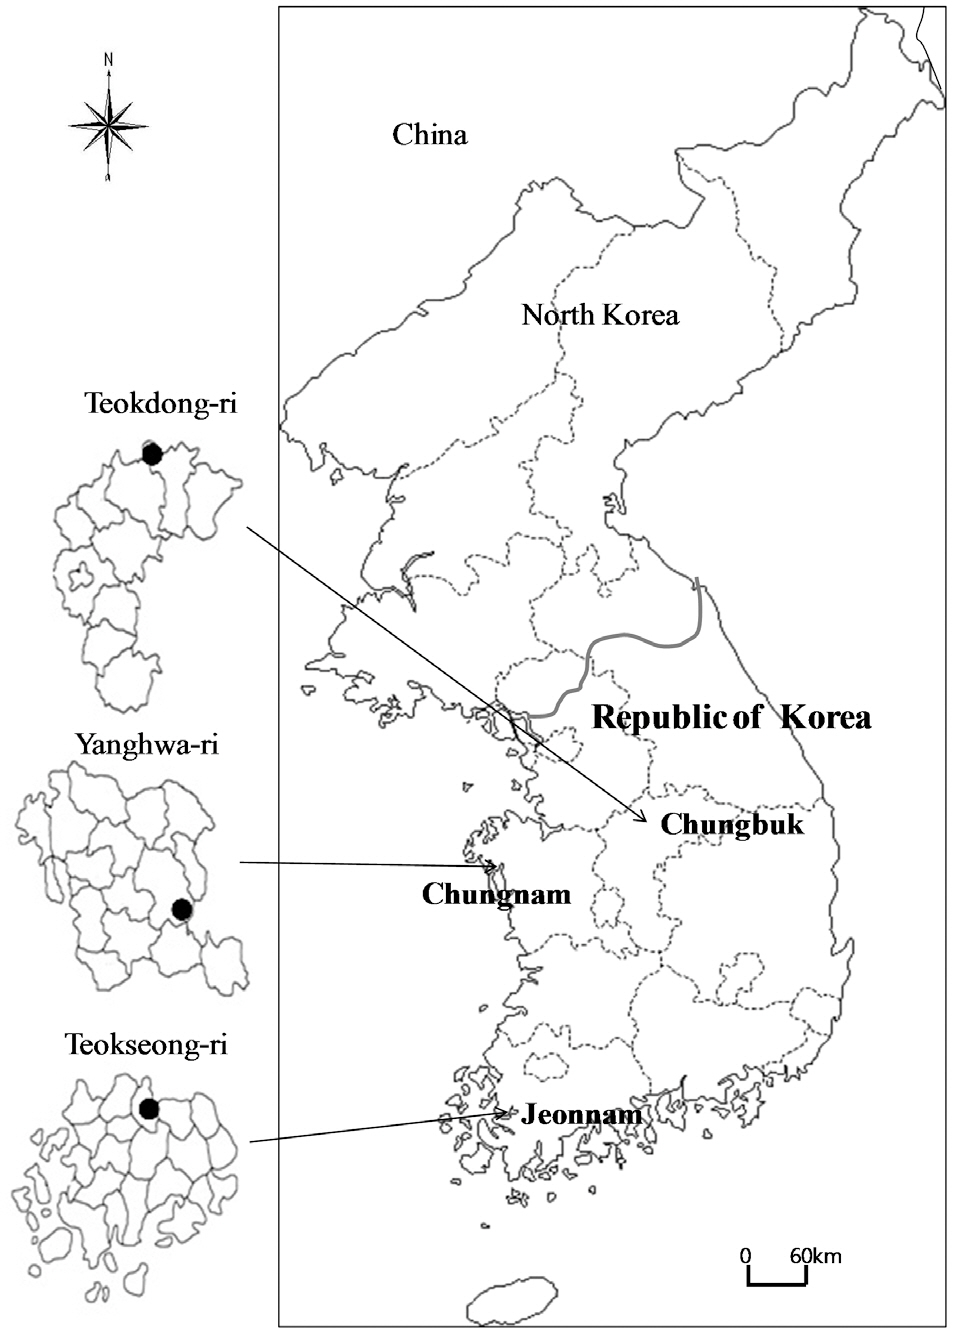
Three sites, Teokdong-ri (TD), Teokseong-ri (TS), and Yanghwa-ri (YH), were selected as typical examples of rural landscapes in Korea (Fig. 1). “Ri” is the smallest ad-
ministrative district unit in rural areas.
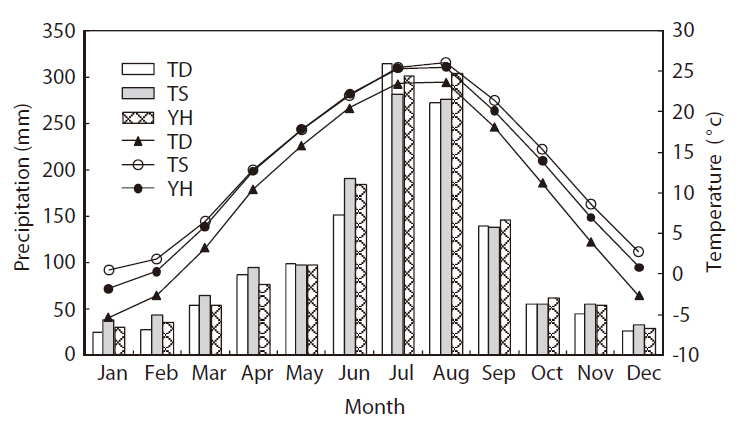
These three study areas belong to temperate mid-latitudinal zones (Shin 2002). The climate on the Korean peninsula is characterized by cold dry winters and hot humid summers. The mean monthly precipitation is concentrated during the summer, from June to August, which accounts for almost half of the annual precipitation (Fig. 2). During the dry winter season, from December to February, the mean minimum temperature at TD and YH is < 0°C. Regarding potential vegetation, all three areas are located in a deciduous broad-leaved forest zone and covered mainly by
Socio-economic environments
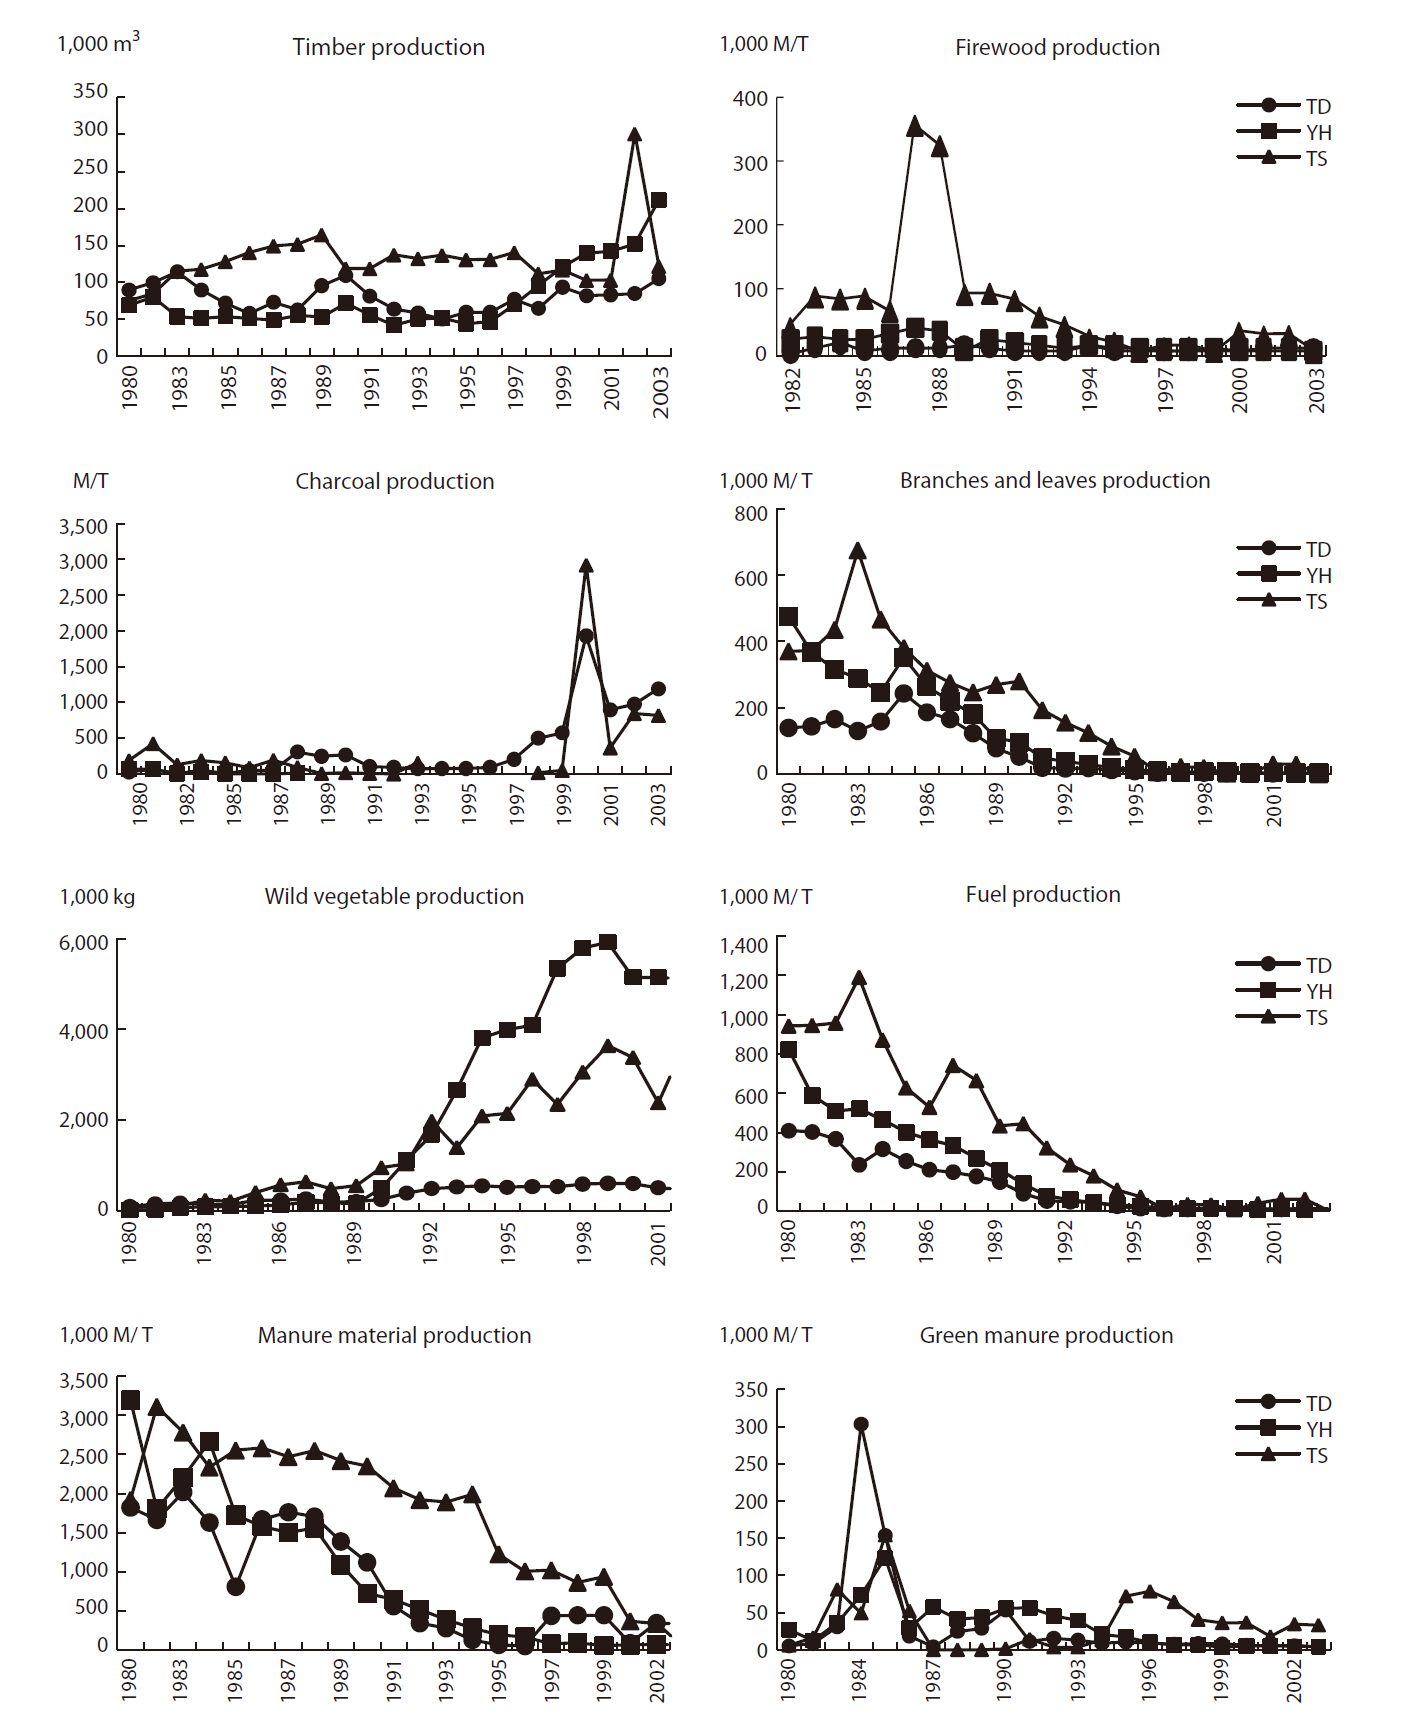
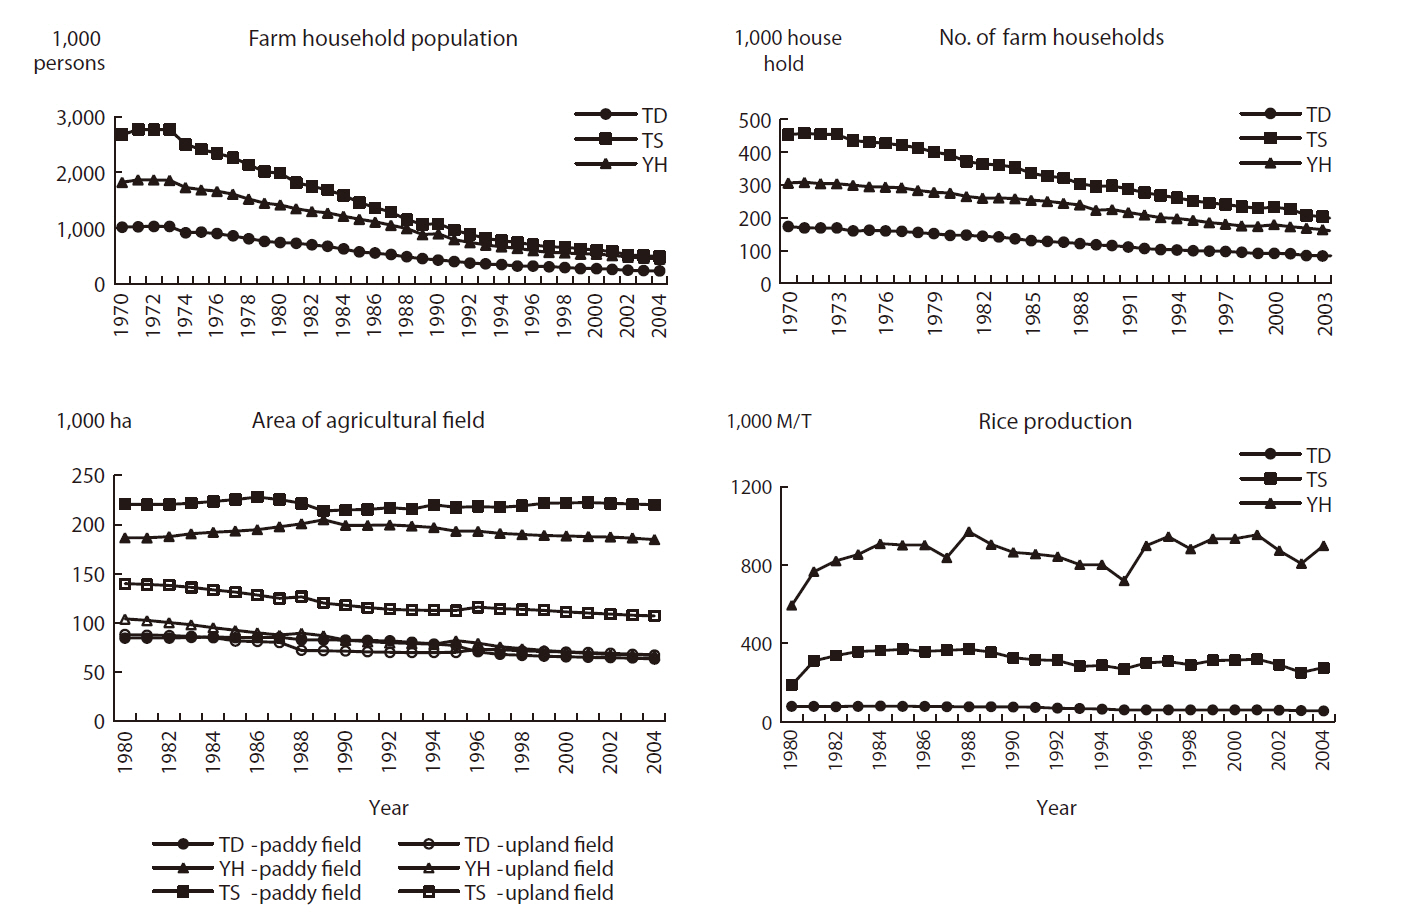
As stated, the socio-economic environment is one of the main driving forces for landscape change and is very important for managing Maeul landscapes. Hence, socio-economic data were obtained for all three study areas. National statistics related to agricultural systems, farm household populations (Fig. 3), and forest products (Fig. 4) were used as background statistical data to understand the socio-economic environment of Maeul landscapes.
>
Landscape pattern analysis: mapping and spatial indices
Landscape ecology research is usually based on interpreting aerial photographs and field survey maps (Turner et al. 1996, 2001). Landscape mapping was performed two times for each area, involving the years 1988 and 2002 for TD and TS and 1992 and 2003 for YH.
Land-use types were divided into natural, introduced, and mixed types, according to the original status of the land. The natural type included secondary vegetation or land use due to natural regeneration, although landscape management may have been employed later.
Spatial characteristics (i.e., pattern, diversity, and heterogeneity) of the landscapes were analyzed with FRAGSTATS spatial statistics (McGarigal and Marks 1995). In particular, spatial indices (i.e., size, number, and patch density) for each land-use type were adopted to understand the relationship among land-use types in land-
scape mosaics.
Landscape indices were applied to measure spatial patterns (McGarigal and Marks 1995, Hietala-Koivu 1999, Turner et al. 2001). Mean patch size (MPS) was used as a habitat fragmentation index. Mean patch edge (MPE) in edge metrics was used as an habitat indicator, such as habitats for edge species.
Patch shape complexity was measured using the area-weight mean shape index (AWMSI) and the area-weight mean patch fractal dimension (AWMPFD). Both AWMSI and AWMPFD are used to compare changes in the shape of landscape mosaics and to show patch shape by patch area and perimeter. Both indices were used as wildlife habitat indicators when the patch shape was more natural, i.e., has more complicated boundaries as the value increases (Turner et al. 2001, Moser et al. 2002). AWMSI and AWMPFD are more suitable than the mean shape index and the mean patch fractal dimension when only a few land-use types are dominant (McGarigal and Marks 1995), as is the case for the sites studied here.
All land-use types were identified and their number and size were measured by spatial statistics.
>
Field survey, plant life-form analysis, and vegetation dynamics
Field surveys were conducted to assess plant community structure at each study area. These were conducted in August, when the land-use mapping was performed. Permanent quadrat plots (10 × 10 m2 in tree layers, 5 × 5 m2 in herb layers) were set in 1988 for TD and TS and in 1992 for YH, and the coverage and abundance of each species were measured. The second surveys were carried out in 2002 and 2003 at the same locations as the previous survey. Species names were used according to Lee’s (1996) illustrations. All 152 plots and all vascular plants were surveyed by the Braun-Blanquet (1964) method and arranged by table, which is the general approach for analyzing vegetation structure.
Plant life form is an indicator of ecosystem function (Walker and Langridge 2002), so it may explain changing landscape ecosystems through time in rural forests. Raunkiaer’s life-form system was introduced to consider the degree of forest development and structure (Nakagoshi et al. 1992). Therefore, life-form data were used as qualitative community data, whereas relative species richness and species diversity were used as quantitative data. Species diversity was measured by the Shannon-Wiener diversity index (Sa?d 2001). Relative species richness and species diversity of each life form explains different ecosystem environments (Sa?d 2001).
Communities were defined by homogenous physiognomy and confirmed using the phytosociological procedure (Braun-Blanquet 1964). Each plant community was identified by identifying the dominant species. Forest structure community characteristics and species composition are simultaneously shown on the land-use map. Morisita’s similarity index, Cλ(p), which explains the inter-stand similarities (Morisita 1959), was used for this community analysis. This index is calculated based on floristic composition and coverage.
Principle component analysis (PCA), based on the vegetation similarity index, was conducted to understand vegetation dynamics and community characteristics. Moreover, PCA ordination (PC-ORD ver. 4.01; MjM, Gleneden, Beach, OR, USA) was applied to estimate vegetation changes on a spatio-temporal scale. Ordination is a collective term for the multivariate techniques that arrange sites along axes based on species composition data (Jongman et al. 1995). This means that the vegetation arrangements in relation to each other (similarities in species composition and/or their associated environmental gradients) indicate community characteristics in a rural forest.
A regression analysis was conducted to understand the relationships between changing spatial patterns and qualitative communities in the rural forest. Landscape indices were used to indicate landscape structure characteristics, particularly spatial patterns in rural landscapes, and also species diversity, given that each type of plant life form indicates the status of a rural forest ecosystem.
>
Landscape structure and socio-economic environment
From the mid 1970s, the farm household population and the number of farm households decreased gradually in all three study areas (Fig. 3). The main reason for this is that people moved to surrounding large cities to increase their standard of living. This was most severe at TS, which saw its population decrease by more than half. The farm household population at all three study areas decreased most abruptly from 1970 to 1990. After that, the decreases slowed, because rural regions began to develop ecotourism beginning in 1988 and the speed of economic development across the country slowed.
Forest production showed decreasing trends, except for timber, charcoal, and wild vegetables (Fig. 4). At TD,
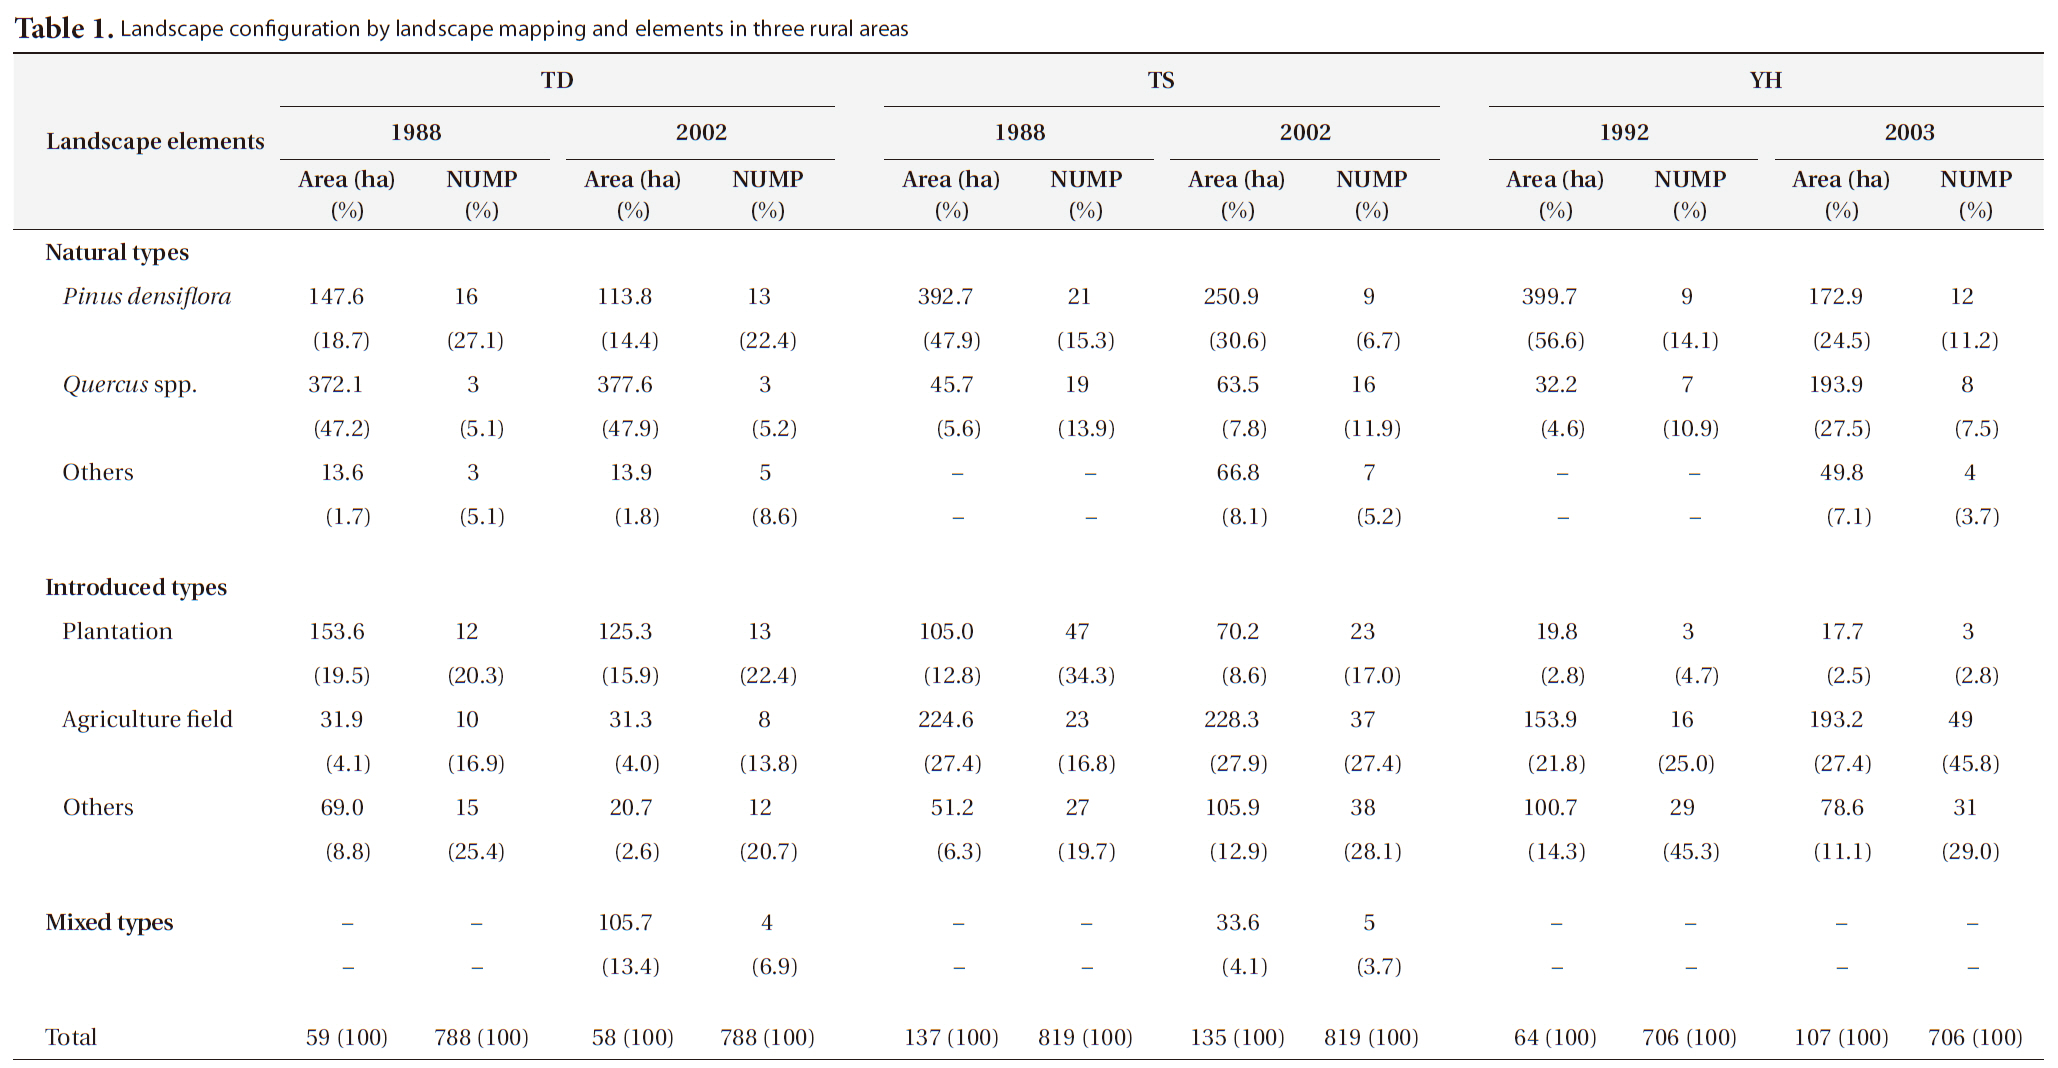
[Table 1.] Landscape configuration by landscape mapping and elements in three rural areas

Landscape configuration by landscape mapping and elements in three rural areas
the national and public land ownership was nearly 61% (6,820 ha) of the total forested area (11,186 ha), whereas forestry for timber and fuel production was the main economic activity. In contrast, the other two study areas had mainly privately owned land, with nearly 95% (2,291 ha) of the 2,400 ha of forest at TS and nearly 89% (58,867 ha) of the 65,871 ha of forest at YH.
The area and number of
The area and number of plantation patches decreased at all three study areas. Agricultural field area, including paddy fields and upland fields, decreased slightly at TD
[Table 2.] Configuration of spatial patterns by study area and year
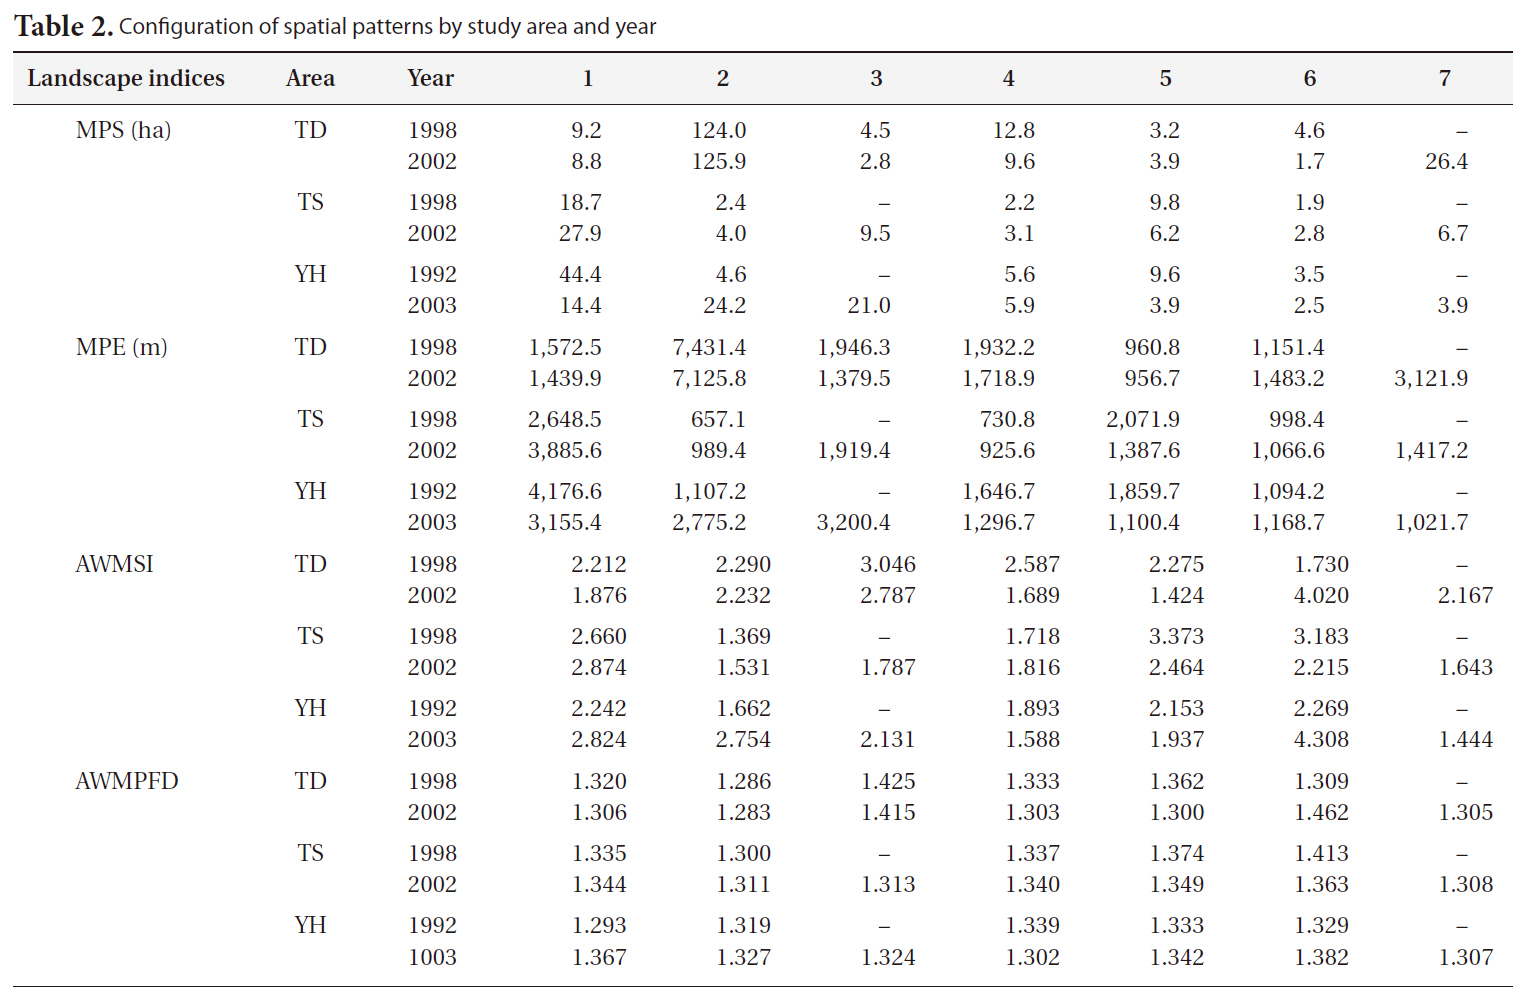
Configuration of spatial patterns by study area and year
from 31.9 ha (4.1%) to 31.3 ha (4.0%), whereas it increased at both TS and YH. Actually, in the latter two cases the paddy field area decreased but upland fields increased to a larger extent from 53 ha (6.5%) to 68.4 ha (8.4%) at TS and from 9.7 ha (1.4%) to 87.7 ha (12.4%) at YH. The area of other introduced land-use types decreased at TD and YH, whereas it increased at TS.
The landscape indices MPS, MPE, AWMSI, and AWMPFD were used to analyze spatial patterns. The MPS of
>
Vegetation and plant life forms
The 424 species identified by the phyto-sociological data were surveyed in 1998 and 2002 for TD and TS and in 1992 and 2003 for YH.
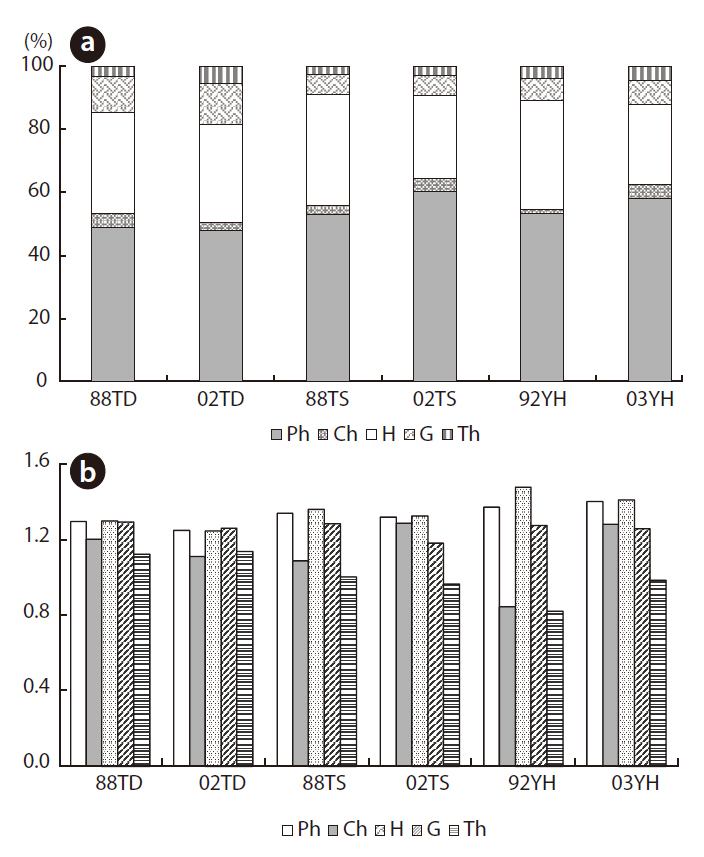
Five types of plant life forms were distinguished: phanerophytes, chamaephytes, hemicryptophytes, geophytes, and therophytes. Fig. 5a shows the relative species richness of these life-form types for each year and study area. The main life-form type in all study areas was phanerophytes (> 45% in each year) and hemicryptophytes (> 25% in each year). This means that mainly tree species and perennial herb species occurred in all study areas.
The species diversity of the given life-form types is shown in Fig. 5b. Therophyte species diversity increased from 1.375 to 1.404 at YH, whereas it decreased at the two other areas. Chamaephyte diversity increased at TS and YH but not at TD. Hemicryptophytes diversity decreased in all study areas.
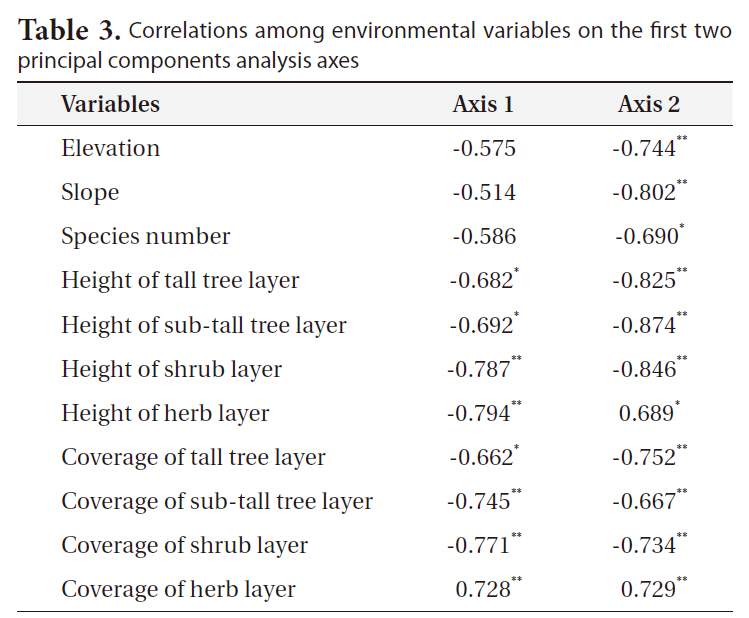
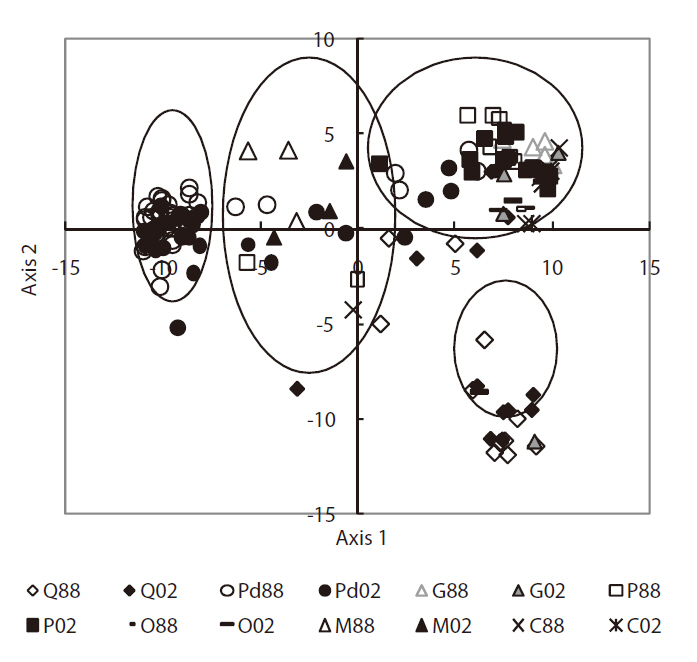
Phytosociological data were analyzed by means of PCA ordination using the interstand similarity index of Morisita (1959) to elucidate community characteristics (Fig. 6). The correlation coefficients of the environmental variables on the first two PCA axes (Table 3) indicated that axis 1 (eigenvalue, 0.68) was negatively correlated with herb layer height. Axis 2 (eigenvalue, 0.17) was negatively correlated with sub-tall tree layer height. Based on the scatter pattern, community distribution could be divided into four groups. Group 1 consisted of only

Correlations among environmental variables on the first two principal components analysis axes
with
cutting sites, which were strongly disturbed by human activities. Group 4 consisted of mainly Q
>
Relationship between spatial pattern and life form
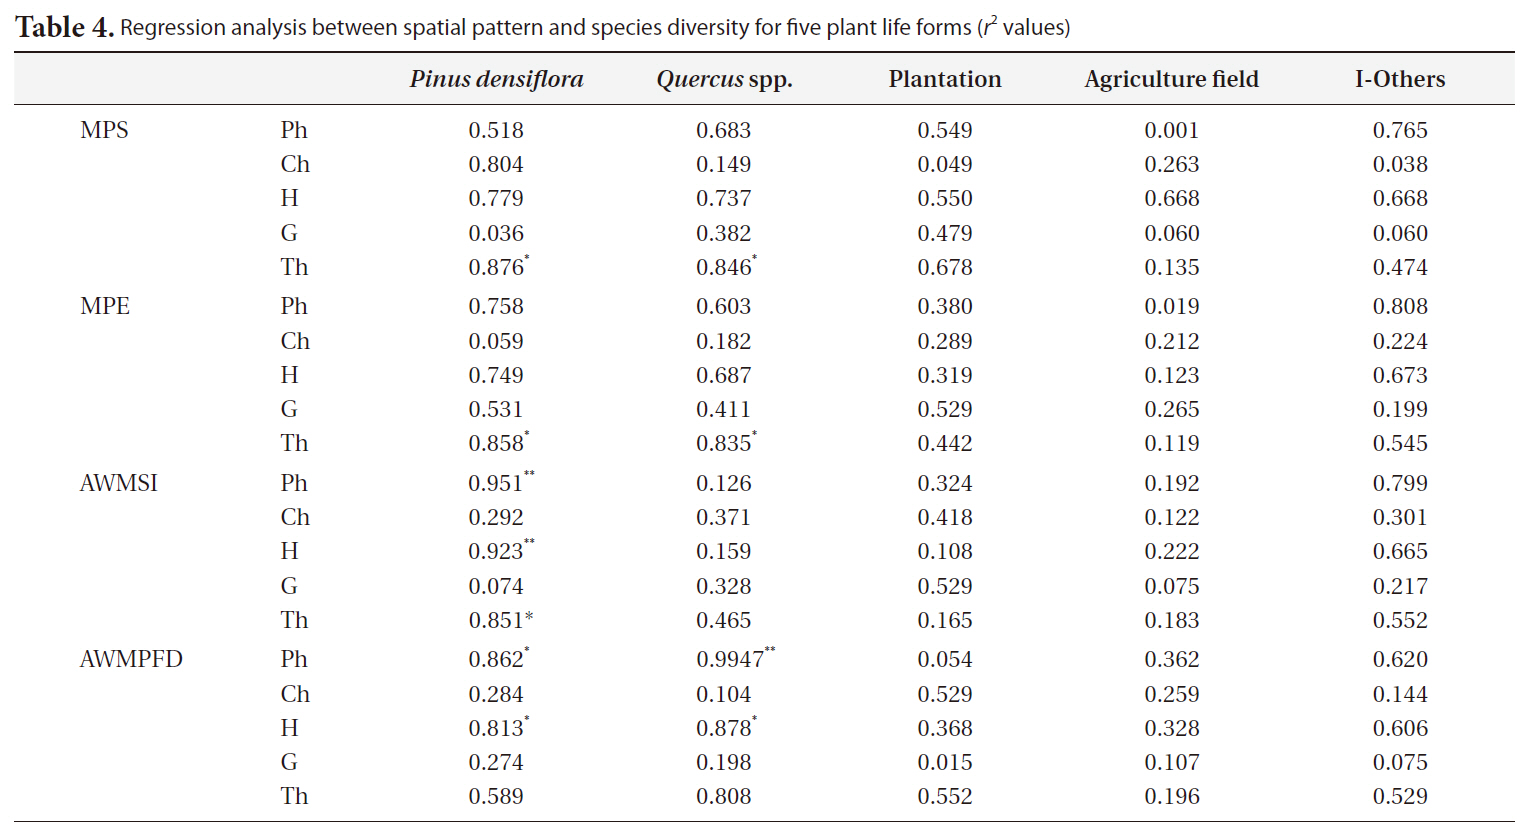
The relationship between spatial pattern and species diversity for each life form was examined by regression analysis by interpreting the

Regression analysis between spatial pattern and species diversity for five plant life forms (r2values)
>
Changing rural landscape and human activities
The three study areas have undergone significant changes due to depopulation and the effect of an aging population. These trends have been caused mainly by residents moving to surrounding bigger cities to increase their standard of living. The agricultural field area showed a decreasing trend in all study areas, but rice production increased at TS and YH, whereas it decreased only slightly at TD (Fig. 3), indicating a higher degree of agricultural efficiency at TS and YH. The main agriculture type in these areas used to be rice paddy fields, but the proportion of upland fields seemed to increase steadily. This was also influenced by political issues, as the opening agricultural production markets, particularly for rice, has not been highly competitive (Lim and Cho 2004). Hence, changes in the socio-economic environment are leading to changes in the Maeul landscape.
However, trends in forest production such as timber, firewood, charcoal, branches and leaves, fuel, wild vegetables, and manure production illustrate the forest management culture. Due to economic development, forest production has generally decreased because of a modfuel revolution and changes in agricultural materials (Kamada and Nakagoshi 1996, Hong 1998, Kim et al. 2006). Only the production of charcoal and wild vegetables has increased. In the case of charcoal production, Korean people enjoy grilling meat with charcoal, particularly that produced from oak trees (Fig. 4) and this has become popular at restaurants. Wild vegetable production increased from the 1990s when people began to adopt habits to improve their health and well-being. Korean people consider wild vegetable consumption good for their health, so as consumption increased production increased. Thus, human cultural impacts have influenced forest production. Moreover, these cultural activities support the rural forest ecosystem and help to control the natural regeneration of habitats.
Maeul landscapes in Korea mainly consist of secondary vegetation such as P. densiflora and deciduous oak. In particular,
>
Relationship between spatial heterogeneity and vegetation structure
Five types of flora life forms were distinguished: phaneorphytes, chamaephytes, hemicryptophytes, geocryptophytes, and therophytes. Species diversity decreased for each life form, except for therophytes at TD and chamaephytes at TS (Fig. 5). The annual and biannual plant species habitats at TD may improve. At TS, the habitats may also improve for small shrub species. However, species diversity at YH increased, except for geocryptophytes and hemicryptophytes. Given the PCA ordination outcome, the increase in tree and small-shrub species diversity may indicate that natural succession occurred at YH. Moreover, fluctuations in species diversity and relative species richness over time might, to some extent, be a response to the complexity of the relationship between the vegetation and the environment.
The scatterplot patterns for the PCA ordination revealed four groups (Fig. 6). Group 1 had two directions; one going to group 3 representing forestry human activities and another was directed towards group 4, which represented natural succession. Group 2 formed a middle stage in terms of vegetation dynamics. The
The regression analysis between spatial pattern and species diversity showed the relationship between
>
Management strategy for rural forest landscape conservation
Rural landscapes are usually located between urban areas and mountainous forests. This location provides them a role as an ecotone ecosystem, which can moderate the human impacts from city areas (Forman 1995). As mentioned, traditional human activities in rural landscapes are interrelated with forest ecosystems. Rural-living Koreans have traditionally depended on the Maeul landscape for daily life and agriculture (Hong et al. 1995, Hong 1998, Kim et al. 2002). They would cut branches and trees and collect fallen leaves for fuel, timber, and fertilizer. These human activities affect light conditions, soil moisture, and litter depth, and, as such, they control the rural forest ecosystem in a way that is similar to natural regeneration. Therefore, both floral and faunal species can use the Maeul landscape as a habitat (Washitani 2003).
The current Maeul landscape in Korea is confronted by various changes in the socio-economic environment, such as human depopulation, agricultural efficiency, and an aging population, which influence secondary vegetation (Hong 1998, Nakagoshi and Hong 2001, Turner et al. 2001). The deterioration of the Maeul landscape is further accelerated by vegetation dynamics as well as changes in habitat.
Changes in the socio-economic environment, such as industrialization, urbanization, and farm mechanization influence rural landscapes when they lead to a decrease in traditional human activities and a change in land use (van Lier 1998, Oreszczyn 2000, Hong 2001, Takeuchi 2010). Abandoned rural landscapes lose their interrelationship with humans and are then solely influenced by the rural forest ecosystem. Habitats will be directly affected without dark forest thinning and litter collections. Hence, abandonment may disturb natural regeneration and this could influence rural landscape biodiversity.
The relationship between biodiversity and spatial patterns in Maeul landscapes is considered to develop sustainable rural-landscape management practices. Moderate human impacts may support rural-landscape biodiversity when spatial patterns are carefully controlled (Solon 1995, Hong 2001, Croissant 2004). Furthermore, land-use strategies regarding spatial patterns should account for their influence on ecosystem function (Reenberg and Baudry 1999, Bogaert and Hong 2004).
Finally, the findings of this study provide important information for sustainable landscape planning and management of the Maeul landscape as Korean traditional rural landscape in the future. Furthermore, it is concluded that traditional human activities, particularly in rural secondary forests, which control forest succession and biodiversity, will be required to maintain the heterogeneity of vegetation communities and spatial patterns over time. Moreover, sustainable rural-landscape planning and management require multi-disciplinary approaches given the inherent complexities of rural landscapes.