Carbon (C) and nitrogen (N) return via litterfall is the primary mechanism that transfers fixed C and N into forest ecosystem soils (Baker et al. 2001, Berg and Laskowski 2006, Hansen et al. 2009). However, the inputs of C and N by litterfall depend on several ecological factors and forest management activities such as forest type, climate, site quality, stand increment, stand age, stand density, fertilization, thinning (Pedersen and Bille-Hansen 1999, Berg and Laskowski 2006, Inagaki et al. 2008, Kim et al. 2009), and forest disturbances such as fire and the incidence of insect pests and disease (Morehouse et al. 2008, Clark et al. 2010, Lorenz and Lal 2010). Disturbances such as defoliation or the killing of trees by forest insects or disease may result in changes in litterfall input to the forest floor because of reduced litter production from trees(Morehouse et al. 2008). Additionally, forest insects and disease can have large effects on the C and N cycles by reducing leaf area and by killing or removing trees (Morehouse et al. 2008, Lorenz and Lal 2010).
Pine wilt disease caused by the pine wood nematode,
The incidence of pine wilt disease in natural pine stands can affect the total amount of litterfall, and is likely to modify C and N input by litterfall, because litterfall production may decrease by removing infected trees. However, the change in litterfall input following a disease incident has received little research attention in Korea. The objectives of this study were to quantify the impacts of pine wilt disease on litterfall C and N status in red pine stands suffering from varying degrees of damage due to pine wilt disease.
The study site was located in Jinju City, which is the most severely damaged pine wilt disease area in Korea (Shin and Han 2006) since the disease outbreak in 1998. The average annual precipitation and temperature in this area are 1,490 mm/y and 13.1°C, respectively. This study was conducted in about 40-year-old natural red pine stands (35°1221" N, 128°10′24" E, 150 m) in the Wola National Experimental Forest administered by the Southern Forest Research Center, Korea Forest Research Institute. The soil was slightly dry, dark-brown forest soil (Inceptisol, United States Soil Classification System) originating from sandstone or shale with a silt loam texture. The dominant pine tree site index indicated low forest productivity (site index, 8 at 20-year-old base age).
Nine red pine plots with varying degrees of damage from pine wilt disease (Table 1) were established on the same facing slopes and aspects and under a similar envi-
[Table 1.] Stand characteristics at the study site
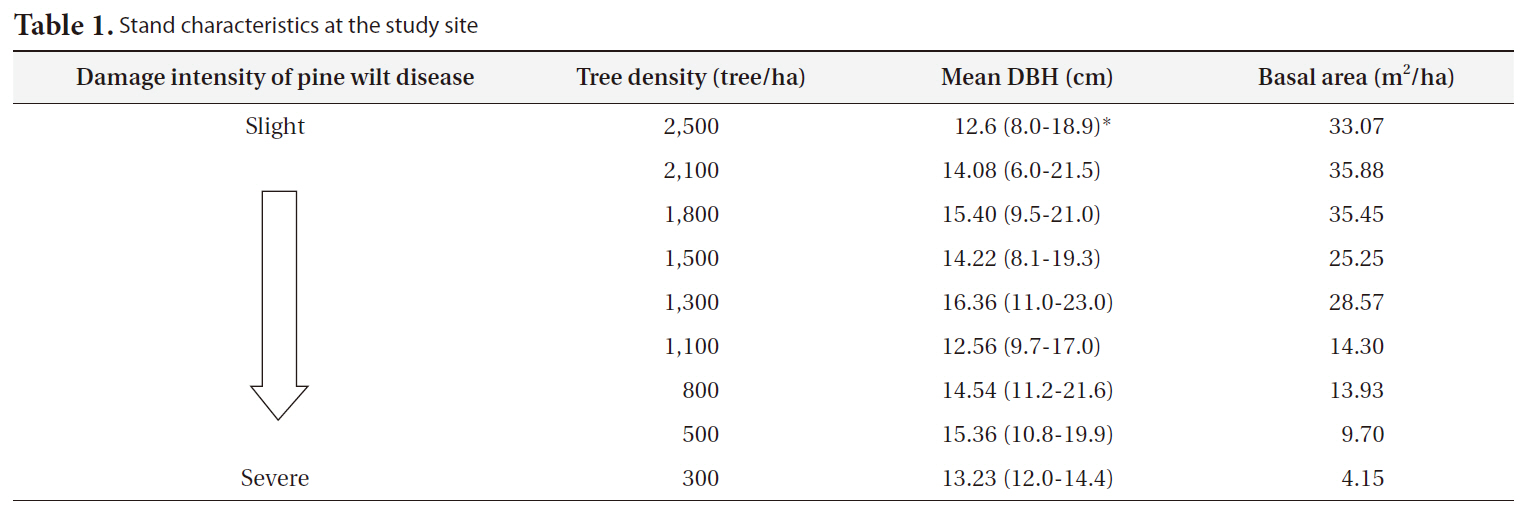
Stand characteristics at the study site
ronmental condition to minimize spatial variation in soil properties. The forest included different degrees of damage because selective cutting of the infected and dead pine trees was implemented on a small scale. The experimental design consisted of 10 × 10-m plots, which were identified based on homogeneity between the sites. Tree densities ranged from 2,500 trees/ha (slightly damaged plot) to 300 trees/ha (severely damaged plot). The mean diameter at breast height (DBH) was highest (16.36 cm) at 1,300 trees/ha and lowest (12.56 cm) at 1,100 trees/ha, whereas stand basal area was highest (35.88 m2/ha) at 2,100 tree/ha and lowest (4.15 m2/ha) at 300 tree/ha (Table 1). The understory tree species were
To measure litterfall input in the plots with different degrees of damage due to pine wilt disease, three circular litter traps, with a surface area of 0.25 m2, were installed 60 cm above the forest floor at each plot (total, 27 litter traps). Litter was collected seven times (July 27, September 18, October 22, November 18, December 23, 2009; March 28 and May 20, 2010) between May 29, 2009 and May 20, 2010. Litter from each trap was transported to the laboratory and oven-dried at 65°C for 48 h. All dried samples were separated into needles, bark, cones and flowers, branches, and miscellaneous components, and each portion was weighed. The litter samples collected for the fall (October-December) and spring (March-May) were ground in a Wiley mill, so they would pass through a 40-mesh (0.425 mm) stainless steel sieve. Carbon and N concentrations from the ground materials were determined using an elemental analyzer (CE Instruments EA1110 Elemental Analyzer; ThermoQuest Italia, Milan, Italy). Total C and N inputs by litterfall components for 1 year (May 2009-May 2010) at the different pine wilt diseased plots were calculated by multiplying each litterfall component by the C and N concentrations.
All data were analyzed to examine the linear regression relationship between C and N status of the litterfall components (i.e., needles, branches, bark, cones and flowers, miscellaneous, and total litterfall) and the damage intensities due to pine wilt disease. A correlation coefficient analysis was performed between the litterfall components and stand characteristics (SAS Institute Inc. 2003).
>
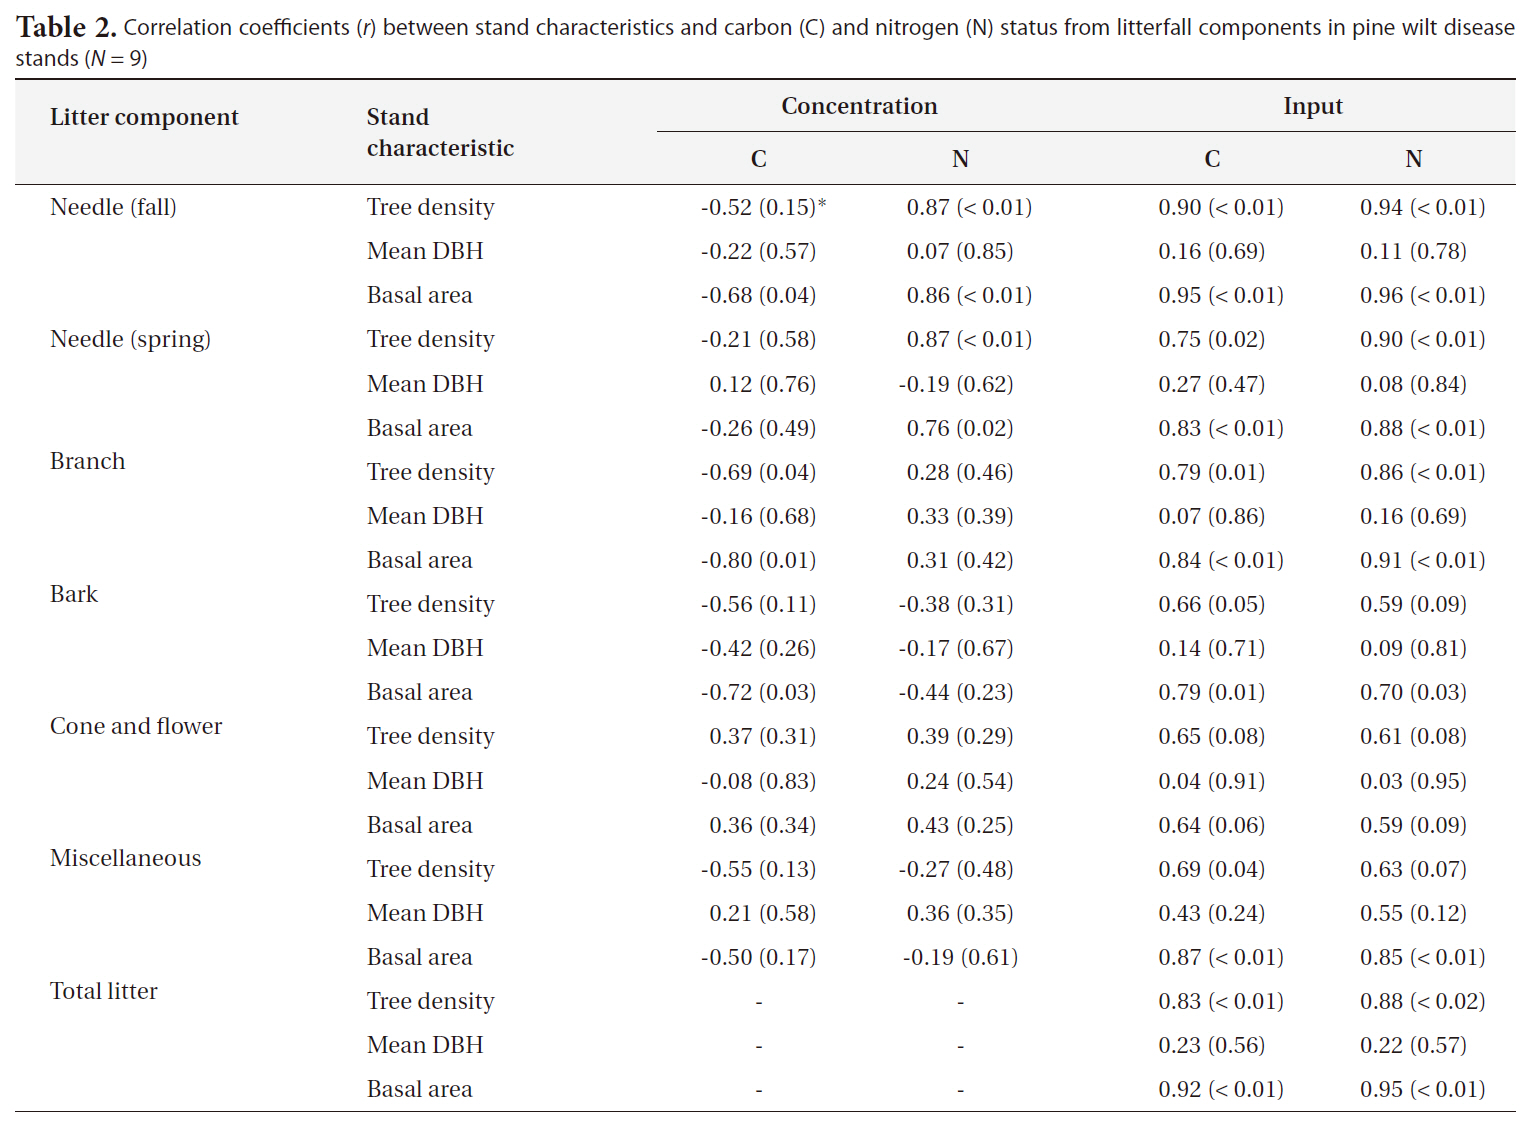
Relationships between C and N status of the litterfall components and stand characteristics
A significant correlation was found between tree density and basal area and the C and N status of litterfall

Correlation coefficients (r) between stand characteristics and carbon (C) and nitrogen (N) status from litterfall components in pine wilt disease stands (N = 9)
components, except for the C concentration of needle litter (spring), cones and flowers, and miscellaneous litter (Table 2). However, the C and N status of litterfall components was not correlated with mean DBH, because no significant correlation was found between mean DBH and tree density (
>
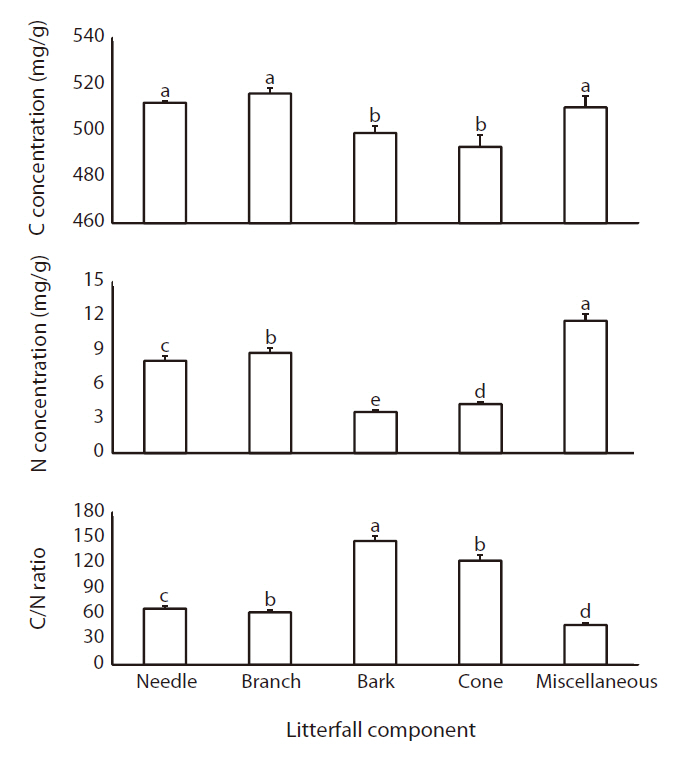
Carbon and N concentrations of litterfall components
Mean C concentration was significantly higher in needle (512 mg/g), branch (516 mg/g) and miscellaneous litter (510 mg/g) than in bark (499 mg/g) or cone and flower (493 mg/g) litter (Fig. 1). Low C concentration in the bark and cone and flower litter was attributed to the differences in chemical compositions of these woody materials
(Bert and Danjon 2006). Similarly, C concentration varies significantly among tree components (Bert and Danjon 2006, Zhang et al. 2009). The C concentration of needle litter observed in this study was comparable to that of needle litter (510 mg/g) in a 43-year-old red pine plantation in Gyeongnam province, Korea (Kim et al. 2010b).
The most remarkable N concentration result was the high N concentration in miscellaneous litter (11.6 mg/g), which was significantly (
The C/N ratio, which is the most widely used litter quality index, was significantly different among litterfall components. The ratio of bark (146) and cone and flower (123) litter was significantly higher than that of needle (66), branch (61), and miscellaneous (47) components (Fig. 1). Bark or cone and flower litter with low N concentrations and a high C/N ratio could be due to the accumulation of recalcitrant constituents such as lignin and tannin.
>
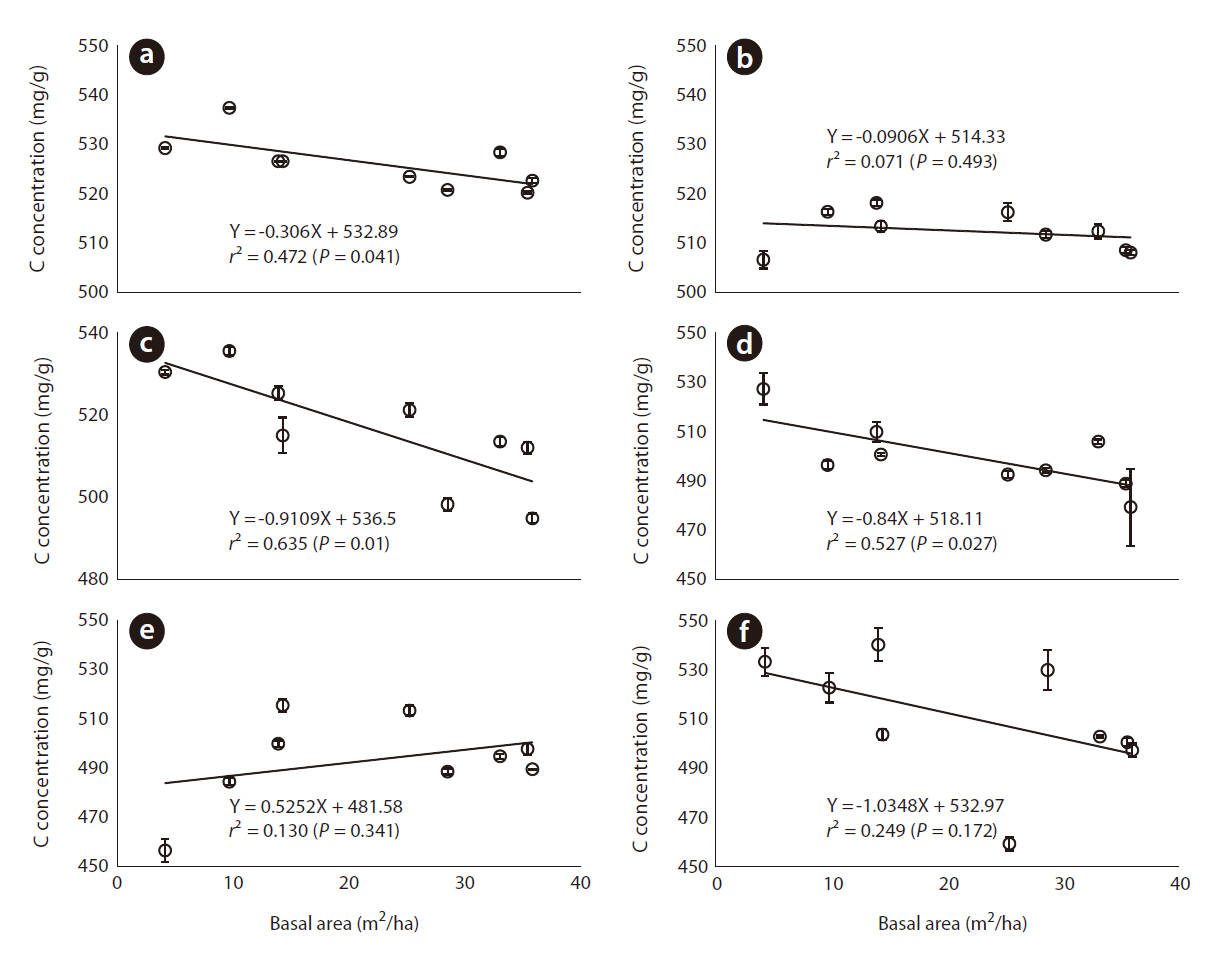
Litterfall C and N concentrations in the pine wilt disease stands
The C concentration of needle (fall), branch, and bark litter was linearly related (
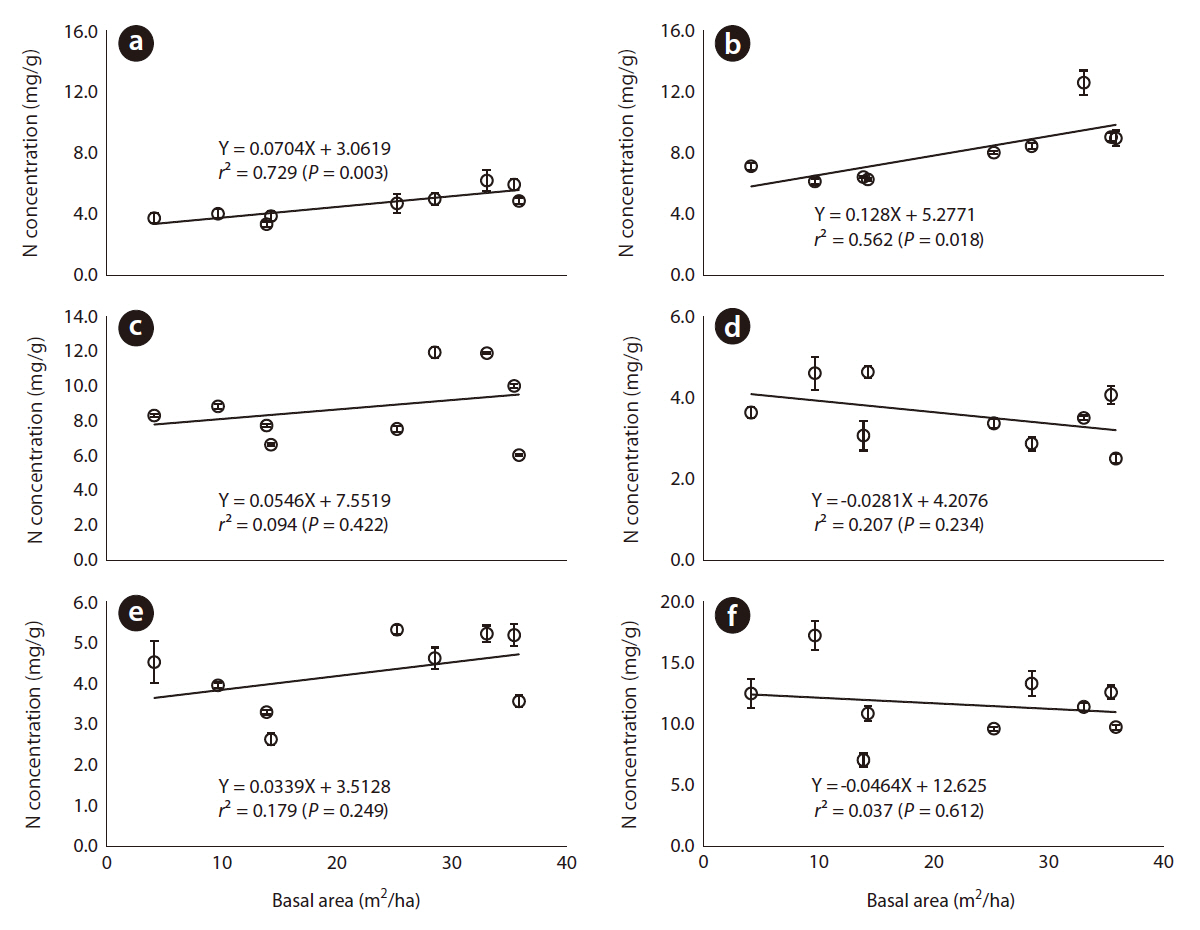
The N concentration of needle and branch litter was also related to basal area in the pine wilt disease stands, whereas the N concentration of other litter components such as branch, bark, cone and flower, and miscellaneous litter was not affected by the basal area of the pine wilt disease stands (Fig. 3). The N concentration in needle litter decreased with a decrease in basal area, indicating low N availability (Inagaki et al. 2008) in severely damaged plots. The N concentration in needle litter was associated with soil N status at the sites (Hansen et al. 2009).
>
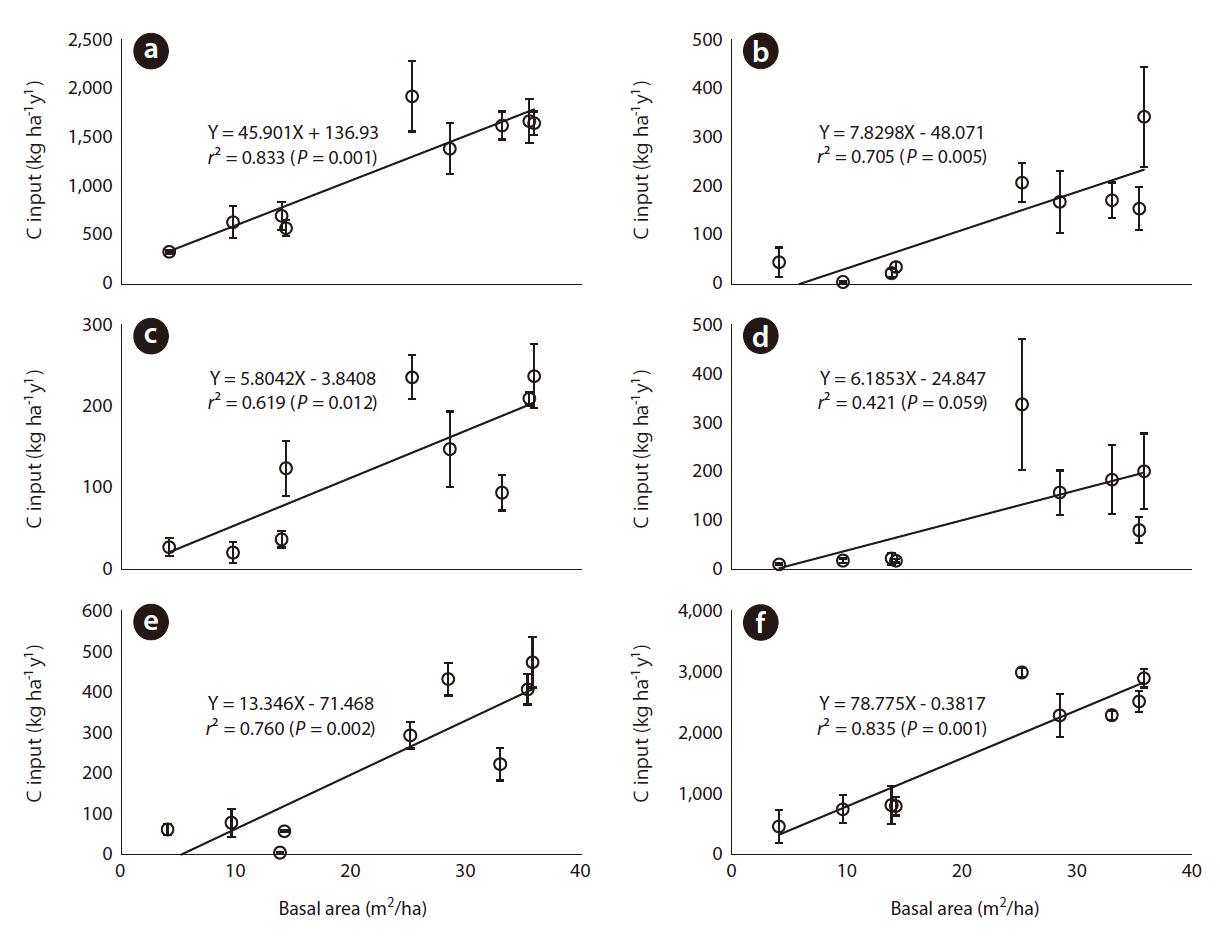
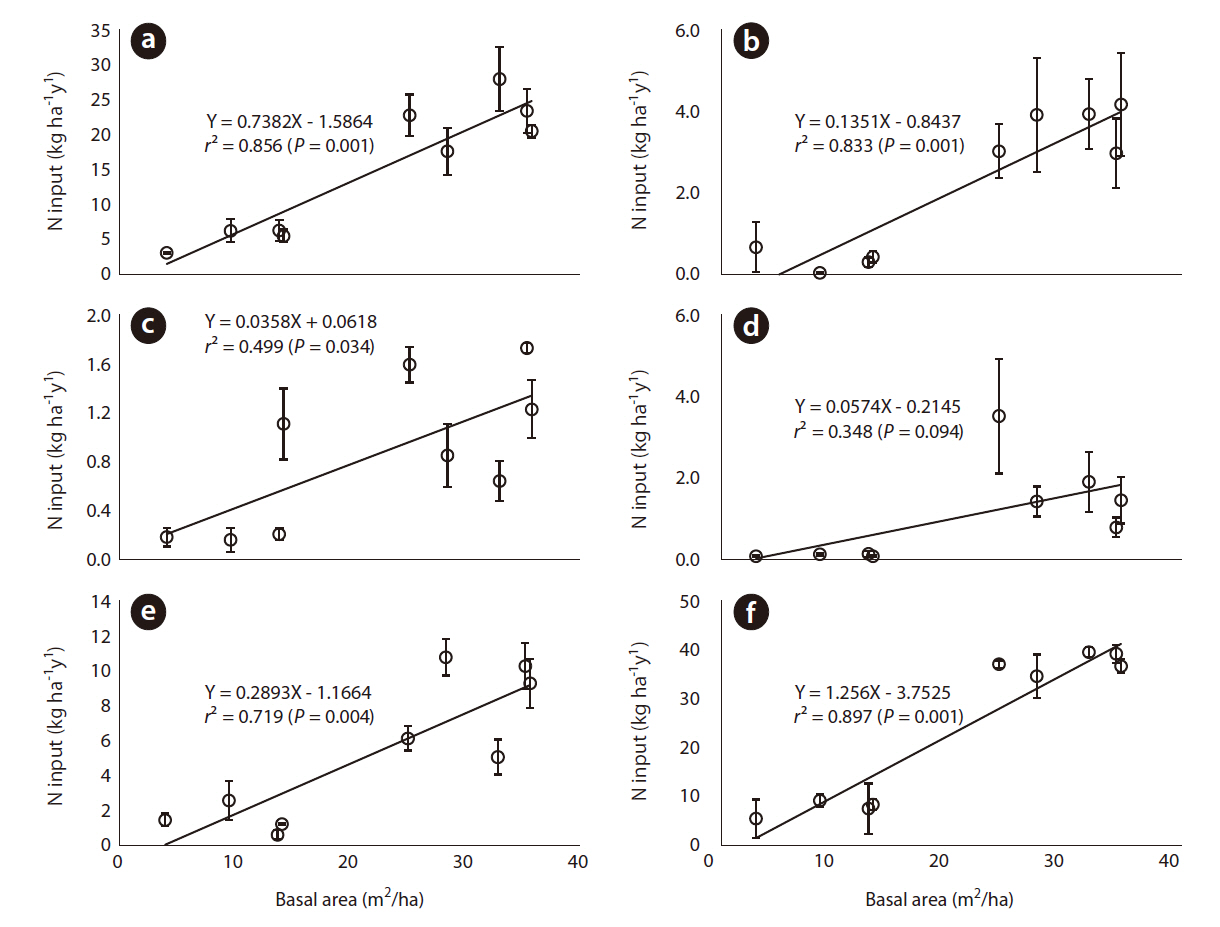
Carbon and N inputs from litterfall in the damaged pine wilt disease plots
The linear regression equations developed for C inputs of the litterfall components were significant (
damaged plots would be expected to have greater C input from needle litterfall compared with that in severely damaged plots.
The mean C inputs from needle litter ranged from 1,918 kg C ha-1 y-1 for slightly damaged plots (2,100 trees/ha) to 319 kg C ha-1 y-1 (300 trees/ha) for severely damaged plots during the study period. The C input from needle litter in the slightly damaged plots was similar to that in a 43-year-old red pine (1,976 kg ha-1 y-1) plantation in Gyeongnam province, Korea (Kim et al. 2010b). Although the needle-litter C inputs could be regulated by physiological responses, such as resource allocation between woody and photosynthetic components (Berg and Laskowski 2006), needle-litter C input remained in the basal area of the needle litter in plots with varying degrees of damage. The C input from branch and bark litter was also linearly related to the degree of damage caused by pine wilt disease (Fig. 4), although wood litter inputs could be affected by environmental factors, such as storms or strong winds, rather than the difference in basal area of stands (Christensen 1975). However, C input from cone and flower litter was not affected by pine wilt disease because of the high variation in spatial input for this litter type. The mean C input for all litterfall ranged from 2,284-2,991 kg C ha-1 y-1 in the slightly damaged plots to 458-792 kg C ha-1 y-1 in the severely damaged plots due to reduced litterfall input in response to tree removal.
Nitrogen inputs decreased with an increase in damage intensity from pine wilt disease (Fig. 5), except for the cone and flower litter. The best fits with the highest coefficients of determination (
>
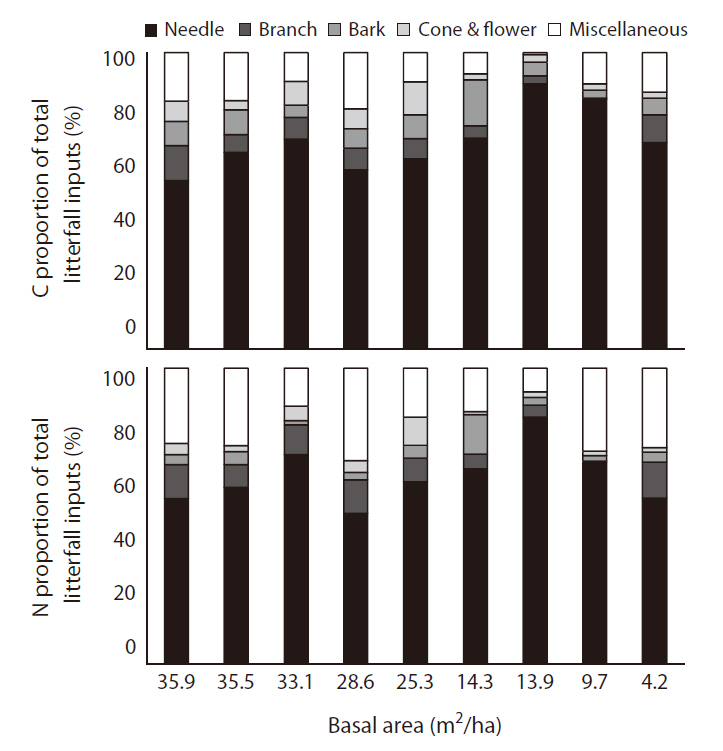
Proportion of C and N in litterfall at the damaged pine wilt disease stands
Carbon input from needle litterfall was the major component of total litterfall C, accounting for about 56.8% (2,100 trees/ha) of total litterfall in the slightly damaged plot and 89.5% (800 trees/ha) in the severely damage plots
(Fig. 6). In most plots, the needle fraction accounted for 60-71% of the total, whereas other litterfall components were < 20%. No trend was observed between basal area and the proportion of C inputs by litterfall components. The order for the proportion of C inputs from the litterfall components was: needles > miscellaneous > branches > bark > cones and flowers (Fig. 6). The order for the proportion of N inputs showed a similar trend (Fig. 6). The proportion of N input from needle fall of the total litterfall varied between 50.9% (1,300 trees/ha) in the slightly damaged plots to 83.5% (800 trees/ha) in the severely damaged plots. The mean N return for miscellaneous litter was about 21% of the total litterfall in the pine wilt disease stands.
The pine wilt disease damage intensity greatly altered the quality and quantity of C and N from litterfall components in a natural pine stand. The C and N concentrations and inputs by needle litterfall were linearly related to basal area, whereas the concentrations and inputs of cone and flower litter were not significantly affected by basal area. The results indicated that pine wilt disease could have an impact on C and N cycles through litterfall; thus, the C and N cycles could differ considerably among stands with different degrees of pine wilt disease damage.


![Relationships between basal area and carbon (C) concentration in litterfall components (needles in the fall season [a] needles in the spring season [b] branches [c] bark [d] cones and flowers [e] miscellaneous [f]) in pine wilt disease stands.](http://oak.go.kr/repository/journal/10630/STHHCL_2011_v34n2_215_f002.jpg)
![Relationships between basal area and nitrogen (N) concentration of litterfall components (needles in the fall season [a] needles in the spring season [b] branches [c] bark [d] cones and flowers [e] miscellaneous [f]) in pine wilt disease stands.](http://oak.go.kr/repository/journal/10630/STHHCL_2011_v34n2_215_f003.jpg)
![Relationships between basal area and carbon (C) inputs of litterfall components (needles [a] branches [b] bark [c] cones and flowers [d] miscellaneous [e] total litterfall [f]) in pine wilt disease stands.](http://oak.go.kr/repository/journal/10630/STHHCL_2011_v34n2_215_f004.jpg)
![Relationships between basal area and nitrogen (N) inputs of litterfall components (needles [a] branches [b] bark [c] cones and flowers [d] miscellaneous [e] total litterfall [f]) in pine wilt disease stands.](http://oak.go.kr/repository/journal/10630/STHHCL_2011_v34n2_215_f005.jpg)