A number of characteristics of the Lake Hovsgol watershed, such as the lake’s location at the edge of the Central Asian continuous permafrost zone, provide a unique opportunity to evaluate possible anthropogenic impacts in this remote area in northern Mongolia. In this study, we compared stream solute concentrations in six sub-watersheds in the Lake Hovsgol watershed. Water samples were collected during the summer months between 2003 and 2005. Concentrations of Cl- ranged from 9.8 to 51.3 ㎛ol/L; average nitrate concentrations were very low and ranged from undetectable to 1.1 ㎛ol/L and average SO4 2- concentration at sampling stations with minimal animal grazing ranged from 66 to 294㎛ol/L. Average dissolved organic carbon (DOC) concentrations ranged from 642 to 1,180 ㎛ol C/L. We did not find statistically significant differences in DOC concentrations among the six streams, although DOC concentrations tended to be higher in the two northernmost streams, possibly related to differences in the active layer above the permafrost. Dissolved organic nitrogen (DON) concentrations were correlated with DOC concentration, and followed the same spatial pattern as those for DOC. In streams in this remote watershed, total dissolved nitrogen was made up of mostly organic N, as has been found for other regions distant from anthropogenic N sources. Overall, these results suggest that future research on the dynamics of DOC and DON in this watershed will be especially insightful in helping to understand how changes in climate and land use patterns will affect transformations, retention, and export of dissolved organic matter within these sub-watersheds in the Lake Hovsgol region.
Mongolia has one of lowest population densities in the world (2 individuals/km2) (United Nations Population Division 2006). Lake Hovsgol is one of the most important sources of freshwater in Mongolia, holding about 70 percent of its surface freshwater. Lake Hovsgol is a large and deep tectonic lake (surface area = 2,760 km2, zmax = 262 m)and is part of the Baikal Rift system (Goulden et al. 2006).The lake’s watershed occupies an area of 4,920 km2; the outflow from the lake, the Eg River, flows eastward into the Selenge River and into Lake Baikal. An important historical characteristic of Lake Hovsgol and its watershed has been the general absence of anthropogenic impacts, resulting in pristine water quality. Recently, however, there has been increasing concern regarding the impacts of livestock grazing and climate change in the watershed. More than 90 streams enter Lake Hovsgol, but only between 20 and 25 of these have substantial discharge (Myagmarjav and Davaa 1999). Further details on Lake Hovsgol and its watershed are in Goulden et al. (2006).
The Lake Hovsgol watershed is at the southern edge of the Central Asian continuous permafrost zone (Brown et al. 1995). The major biomes in the watershed are taiga forest and steppe grassland. Permafrost commonly occurs in the watershed but varies spatially. Trends in climate and changes in permafrost in the watershed are similar to results from other studies showing warming and thawing of permafrost in northern latitudes (Osterkamp and Romanovsky 1999, Osterkamp and Jorgenson 2006).
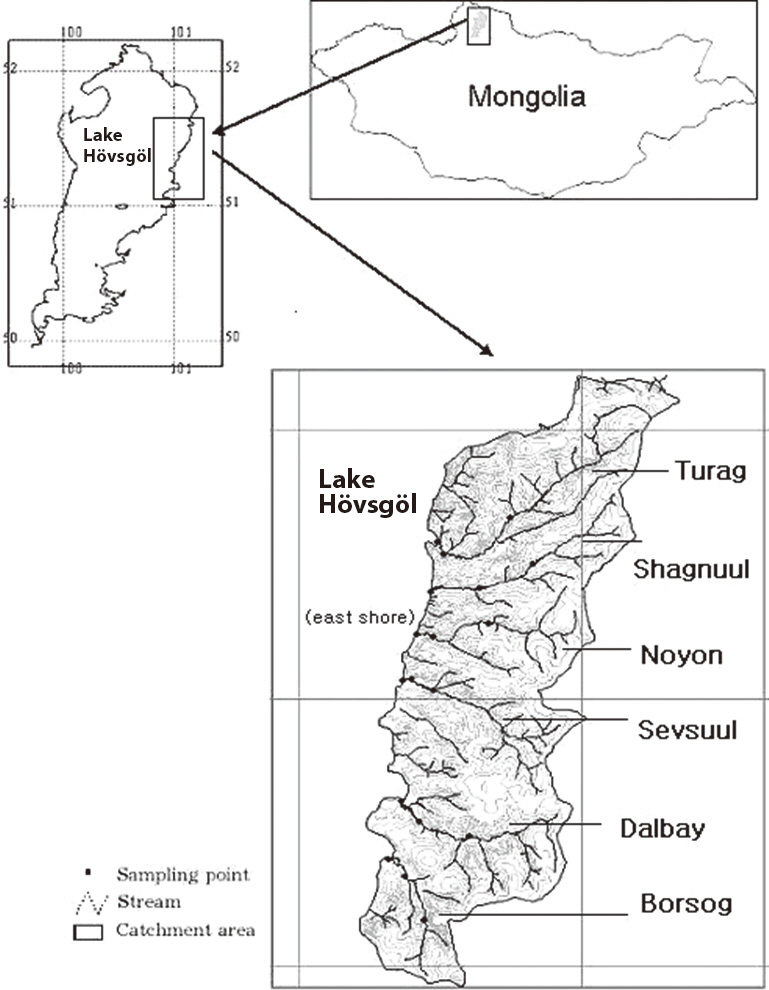
Compared to the western side of the basin, the streams on the east side of the lake are larger and have more continuous flow into the lake. As part of a comprehensive long-term biogeochemistry research program, we selected six stream valleys on the eastern shore of Lake Hovsgol in which to monitor stream solute chemistry. This paper summarizes some patterns in spatial variation in stream chemistry and the influence of watershed characteristics that may affect patterns in solute chemistry of inlet streams to Lake Hovsgol. Understanding patterns in other watershed attributes and whether they are related to differences in livestock grazing pressure is an important focus of ongoing research in the watershed. Thus increased understanding of the biogeochemistry of Lake Hovsgol and continued monitoring are needed to better evaluate the effects of climate change and other anthropogenic disturbances.
The Lake Hovsgol watershed (Fig. 1) is located in a remote region of Mongolia and hence there were considerable challenges for conducting all aspects of this study including sample collection and analyses. However, the importance of this region, not only to Mongolia but also to East Asia as a whole, and its unique situation with respect to nomadic grazing and climate change, make it imperative to continue the ongoing efforts in research, training, establishing an ecological database, and begin-
ning to understand hydrology and biogeochemistry of this watershed (Tsogtbaatar and Goulden 2000).
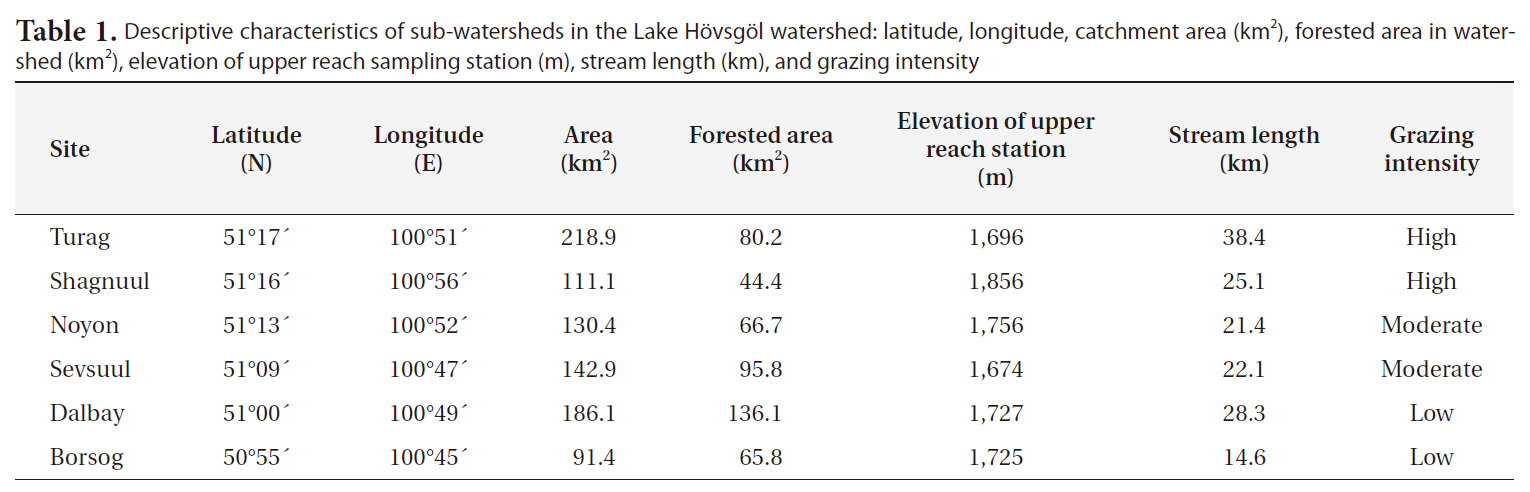
There is considerable variation in size and grazing intensity among the six sub-watersheds we studied (Table 1). The stream valleys ranged from the heavily grazed northern valleys, Turag and Shagnuul; central Noyon and Sevsuul with moderate grazing; and southernmost Dalbay and Borsog with little or no grazing pressure. Forest cover in this area is composed almost exclusively of larch (
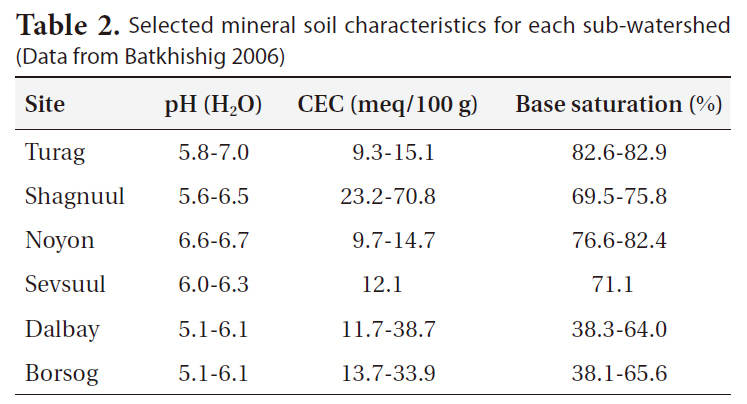
Common bedrock types in the Lake Hovsgol region include Pliocene basalts and Devonian granosyenite (Batkhishig 2006). The soils in the study watersheds have a range of pH values, from 5.1 to 7.0, a wide range of cation exchange capacities (9.3-70.8 meq/100 g), and a wide range of percent base saturation (38.3-82.9) (Table 2).
The Lake Hovsgol watershed receives more than 70 percent of its annual precipitation from May to October, with winters being dry and very cold (typical mid-winter temperature < -20°C). The total annual precipitation during 2003 to 2005 ranged from 241 to 412 mm (average 308 mm), with most of the precipitation occurring during July and August. There is evidence that climate change may be occurring more intensively in northern Mongolia than in other regions of Mongolia (Namkhaijantsan 2006). For example, the number of precipitation days (at

Descriptive characteristics of sub-watersheds in the Lake Hovsgol watershed: latitude longitude catchment area (km2) forested area in watershed (km2) elevation of upper reach sampling station (m) stream length (km) and grazing intensity
[Table 2.] Selected mineral soil characteristics for each sub-watershed (Data from Batkhishig 2006)

Selected mineral soil characteristics for each sub-watershed (Data from Batkhishig 2006)
least 2 mm of precipitation) has increased, but the average annual precipitation has not increased significantly. There has been a significant decrease in the number of frost days, indicating significant winter warming, and a significant increase in extremely hot days (Nandintsetseg et al. 2007). The overall increase in ambient temperatures and the longer growing season is potentially increasing evapotranspiration rates in the Hovsgol watershed.
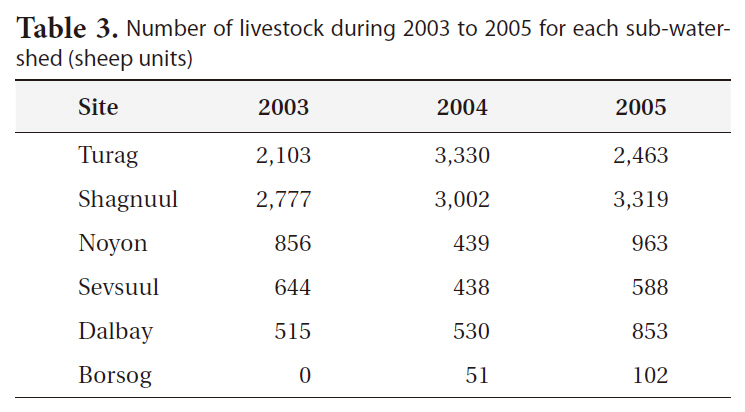
Livestock numbers in the sub-watershed during the study period are shown in Table 3, and were used as the basis for assigning grazing intensity categories. Livestock in the grazed portions of the watershed included sheep, goats, yaks, cows, and horses. The number of livestock in the sub-watersheds decreased from north to south and provided a gradient of grazing intensity (highest in Turag and Shagnuul, moderate in Noyon and Sevsuul, and lowest in Dalbay and Borsog) that we examined the relationships to other variables including vegetation cover, permafrost, or indices of human activity in the sub-watersheds (Ariuntsetseg unpublished). The livestock survey also showed a general increasing trend in the
[Table 3.] Number of livestock during 2003 to 2005 for each sub-watershed (sheep units)

Number of livestock during 2003 to 2005 for each sub-watershed (sheep units)
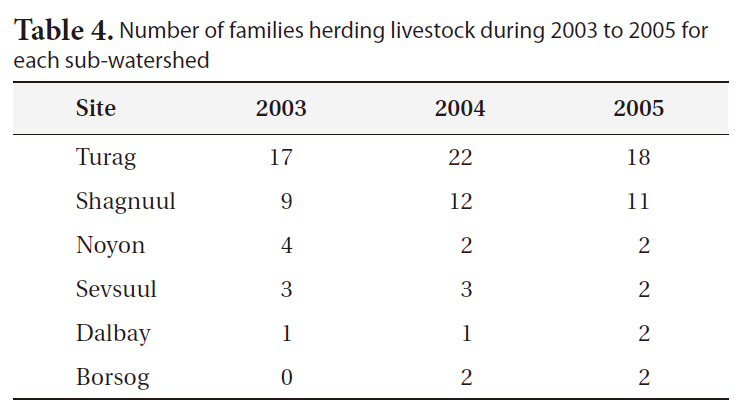
[Table 4.] Number of families herding livestock during 2003 to 2005 for each sub-watershed

Number of families herding livestock during 2003 to 2005 for each sub-watershed
number of livestock from 2003 to 2005, although not in every sub-watershed. Estimates of the number of families living in each sub-watershed based on on-site interviews are shown in Table 4. For example, during 2004, the number of families in each sub-watershed ranged from 17 to 22 for Turag (high grazing intensity) and from 0 to 2 for Borsog (low grazing intensity).
Sub-watersheds were chosen to study the gradient of grazing intensity based upon livestock density (0-3,330 sheep units) (Table 3) and number of families (0-22) (Table 4) living within each sub-watershed. The number of livestock in each sub-watershed was obtained from results of surveys conducted of local families. For each sub-watershed stream, water samples from three locations, designated as upper, middle, and lower reach stations, were sampled for chemical analysis. Stream solute concentrations were compared among the sub-watersheds. Because grazing intensity at the upper elevation stations was minimal in all sub-watersheds, these sampling stations represented reference areas with respect to grazing impacts within each sub-watershed.
Comparisons were also made using combined results from middle and lower reach stations in each sub-watershed to evaluate the effects of watershed characteristics such as grazing intensity (low, moderate, high) on solute chemistry. Non-parametric Kruskal-Wallis multiple comparisons and linear regressions were performed on untransformed data using SAS ver. 8.2 (SAS 2002) and Statistica ver. 7 (StatSoft 2000).
Grab samples of streamwater were collected in pre-cleaned bottles during the summer period from 2003 to 2005 at the three stations in each stream valley. The upper stations in the upper part of each valley were selected above areas where livestock grazing might impact the streams. The middle and lower stations (near the lake) were selected in the grazing areas of each valley (Fig. 1). Water samples were filtered using 0.45 ㎛ membrane filters and shipped to the analytical laboratories by international courier. Stream pH was measured in the field with a TOA 20P pH meter (DKK-TOA, Tokyo, Japan). Water samples were collected once in 2003 and twice in 2004, and analyzed by the Research Center for Environmental Changes, Taiwan. Major anion concentrations (Cl-, SO42-, NO3- ) were determined using a Dionex ICS-90 ion chromatograph (Dionex Corp., Sunnyvale, CA, USA) equipped with an AS9-HC column (Dionex Corp.). Major cation concentrations (NH4+, Na+, K+, Ca2+, Mg2+) were measured using a Dionex ICS-1500 (Dionex Corp.) ion chromatograph equipped with a heated CS12A column (Dionex Corp.). Dissolved organic carbon (DOC) concentration was measured using an O.I. Analytical 1010 TOC analyzer (O.I. Analytical, College Station, TX, USA). Laboratory QA/QC protocols were used such as blanks and duplicate sample analysis. A certified reference river water sample (NRC SLRS-4) was used as an independent reference sample with each batch of water samples. Total dissolved phosphorus (TDP) concentration was measured only during 2004 using persulfate digestion and the procedure of Menzel and Corwin (1965).
In 2005 water samples were collected three times ? once each during early June, July, and August and were analyzed at the SUNY-ESF Biogeochemical Laboratory in Syracuse, NY. Prior to analyses, samples were refrigerated. Anion concentrations were measured using ion chromatography (DX-120; Dionex Corp.). Cation concentrations were determined using inductively coupled plasma-optical emission spectrophotometer (ICPOES, Perkin Elmer 3500DV; Perkin Elmer, Waltham, MA, USA). DOC was analyzed with a TOC analyzer (Dohrman Phoenix 8000; Teledyne-Tekmar, Mason, OH, USA). Total dissolved nitrogen (TDN) was measured using persulfate oxidation (Ameel et al. 1993) with an Auto Analyzer 3 using methods described by Mitchell et al. (2001). Dissolved organic nitrogen (DON) was calculated by subtracting the concentrations of NH4-N and NO3-N from that of TDN. The Biogeochemical Laboratory at SUNY?ESF follows extensive QA/QC procedures. Every analytical sample batch included calibration QC samples, detection limit QC samples, an analytical blank, and replicate analysis. The laboratory participates in the United States Geological Survey (USGS) audit program (Branch of Quality Systems, Standard Reference Sample Project) to ensure data quality.
>
Upper sampling station stream chemistry
Among the stations with little to no grazing (upper stations), we found some differences in solute concentrations in the six streams. Average concentrations of Cl- tended to be higher in Turag and Sevsuul and ranged from 9.8 to 51.3 ㎛mol/L (Table 5). The average SO42- concentration at these stations ranged from 66 to 294 ㎛mol/L; Turag had the highest average SO42- concentration and Borsog and Noyon showed the next highest average SO42- concentrations of 150.5 and 139.9, respectively (Table 5). Average NO3- concentrations were low and ranged from undetectable to 2.6 ㎛mol/L (Table 5). Ammonium (NH4+) concentrations were also low and ranged from below 1.0 ㎛mol/L (near detection limit) to 9 ㎛mol/L. The distribution of NH4+ concentrations was highly skewed with 23 values out of 30 samples having NH4+ concentrations below the detection limit.
Base cation concentrations (Ca2+, Mg2+, Na+, and K+) were also variable among the upper stations; the average concentrations are summarized in Table 5. None of the differences among the upper stations in base cation concentration were statistically significant using Kruskal-Wallis multiple comparison tests (
The northernmost and central streams (Turag and Shagnuul, Noyon and Sevsuul, respectively) showed generally higher DOC concentrations, although this difference was not consistent (Table 5). Average DOC concentrations ranged from 642 ㎛mol/L at Borsog to 1,180 ㎛mol/L at Shagnuul. Similar to the pattern for DOC, DON concentrations tended to be higher in the northern and central streams (Table 5). Overall, DON concentrations ranged from 16 to 46 ㎛mol/L (Table 5).
>
Stream chemistry at the middle and lower stations
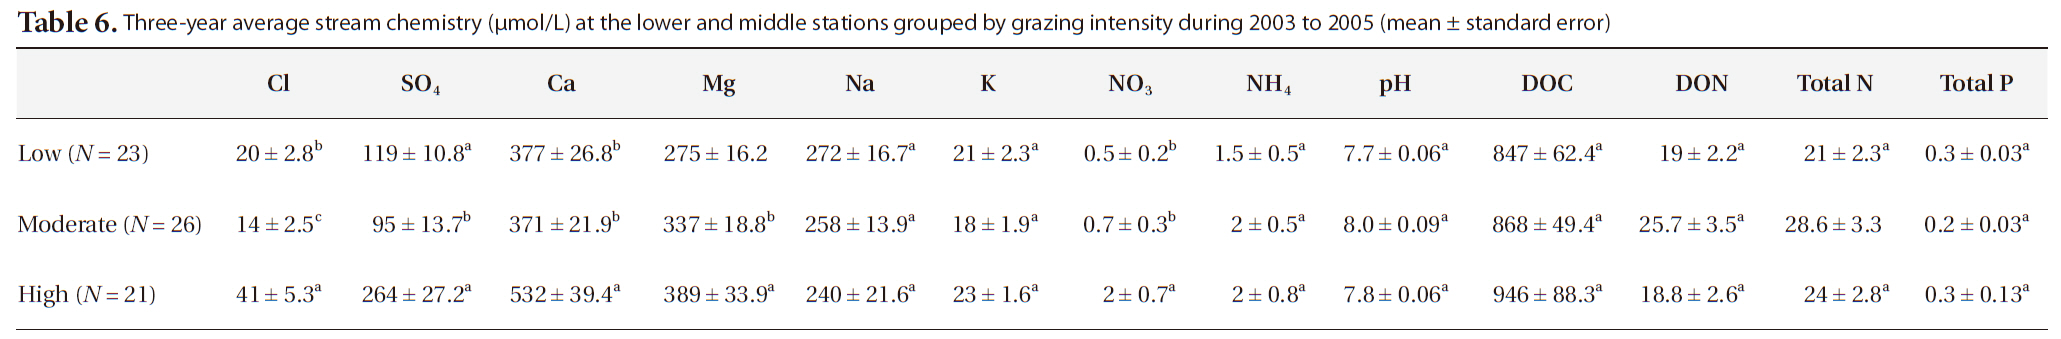
We also found differences in stream chemistry among the streams at the middle and lower sampling stations (grouped by grazing intensity) (Table 6). Using Kruskal-Wallis multiple comparison tests, we found significant differences in nutrient concentrations for only a few solutes. For example, concentrations of Cl- were higher in streams with the highest grazing pressure (Turag and Shagnuul) (Table 6). Average concentrations of Ca2+, Mg2+, and SO42- were also highest in streams with the highest grazing intensity (Table 6). Average stream pH did not vary among the sites, and ranged from 7.7 to 8.0. Although we found some higher solute concentrations
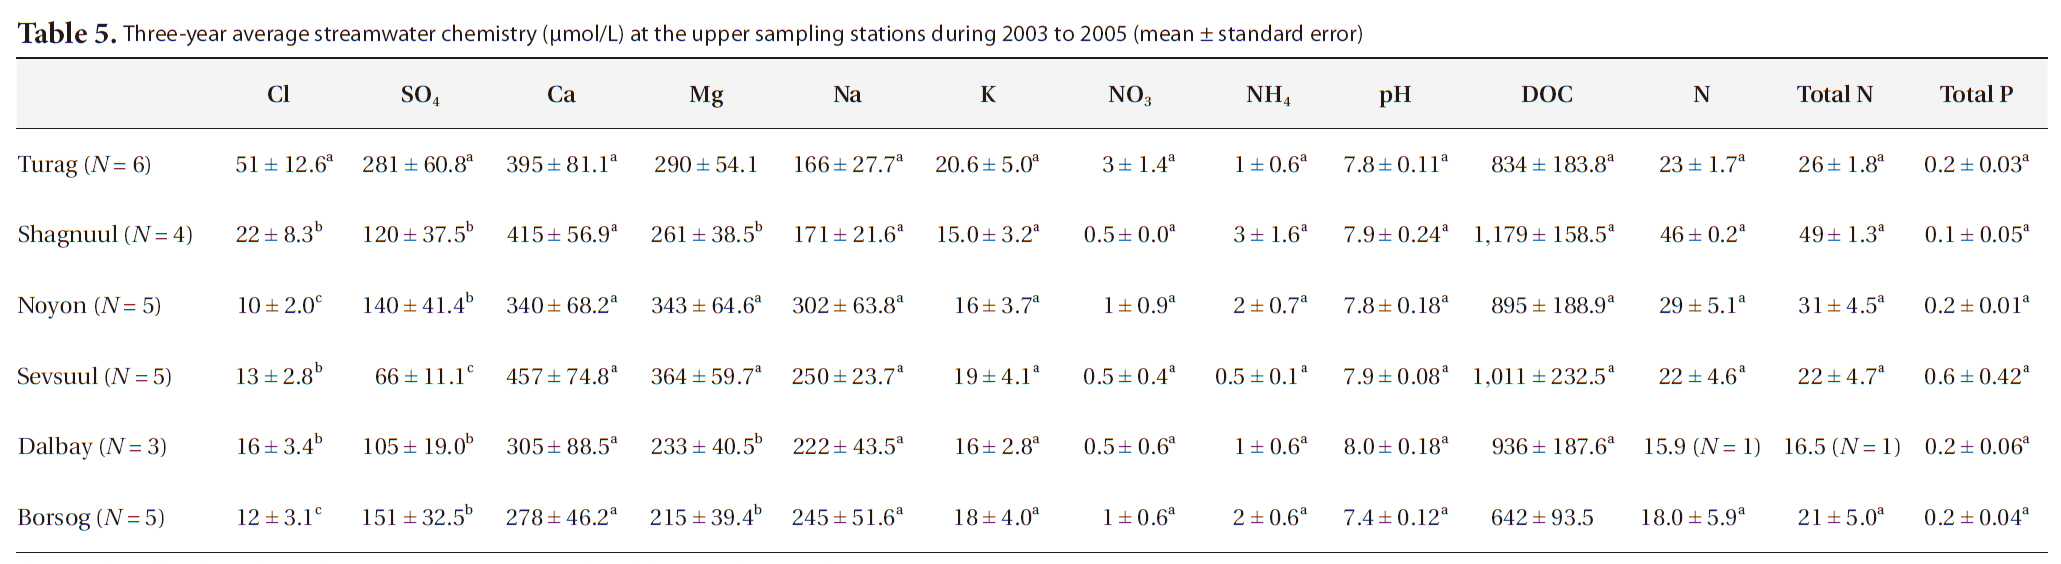
Three-year average streamwater chemistry (μmol/L) at the upper sampling stations during 2003 to 2005 (mean ± standard error)

Three-year average stream chemistry (μmol/L) at the lower and middle stations grouped by grazing intensity during 2003 to 2005 (mean ± standard error)
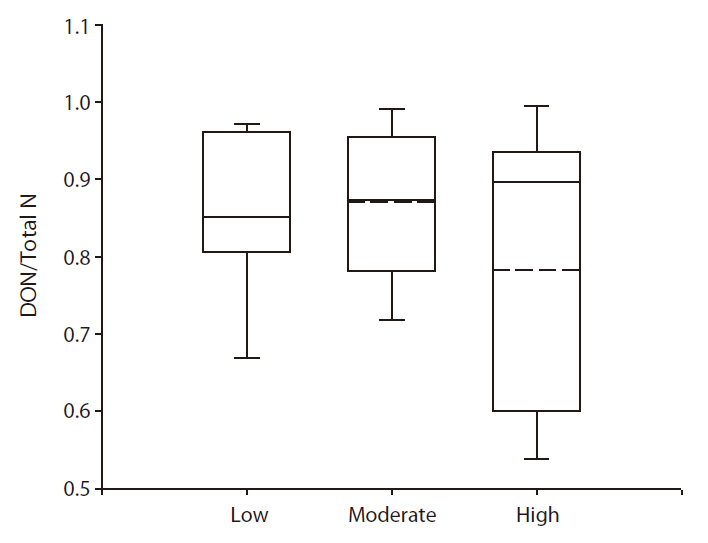
in the streams with the highest grazing intensity (Turag and Shagnuul), there were no large differences in average solute concentration between the low and moderate grazing sites. This was especially apparent in our results for DON and TDN (Table 6), where concentrations varied little among the streams grouped by grazing intensity. We did not find a statistically significantly difference in DOC concentration among sites with high, moderate, or low grazing intensity, but the average DOC concentration was highest at the high grazing intensity sites (Table 6). The average stream DOC concentrations were 847 ± 62, 868 ± 49, and 946 ± 88 (standard error) ㎛mol/L in the low, moderate, and high grazing intensity sites, respectively. The fraction of total dissolved N as DON ranged from 0.53 to 0.99, and showed no apparent pattern with grazing intensity or active layer thickness (Fig. 2).
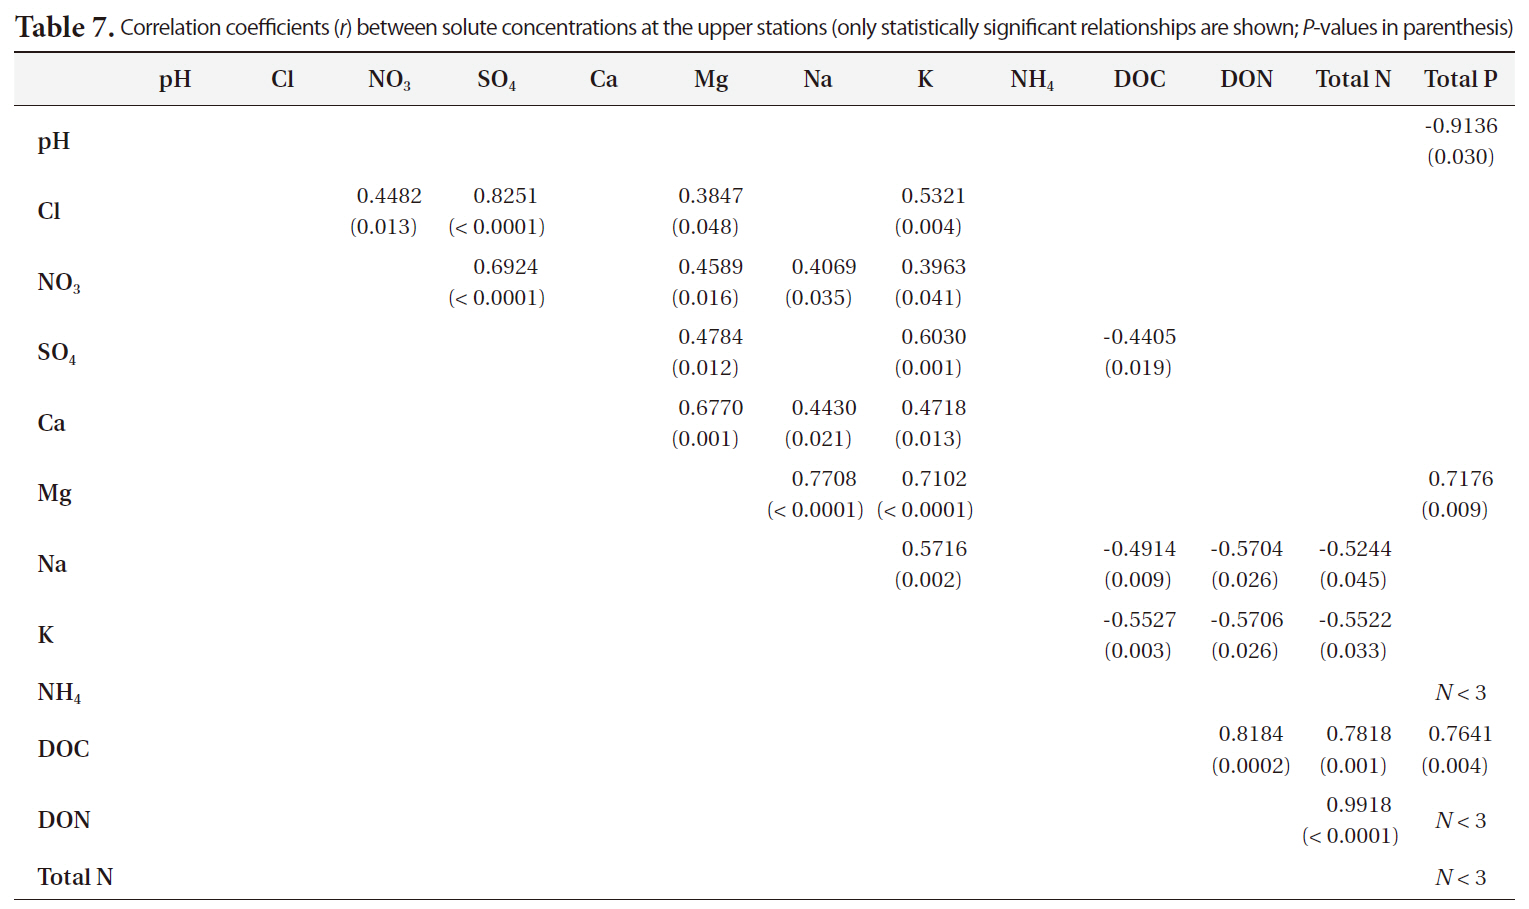
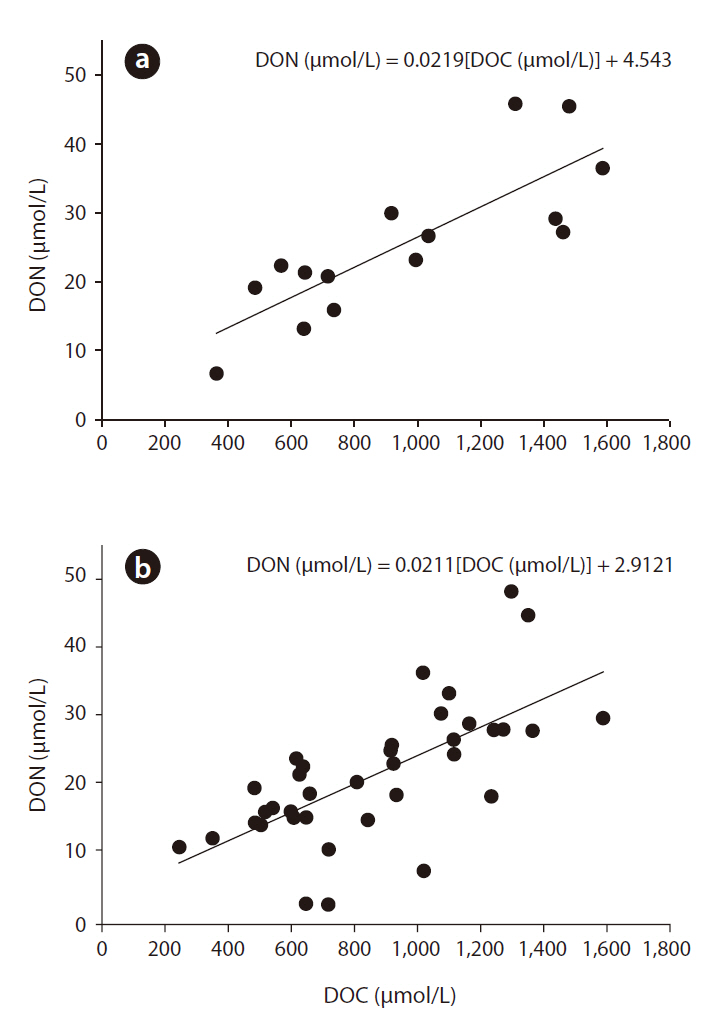
The correlation matrix between stream nutrient concentrations at the upper stations is shown in Table 7. At the least grazing-impacted sites (i.e. upper stations only), some of the more interesting relationships between nutrients included our finding that DOC concentrations were strongly correlated with DON and TDN concentrations (Fig. 3). We also found that DOC concentrations were negatively correlated to SO42- concentrations (

Correlation coefficients (r) between solute concentrations at the upper stations (only statistically significant relationships are shown; P-values in parenthesis)
pH (
Many watershed attributes have been related to variation in stream chemistry such as geology (Dillon and Kirchner 1975, Newton et al. 1987, Holloway et al. 1998), influence of riparian zones (Lowrance et al. 1984), soil characteristics (Ka?a and Ka?a and Kopa?ek 2006), vegetation cover (Cronan et al. 1987, Lovett et al. 2004), topography and elevation (Lawrence et al. 2000, Sueker et al. 2001), and other variables. A wide variety of disturbances, including forest cutting (Bormann et al. 1968), agricultural activity (Lowrance et al. 1984), and livestock grazing (Schepers and Francis 1982, Belsky et al. 1999) are also known to affect stream chemistry. The small number of samples
limited our ability to fully evaluate all the factors affecting the stream chemistry of these six sub-watersheds, but our results allow us to speculate that the most important factors affecting spatial patterns in stream chemistry in the Lake Hovsgol watershed likely include, in addition to livestock grazing, geologic characteristics, soil type, and thickness of the active layer above permafrost.
Carey (2003) compared soil water DOC concentrations between a north-facing area with permafrost and a south-facing area with only seasonal frost in the Granger Basin (Yukon) and found higher DOC concentrations in the area with permafrost. The suggestion of a decreasing trend in stream DOC concentration from the northern to the southern sub-watersheds in the Lake Hovsgol watershed is consistent with the patterns found in Alaskan forests underlain by permafrost (MacLean et al. 1999, Petrone et al. 2006). This pattern results from differences in hydrological flowpaths between areas with more extensive permafrost cover and areas with less extensive permafrost. In areas with less permafrost, water can infiltrate deeper into the soil profile; DOC adsorption occurring in the soil reduces the amount of DOC that can be moved to streams. Although we did not have access to data on active layer depths at each study site, short-term monitoring of permafrost in the six valleys showed that active layer thickness varies from 1.4 m in Dalbay valley in the south to 4.8 m in Turag valley in the north (Sharkhuu et al. 2007).
Average stream DOC concentrations did not vary in a consistent pattern from the northern sites (such as in Turag and Shagnuul) to the southern sites (except Borsog, where we found the lowest DOC conentrations) in the Lake Hovsgol sub-watersheds. If grazing activity leads to lower vegetation cover and increased bare soil in riparian areas, there is the possibility of higher losses of dissolved organic matter from soil to the streams. Thus, we cannot ignore the possibility of livestock grazing influencing stream DOC or other solute concentrations in the Lake Hovsgol sub-watersheds where livestock are present. Certainly, further studies of the Hovsgol ecosystem, including impacts of animal grazing and permafrost thickness on streamwater chemistry, are needed.
The impacts of animal grazing on stream temperature, sediment yield, and water quality have been well documented (e.g. Li et al. 1994). If livestock grazing were directly affecting solute concentrations in the streams, we would most likely expect increases in concentrations of TDP, NH4+, NO3- and Cl- (Schepers and Francis 1982). In the present study, we did not focus on riparian zone processes or possible differences in sediment deposition among streams with differing grazing intensities. Vegetation surveys, however, showed large differences in vegetation cover and bare ground exposure among the sub-watersheds. The role of bare ground exposure in affecting stream solute concentrations could be a focus of future research in the watershed. The suggestion that future work in the Lake Hovsgol watershed should include the quantification of sediment deposition processes in the streams also warrants further investigation.
Our study has provided the first estimates of DON concentration in streams in the Lake Hovsgol watershed. The TDN pool in these streams was made up of mostly organic nitrogen, while inorganic N accounts for a small fraction of total N. On average, the proportion of total N as organic N did not seem to vary among the sub-watersheds, and ranged from 58% to 99% of the total dissolved N (Fig. 2). This measure of the importance of organic N is similar to results from other regions (McHale et al. 2000), especially in regions with little anthropogenic input of N (Perakis and Hedin 2000). Fig. 3 compares the relationship between DOC and DON for the sampling stations with minimal or no livestock (upper stations), and the relationship between DOC and DON in the streams with livestock. Between the data sets, there was no difference in the slope of this relationship (
Moreover, research on the dynamics of DOC and DON transport in this watershed would be especially useful in helping to identify patterns related to climate change and possible effects of human activities in this region. One implication of our study is that as air temperature increases and permafrost active layer depths increase in this watershed, recently-thawed soils may act as a source of both dissolved inorganic and organic N to streams (Petrone et al. 2007). Understanding the relationship between soil C/N ratios and surface water chemistry will be required in future studies of the Lake Hovsgol watershed. Other studies have shown that soil characteristics, including soil C/N ratio, are a key variable in understanding differences in retention and export of nutrients, especially C and N (Currie et al. 1996, Aitkenhead-Peterson et al. 2005).
Lake Hovsgol is among the most pristine freshwater ecosystems in temperate regions. Our stream chemistry monitoring results show that more research is needed to better understand the patterns in dissolved solute concentrations in the study area. We can speculate that differences in solute concentrations among these streams can possibly be affected by livestock grazing, and also affected by the thickness of the permafrost active layer and general soil characteristics in the sub-watersheds. Our finding that stream DOC concentrations did not consistently vary from the northern (Turag and Shagnuul) to the southern sites (Dalbay and Borsog) demonstrates the importance of initiating further studies on soil and stream water chemistry and hydrological processes at Lake Hovsgol in this remote region in central Asia. Specifically, our results show that more research on characterization and dynamics of DOC and DON in soils, soil solution, stream water, and their hydrological linkages in this watershed will be especially useful in helping to identify important indicators and understand patterns in dissolved organic matter transformations, retention, and export related to climate change in this region.