Diverse ecosystem phenomena arising from combinations of living organisms and their interactions with the physical environment are highly nonlinear, very complex,and frequently chaotic (Fielding 1999). In a Newtonian physical simulation of a thrown ball, for example, it is necessary to incorporate factors such as the effects of gravity, the mass of the ball, etc. In many circumstances,we can ignore aspects such as air density, wind, etc. In other circumstances (golf, baseball), however, these factors may prove important. Generally, we know with a fair degree of accuracy what must be included and what must be omitted to construct a model with the required level of accuracy, according to the degree of relevance to the issue. By way of contrast, we frequently possess little of this type of knowledge in the study of ecology, which is not the case in physics or chemistry
Hence, it can prove quite difficult to forecast and explain the broad variety of environmental aspects and their emergent behaviors in ecosystems, especially as compared to other existing scientific systems. Ecological modeling faces some unique problems in dealing with complex environment-organism relationships, and is one of the toughest domains that might be encountered by a modeler. The relevant difficulties derive both from the complexity of the systems being modeled and the quality and quantity of data available for model development(Shan et al. 2006).
However, this is not the only reason that ecological modeling is difficult. The data, too, may introduce some difficulty. Ecological data is frequently both rough and noisy, particularly when it is sampled from the field. Field sampling is generally expensive, since it is often collected by hand. The data is frequently sparse (missing) and/or collected in an irregular fashion, owing to exceptional conditions including illness, equipment failure, or holidays. As reported previously by Lek (2007), ecological data frequently contains sampling errors and measurement and intermittent estimation mistakes, thereby introducing uncertainty into the resultant models. Moreover, the sources of errors themselves may be biased, thus creating errors that are correlated with the measurements.
Although the development of sampling and measuring technologies for data collection has ameliorated these problems to some degree, many ecological datasets have been collected over periods of multiple years, and these changes have had limited impact thus far. The issues relevant to coping with imperfect data remain very important in the field of ecological modeling. Moreover, additional difficulties arise from the large numbers of variables relative to the number of instances in ecological datasets ? because we do not generally know which relationships are important, we tend to include all available measurements, rather than risk omitting an important one. Consequently, the redundant variables may create additional difficulties in the development of automated modeling methods.
A broad variety of methods have been employed in the development of such models, ranging from classical mathematical modeling (Recknagel and Benndorf 1982, Chapra and Reckhow 1983) to evolutionary computation (EC) (Kim et al. 2007b, Cao et al. 2008). EC can be used to create automatic functions or models, producing diverse candidates with a nonlinear computational structure; EC, as well as artificial neural networks (ANN), has yielded promising results in terms of the prediction certain environmental phenomena in ecological research (Recknagel et al. 2002, Cho and Sung 2004, Park et al. 2006a). In this paper, we discuss the relevance of EC to ecological modeling, illustrating it with an application to water quality modeling, and specifically to plankton population dynamics.
The remainder of this paper is structured as follows. First, we detail the relevant background of ecological modeling, describing the wide range of techniques that have been used thus far. We then attempted to identify the appropriate situations for the use of ecological modeling. We described some nature-inspired computational methods (of which EC constitutes a sub-class). We then investigated the important considerations to be taken into consideration in the development of an ecological model. We illustrate this via specific applications to water quality, and then conclude with a discussion of the applicability of EC to ecological modeling.
NECESSITY OF ECOLOGICAL MODELING
>
Why is ecological modeling special?
The model can be broadly defined as a specific representation of a system, in which each component involves a combination of relationships and interactions. In some cases, the models do not reflect the full mechanisms of the dynamic and integrated systems ? relatively simple model approaches such as regression, logistic-type models and predator-prey models may be employed in order to gain insight into general principles and probabilities (Lotka 1925, Volterra 1926, Schaefer 1968, Boerema and Gulland 1973, Cloern 1996). However, the ultimate objective of almost all ecological model construction is the construction of a system that can reproduce and simulate patterns of outcomes. Thus, the constructed models must be sufficiently sophisticated to accurately represent the target system, with the additional assumption that all of the knowledge is suited to the representation. Such models can be employed in the interpretation of general possibilities or the prediction of outcomes for particular populations, communities, or ecosystems.
Initially, ecosystems researchers engaged in great debates as to whether
Many approaches to ecosystems modeling have been developed that reproduce a system and reveal interactions and relationships, particularly when other experimental approaches prove impossible or impractical. Since Eugene Odum introduced theoretical modeling methods for use in systems ecology (Odum 1983), a number of models have been constructed in efforts to elucidate ecological processes more accurately. Jørgensen (1992) previously proposed the concept of exergy, as well as methods for computing ecosystem quality, to better understand the information level and interactions between ecological theory and the models. Deaton and Winebrake (2000) previously surveyed a variety of dynamic models that could be applied to environmental systems to model growth patterns, coupled predator-prey populations, water pollution, global warming, and so forth.
>
Ecological issues for freshwater systems in South Korea
These recent developments in modeling techniques have been previously applied to a case study examining algal communities in freshwater ecosystems. In Korea, modeling has been more frequently applied to the fields of hydrology and hydraulics than to limnology and freshwater ecology (Park and Lee 2002, Cho and Sung 2004). In this paper, we demonstrate the application of EC to ecological analysis and modeling in the context of Korean freshwater ecosystems.
The majority of freshwater ecosystems in South Korea no longer bear any resemblance to natural streams or lakes. They have generally been heavily modified by physical alterations, including dam construction and estuarine barrages (Kim et al. 1998, Kim et al. 2004). Trophic states are largely nutrient-enriched due to the approximately forty million people residing within this relatively small area (Joo et al. 1997). Additionally, climate characteristics, particularly the biased rainfall pattern (rainy summer and dry winter), are known to accentuate the effects of this freshwater eutrophication. Korean freshwater ecosystems, therefore, differ profoundly from, and perhaps are more complex to model than some other modified ecosystems.
MAJOR APPROACHES TO ECOLOGICAL MODELING
Statistical methods have been extensively employed for the analysis of datasets across different scientific regimes. In the field of ecological research, statistical analysis has given rise to the increasingly important field of biostatistics (Zar 1999). In the infancy of this discipline, readily applicable linear and statistical approaches were employed to isolate and identify significant ecosystem properties. In particular, many ecologists have analyzed their experimental data primarily via multivariate analyses such as principal component analysis (PCA) and canonical correspondence analysis. These ordination methods have commonly been employed in efforts to simplify the aquatic ecology data (Magadza 1980, Matta and Marshall 1984, van Tongeren et al. 1992, ter Braak and Verdonschot 1995, Romo et al. 1996). The limitations of these methods have been well established (e.g., horseshoe and arch effects). However, we do not discuss this in depth herein, since EC seldom deals with ordination methods, especially in ecological areas.
Second, a variety of time-series analyses have also been employed. In statistical approaches, multivariate linear regression (MLR) methods are probably the most popular. However, they are limited in several ways, including the presence of strong distortion deriving from nonlinear relations attributable to outliers, heteroscedasticity, and colinearity (Zuur et al. 2009). Among more advanced linear methods, an autoregressive model is a type of random process employed in the prediction of certain types of values and phenomena. AutoRegressive (integrated) moving averages (ARMA/ARIMA) are representatives, which are used for the prediction of continuous values, particularly in time-series analyses. Harding and Perry (1997) predicted a long-term increase in phytoplankton biomass using ARMA, and Mishra and Desai (2006) conducted comparative experiments between linear statistical models and neural networks to forecast droughts on the basis of the precipitation index of the river basin. Recently, Jeong et al. (2008) also compared forecasting performances between ARIMA and autoregressive ANN in predicting chlorophyll a. Generally, these approaches appear to have a somewhat limited ability to capture non-stationary and nonlinear peaks in ecological data. Consequently, ecologists searching for better prediction methods have become increasingly interested in artificial intelligence methods, which are able to deal with data in highly nonlinear structures.
In addition to linear statistical approaches, mathematical and numerical modeling techniques provide some of the most common tools used for the quantitative description of a system, frequently relying on mass balance equations. In these models, all components employed to represent and evaluate the system are described in the initial stages of model construction. Each component of the system interconnects and interacts with others in the model, based on known causal relationships; the succession of the resultant values generates the results. The majority of such models are deterministic models, which are represented as individual-based and object-oriented processes. Commonly, such models consist of a set of ordinary differential equations that model the dynamic system. For example, Odum (1983) previously introduced and exemplified many types of deterministic models to represent virtual ecosystems. In freshwater systems, a plethora of water quality models have already been designed and developed. Hakanson and Boulion (2003) presented a general dynamic model to predict phytoplankton biomass and production, and Arhonditsis and Brett (2005) developed a more complex model that incorporated phyto- and zooplankton in Lake Washington. For assessments of streams and rivers, QUAL2E is one of the most popular water quality models (Brown and Barnwell 1987). However, this technique has had some difficulties in cases in which the errors between predicted and observed values have been too large for direct application to target river systems. Hence, Park and Lee (2002) added some tuning parameters, such as autochthonous sources, in order to improve their model predictions. Nonetheless, this technique is still limited in terms of its ability of predict specific values (e.g. Biochemical Oxygen Demand and chlorophyll a) relevant to water quality, particularly in regulated river systems (Choi et al. 2008). In addition to these QUAL-based models, POTAMON is a unidimensional, non-stationary model that was designed to simulate potamoplankton. This is a more biologically friendly technique than QUAL2E, but does not reduce the errors inherent to the prediction of real observed values (Everbecq et al. 2001).
The rapid advance of computer science has ushered in a host of new technologies relevant to a broad range of sciences since the 1990s. Newer technologies and paradigms of ecosystem modeling have been proposed, aiming to reduce the uncertainty in models arising from qualitative and quantitative imperfections in the ecological data (Lek 2007). With the advent of computer-based modeling, data-collecting systems have also been developed and larger quantities of data have become available. This phenomenon has grown to encompass and delineate a wholly novel research field, referred to as ecological informatics (Recknagel 2006).
Computational algorithms take advantage of quick iterative calculations conducted with large volumes of data. Generally, empirical computational ecosystem models are designed to derive the best-fitting representation for an ecological dataset via a training and validation process (Fielding 1999). As many empirical computational models are constructed via data learning, they also fall under the rubrics of ‘machine learning’, ‘inductive model’ or ‘data-driven model’ (Recknagel 2006). Some representative examples include ANN, EC, decision tree models, fuzzy logic, etc. (Silvert 1997, Whigham and Recknagel 2001a, Goethals et al. 2003, Shan et al. 2006).
Among these, ANN and EC may be classified as biologically inspired methods, and ecological scientists have begun to take increasing interest in applying them to ecosystem modeling. Recknagel (2001) previously demonstrated some useful empirical models for ecological time-series modeling, emphasizing the limitation in the complexity of deductive ecological models with their rigid structures. Jeong et al. (2003) described an empirical predictive model in a comparison between statistical linear models and evolutionary computation. Kim et al. (2007a) also interpreted ecological significance on the basis of an empirical predictive model
EVOLUTIONARY COMPUTATIONS AND RELATED RESEARCH
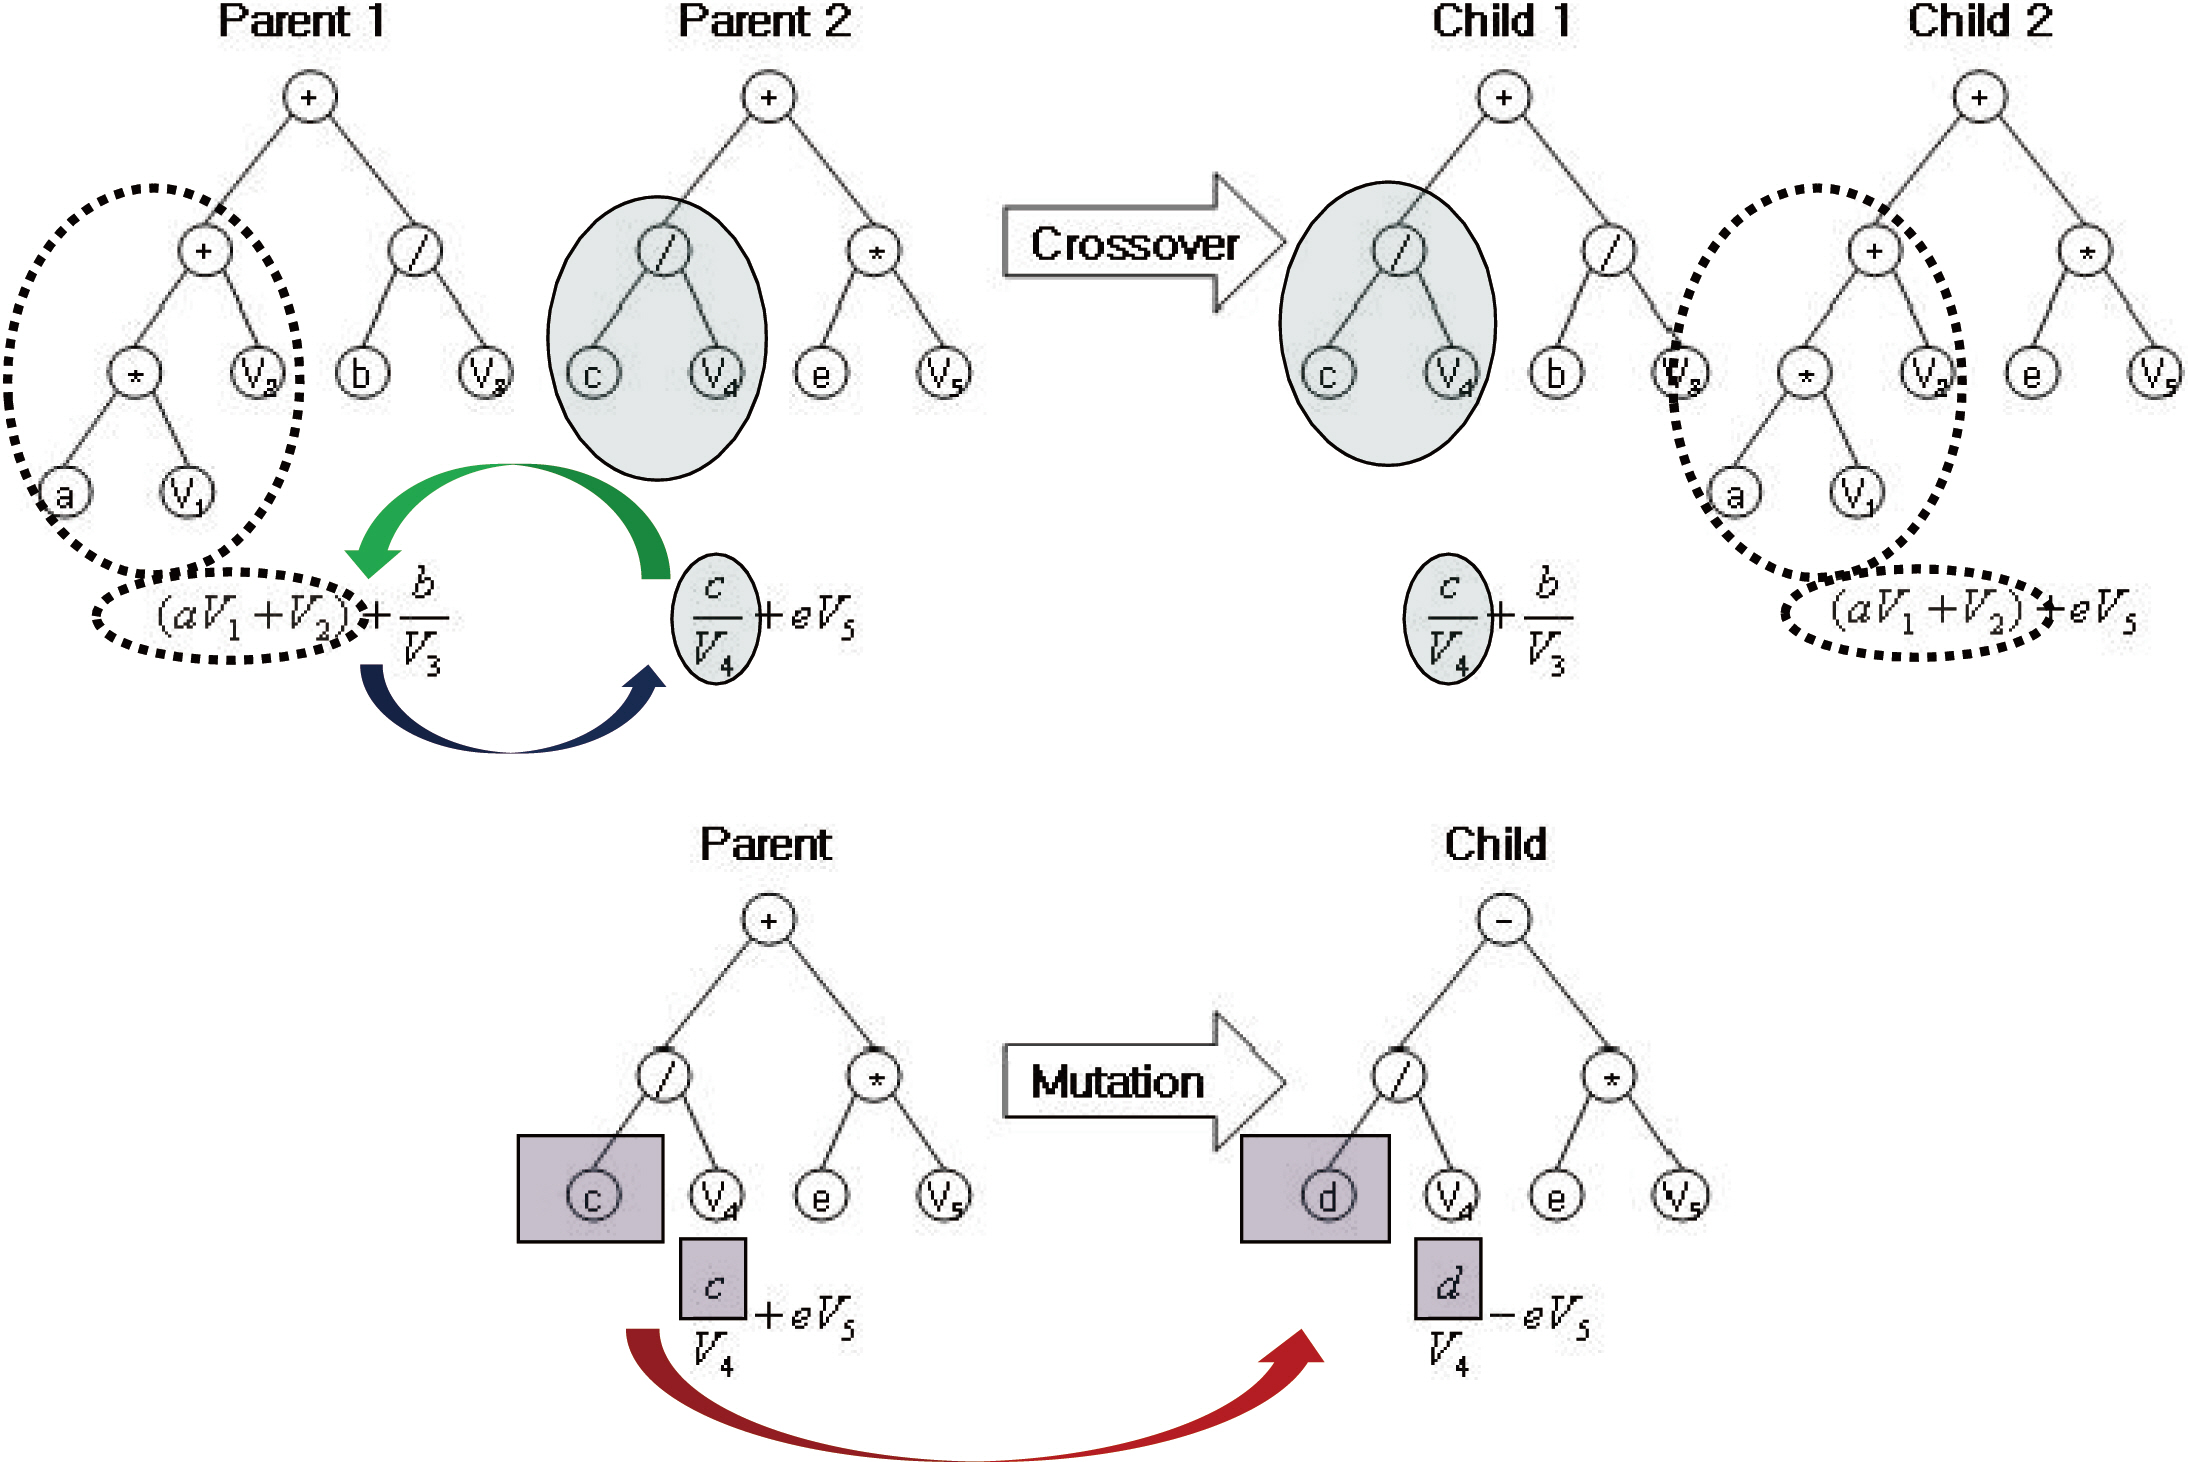
Genetic algorithms (GA) are a mechanism originally inspired by natural evolution (Holland 1975), which operate on strings of bits that are analogous to chromosomes. One unique attribute of the GA is that it adopts the evolutionary mechanisms of heritable variation and selection. Crossover and mutation processes in the GA cause variations in the population (chromosomes) over time. The individuals with poor fitness are excluded in the selection of the next generation’s parents. A near-optimal solution eventually results from the iterated application of these mechanisms.
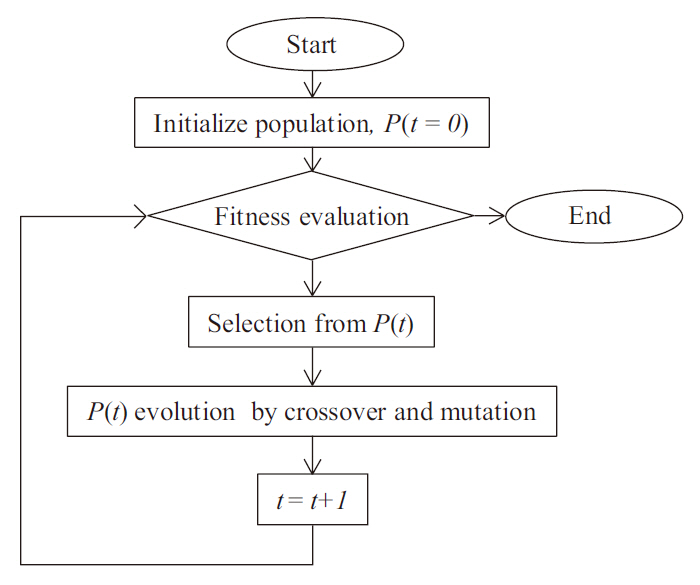
Genetic programming (GP) is an extension of the GA concept, in which the individuals exhibit a more complex (labeled tree) structure, thereby allowing them to reflect more complex target solutions (Koza 1992), comparable with ANN. This may ease the process of creating new offspring populations from the two parents. New populations are generated by removing a branch from one tree and inserting it into another, or replacing it with a whole new branch, by analogy with genetic operators such as crossover and mutation (Fig. 1). The overall procedure of the GP is described in Fig. 2. Population size, P(
At the termination of the computation, GP supplies labeled tree structures that can, in principle, be under-
stood by the user. This is an advantage of GP in terms of the readability of the model, whereas ANNs are a black-box model (their meaning is not readily comprehensible to humans). Nonetheless, ANNs have been utilized more extensively in ecological research (Lek et al. 1996, Chon et al. 2001, Park et al. 2006b, Goethals et al. 2007), and relatively few ecologists have presented the results of predictive modeling using GP (Savic et al. 1999, Whigham and Recknagel 2001a).
Table 1 presents some environmental and ecological research related to the applications of EC. Internationally, EC has been fairly broadly employed in environmental research. In particular, GA has been generally perceived as a favorable tool for parameter optimization in the engineering field, and has consequently come into common use for the constant fitting of complex structured models such as QUAL2K (Pelletier et al. 2006, Cho and Lee 2009). This methodology has been recently adopted for model optimization in Korea (Cho et al. 2004) and utilized for operational purposes in management policy (Lee and Chung 2004, Park et al. 2006a). Nonetheless, the applications of this technique in biological research are far fewer than those possible at an international level. Moreover, it appears that GA is more familiar to domestic researchers than is GP. GP has been used only rarely in the environmental engineering field, although its solutions are more transparent and extensible than GA. In rainfall-runoff modeling, GA-optimized tank structured (Paik et al. 2005) and GP-based self-automated models (Khu et al. 2001, Rabunal et al. 2007) have been used in both domestic and international research.
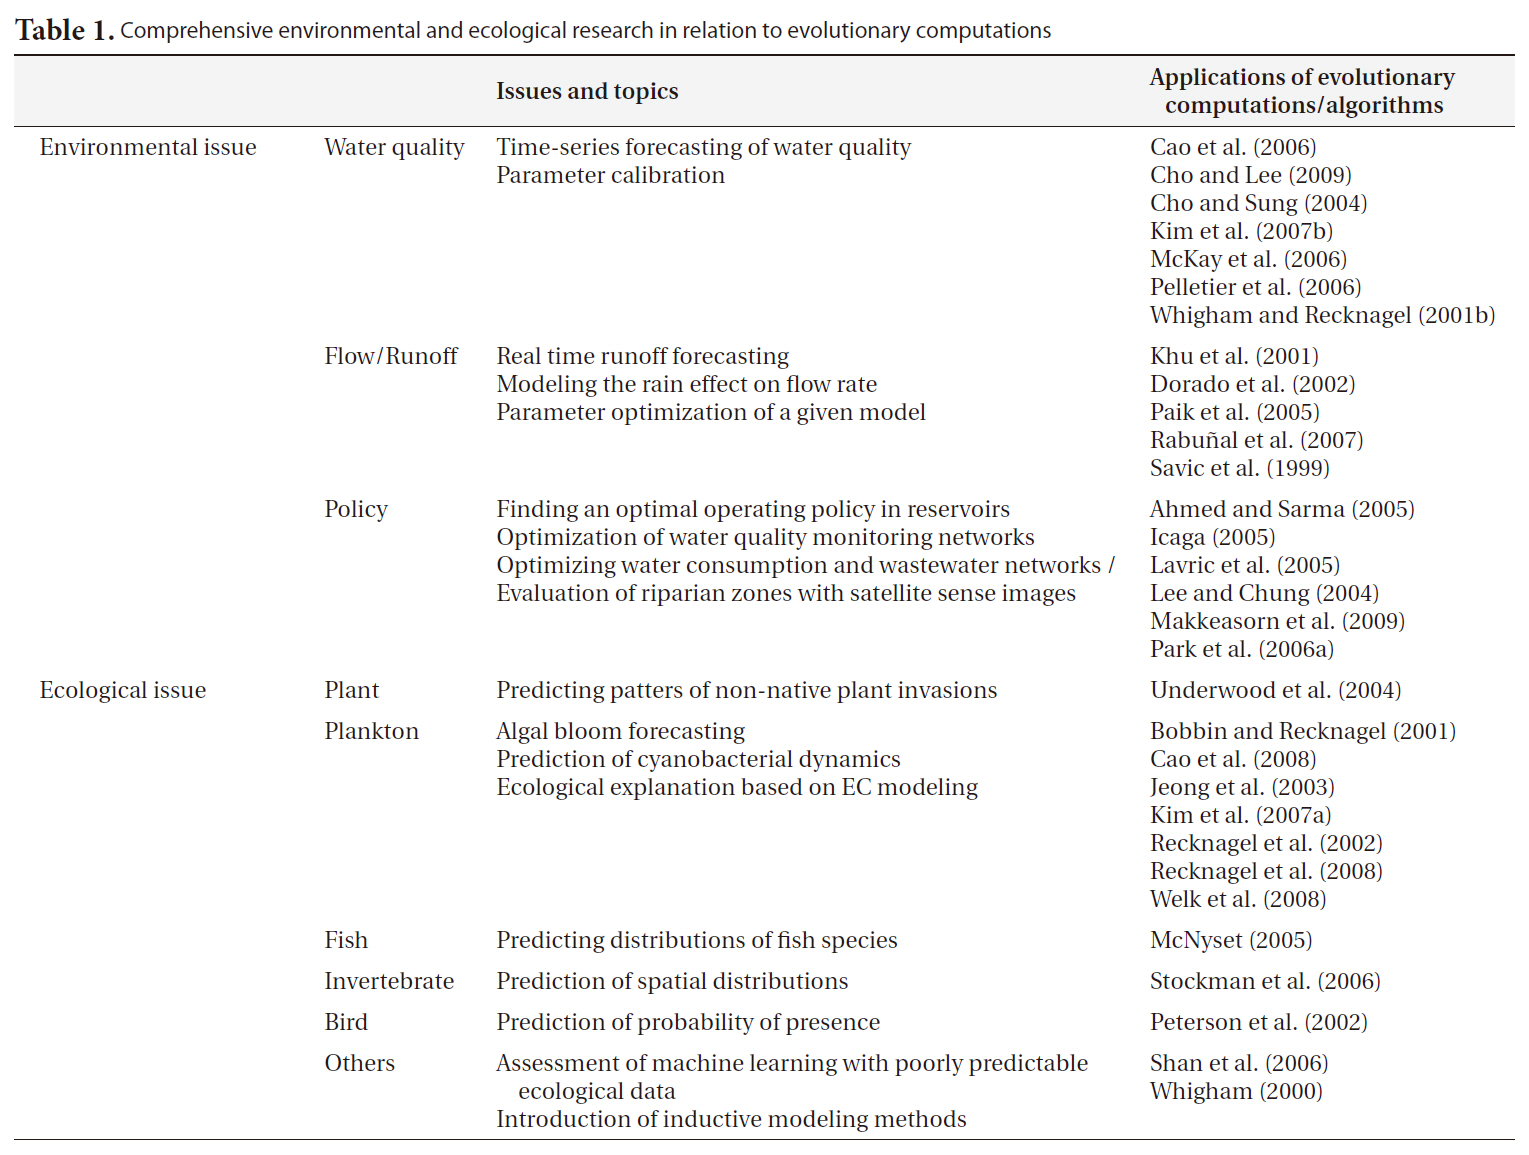
Comprehensive environmental and ecological research in relation to evolutionary computations
COMPARATIVE ADVANTAGES OF DIFFERENT MODELING APPROACHES
In assessing specific phenomena and ecological events, we must first gain insight into the properties of the different potential modeling methods. In this section, we compare the characteristics of each modeling method, delineating the advantages and disadvantages of the methods.
Statistical models and analyses are the most commonly used tools in many scientific disciplines. They are predicated on simple statistical relationships (generally correlations) between important parameters ? most often linear, commonly also polynomial or logarithmic, but always in a pre-defined simple form. MLR models have been broadly employed for the prediction of responses to independent effects. However, ecological datasets frequently contain many variables, particularly relative to the total number of instances; however, too many variables can conceal causal relationships, confusing attempts to extract them via automated methods. Thus, it has been known for some time that the limitation of classical statistical models to the extraction of linear relationships meant that these models might miss important nonlinear relationships in ecosystems (Lek et al. 1996, Jeong et al. 2003).
Mathematical mechanistic models are used to construct a representation of the ecosystem on the basis of known physical principles, most commonly the mass balance between various components within the ecosystem boundaries. In mechanistic models, it is important to model all relevant components within the system (otherwise, the assumption of mass balance may be invalid). Such models have been particularly favored for decision-making by managers and administrators in the field of water resource operations, owing primarily to the completeness of the models; this means that very flexible operation, extrapolating beyond the range of previous data, might prove possible. However, they commonly evidence very complicated architectures. As with statistical
[Table 2.] Comparison between conventional models and evolutionary computation
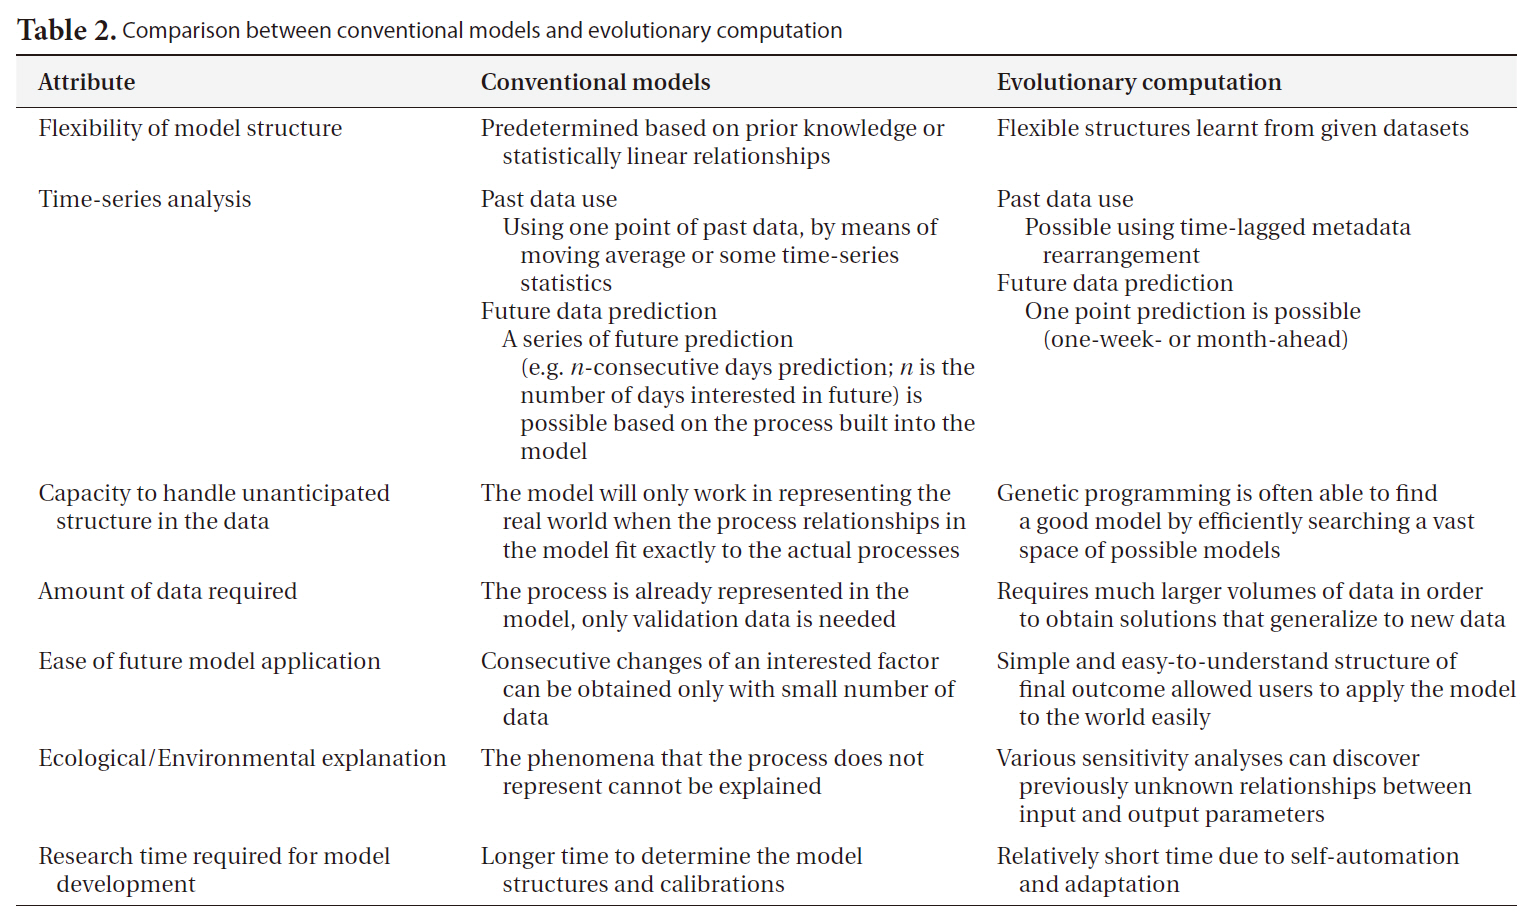
Comparison between conventional models and evolutionary computation
models, prediction uncertainty is apt to be large, owing to a lack of knowledge regarding the non-mass-balance components of the ecosystem. Generally, the prediction accuracy is not sufficiently high for practical applications. Thus, determining how to incorporate the benefits of mechanistic models, while dealing with the uncertainty and nonlinearity of ecological data, is one of the most important issues in the field of ecological modeling.
By way of contrast with the above methods, empirical computational models can be employed in constructing a representation of an ecosystem on the basis of the observed data. Their primary objective is usually to find the optimal model structure for the target ecosystem (‘best’ is usually taken to mean ‘lowest predictive error’) based on computations and reasoning from large quantities of data. The higher level of automation makes it feasible for end users to select and apply the most appropriate methods. In this regard, machine learning (ML) techniques are employed in order to extract information regarding the relevant interactions and relationships between environmental entities, through the optimization of a model to fit the target ecosystem. A major premise in this regard is that data is inherently noisy, and thus this noise may mask weaker relationships within the data, thus making the development of a perfect and complete ecosystem model impossible; these methods are premised on finding the best model justified by the specific data available. These methods are also thought to be particularly useful when the important relationships within the target ecosystem are not fully known, or are too complicated to represent in a model, or when the quantity and quality of the data are insufficient for the construction of a complete representation of the system (Table 2).
CASE STUDY: WATER QUALITY PREDICTION IN THE LOWER NAKDONG RIVER
>
Site description and methods
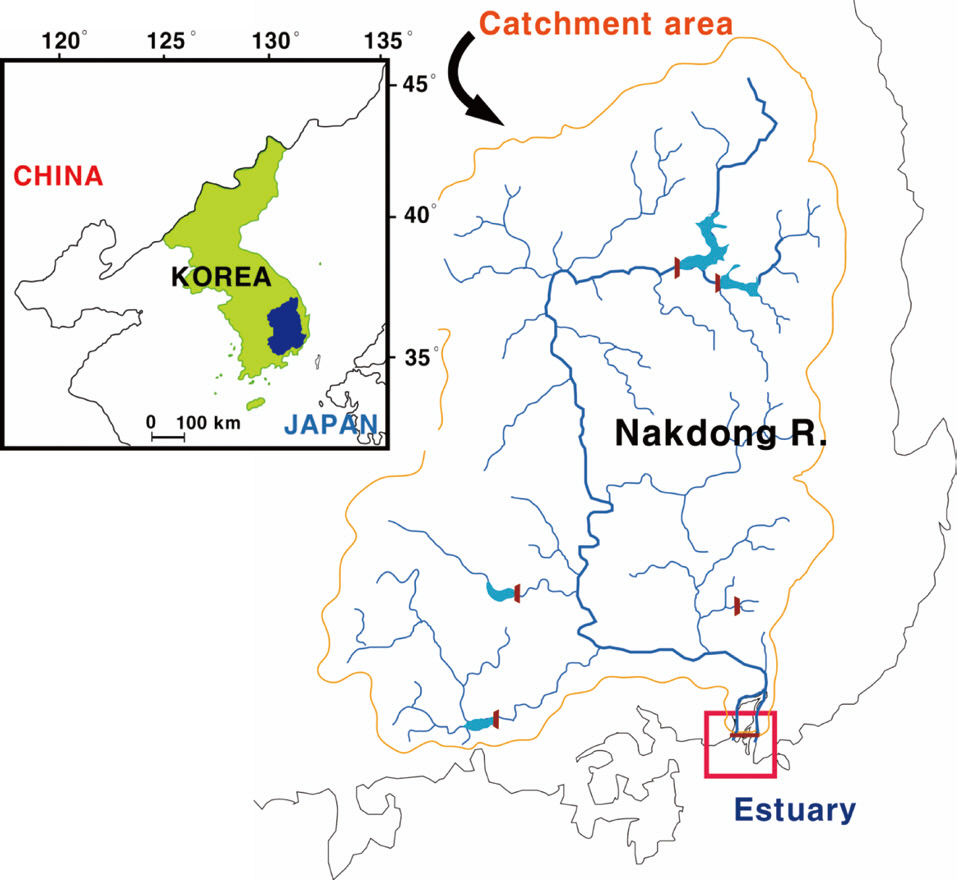
The study site (Mulgeum) was located within the lower part of the Nakdong River, the longest (ca. 525 km) river in South Korea (Fig. 3). The trophic state of the river is a persistent eutrophic level (chlorophyll a: 40 μg/L) throughout the year, except during the summer heavy rainfall season. Algal proliferations comprise two severe problems: 1) summer cyanobacterial blooms and 2) winter diatom blooms (Ha et al. 1999, Ha et al. 2003). Large populations of people also reside in this area, and thus demand for water resources availability is relatively high.
A total of 17 input variables were used to generate a one-week-ahead predictive GP model to forecast algal
abundance. Hydrological and meteorological data (flow rate, 4 dam discharges and rainfall) were acquired from the Korean Water Management Information System, and other data (water temperature, dissolved oxygen, pH, Secchi disc depth, conductivity, alkalinity, turbidity, nitrate, phosphate, silica and nitrogen:phosphorus ratio)
[Table 3.] Data used in evolutionary computation modeling (N = 782)
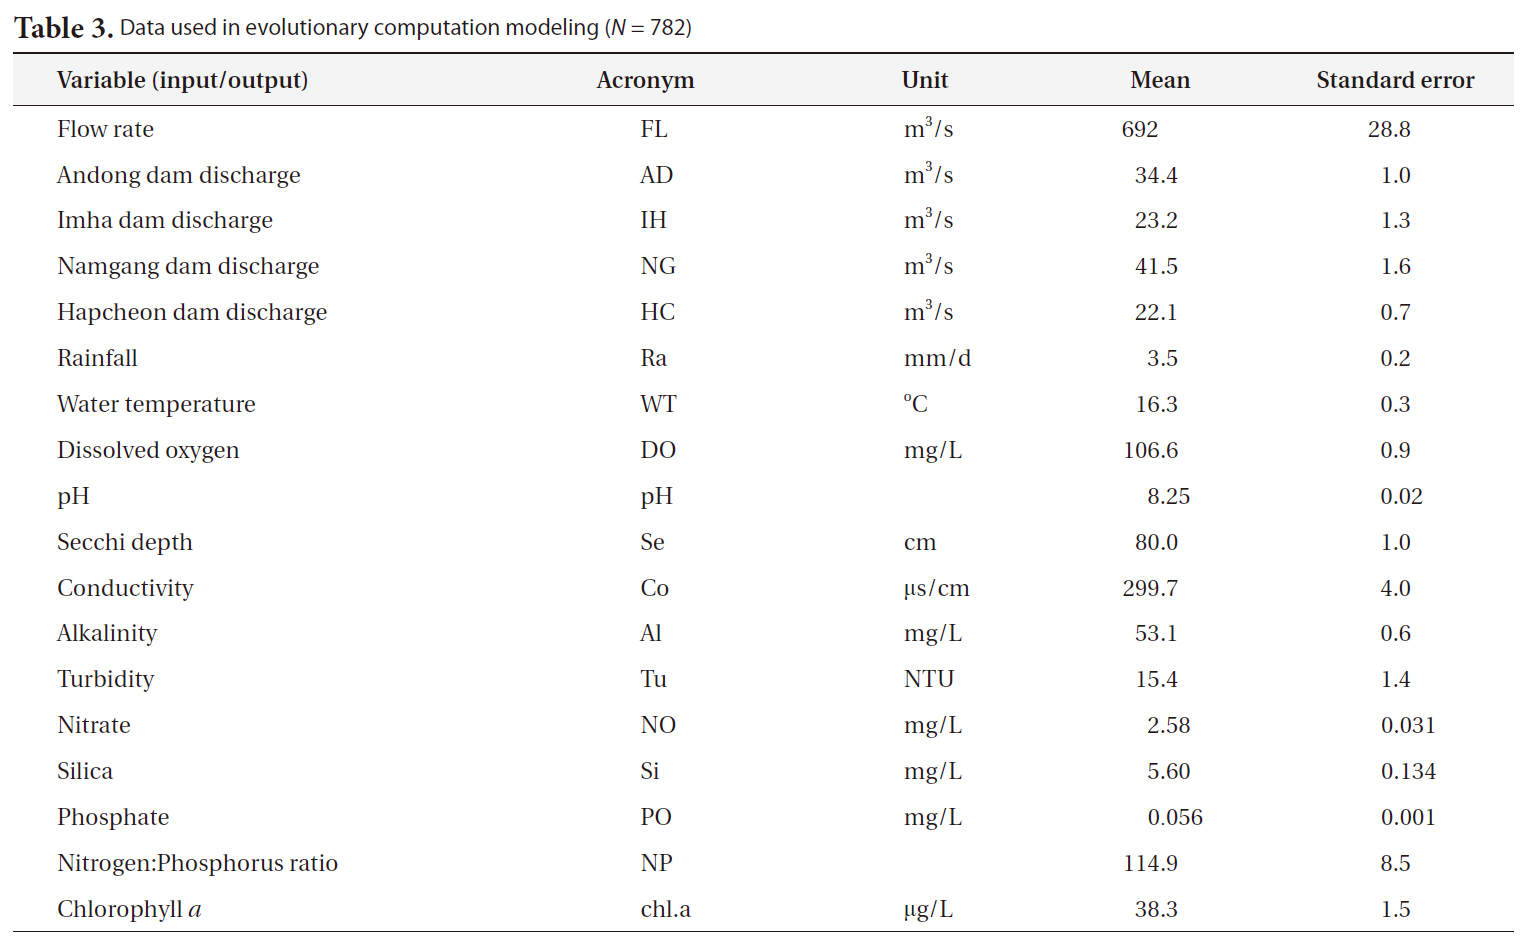
Data used in evolutionary computation modeling (N = 782)
were collected and measured via field sampling (Table 3). The concentration of chlorophyll a was employed as a proxy for algal abundance as the output measure. Data from 1994 to 2008 were used for model construction (N = 782).
In this study, we employed a GP program in the C++ language, which was originally designed by Cao et al. (2006). One key issue in this type of time-series prediction is how to allocate data to training and the testing of the model (the two need to be kept separate for fair validation). We employed 702 data instances for training, with the remaining 80 reserved for testing; the partition of the data was conducted using the bootstrapping method (Adams et al. 1997) per trial (200 runs) to avoid tedious k-fold cross-validation. The initial population size was fixed at 5,000, and the maximum tree depth (length of the model structure, i.e., limit on model complexity) was 5. The GP system was allowed to construct solutions however it liked using the standard arithmetic operators (+, -, *, \) along with the exponential and logarithmic functions, arithmetic relations (>, =, <) and the Boolean if then else construct. Each GP run continued for a total of 100 generations, for a total of 200 runs overall. The root mean squared error (RMSE) was used as the fitness function in this experiment.
The best predictive model was generated via selection by both RMSE and the determination coefficient (r2). The optimal model contained eight input variables, and was as follows:
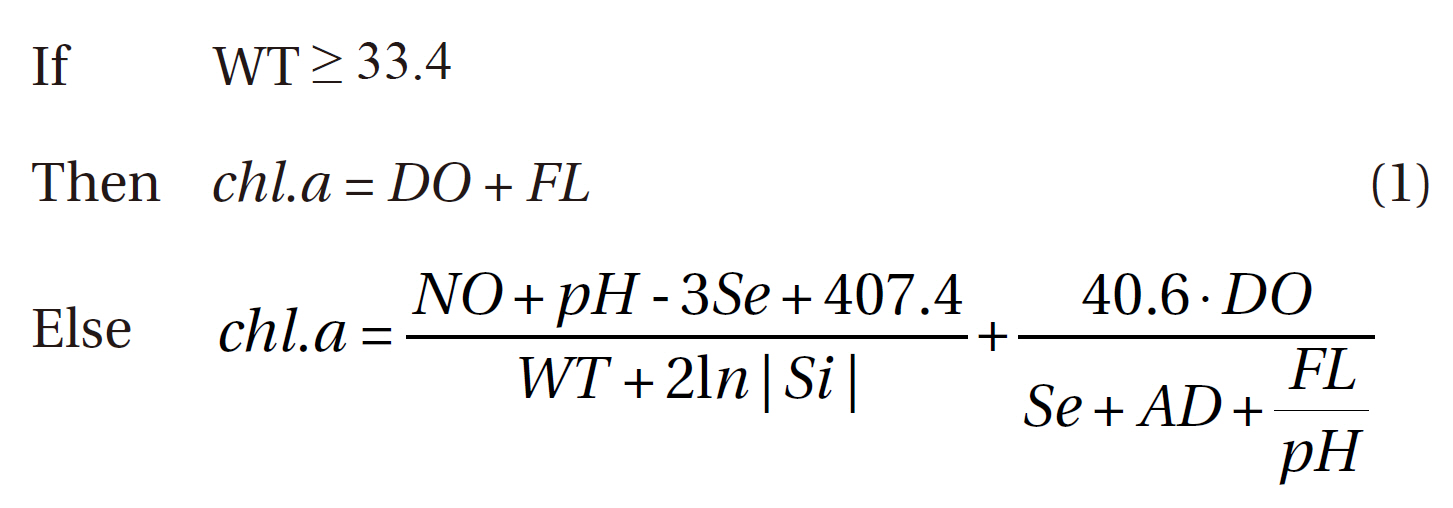
Where, WT: water temperature
chl.a: chlorophyll a
DO: dissolved oxygen
FL: flow rate
AD: Andong dam discharge
Se: Secchi disc depth
Among our conditional criteria, water temperature (WT) was selected, as the pattern of chlorophyll a concentration is affected profoundly by temperature. At high temperatures, rule-based expression was rather simple, whereas more complicated expression patterns were produced by GP for normal and lower temperature ranges.
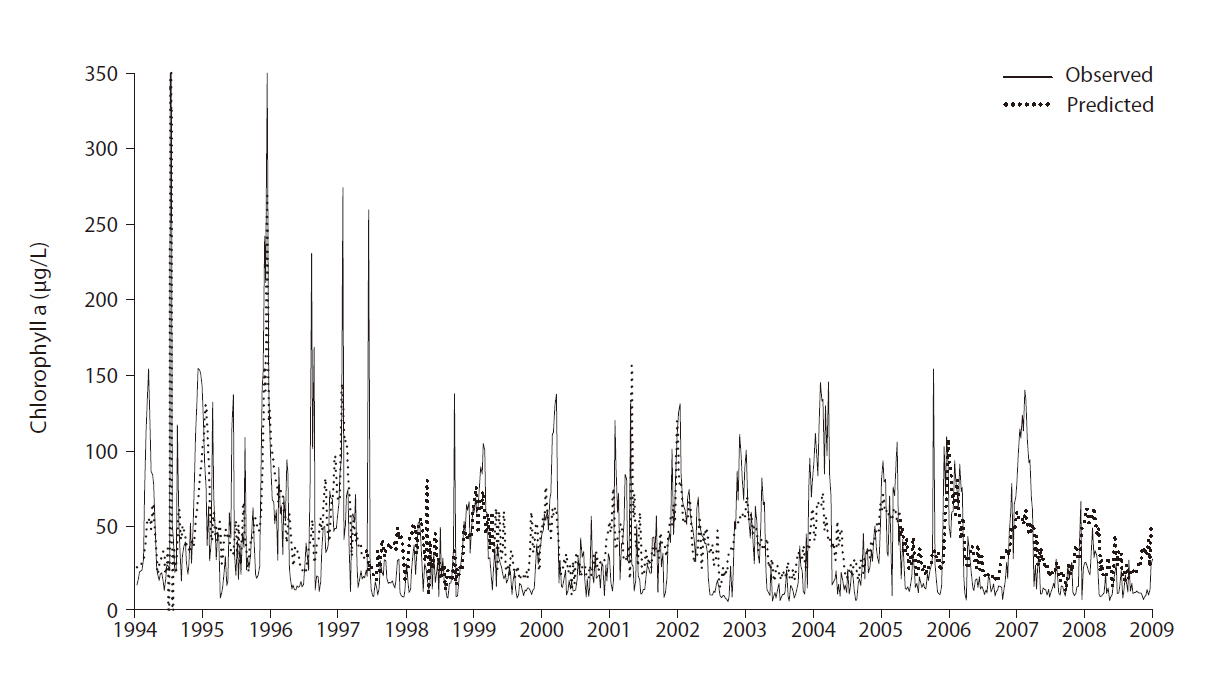
The overall prediction error was 31.32 (RMSE) with r2 = 0.45. Note that random data partitioning between the training and test was used. Fig. 4 shows the comparison between the observed and predicted values for chloro-
phyll
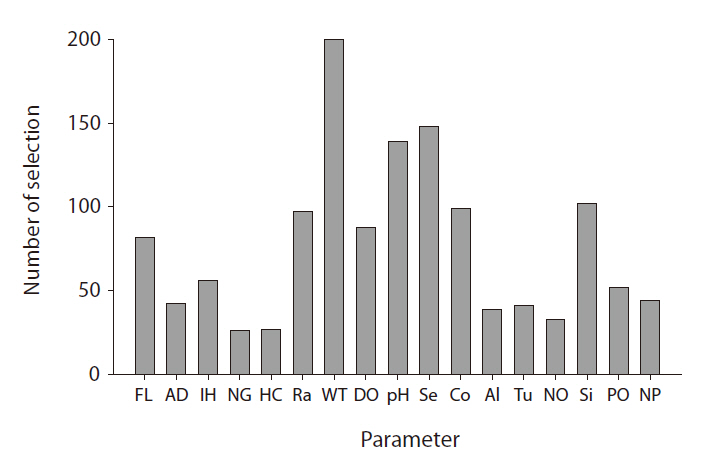
From the GP predictive models, we can observe that input variable selection provides important information. The frequency with which GP selects a variable in model construction is a good proxy for the degree of influence it exerts (Kim et al. 2007a). The selection frequencies for the different variables are quite diverse; their distribution is presented in Fig. 5. WT was most frequently selected, whereas pH and Secchi depth were also included in more than 50% of the models. In fresh water, these factors are highly influential on chlorophyll
concentrations result in increased algal biomass. Kilham et al. (1986) previously stressed that
With regard to predictability, the most significant issue is how to acquire larger quantities of higher quality data. The data quality issue is related directly to how we can obtain data from stable analytical methodologies (i.e., high consistency in monitoring and measuring). In addition to the qualitative issue, empirical models such as EC require large quantities of data for data learning/training ? perhaps larger quantities than are required for other methods. A great deal of time may be required to gain sufficient data using traditional methods, but we anticipate that the rapid development of ecological monitoring and analysis systems will help to remedy this problem before too long. Data cleaning is a favorable option not only for the extraction of potentially useful information, but also for the removal of outliers and noise from data. Consequently, it should prove possible to reduce predictive errors through the appropriate data cleaning techniques.
APPLICABILITY OF INTEGRATED MODELS IN FUTURE ECOSYSTEMS RESEARCH
In ecological research, data accumulation is accelerating precipitously, as the measuring equipment used for ecosystems is under rapid and continuous development. A broad variety of tools and techniques for the analysis and assessment of ecological properties are continuously being created and deployed. Although we introduced a variety of analytical methodologies and categorized them, we are currently unable to pre-determine a specific framework of modeling approaches for a particular range of ecosystems. Each modeling approach has some useful properties for the analysis of a target ecosystem, which may prove valuable in the interpretation and understanding of that ecosystem. For instance, in a comparison between linear (PCA and correspondence analysis) and nonlinear methods (self-organizing map, SOM), it may prove desirable to employ nonlinear methods in ecological patterns to prevent horseshoe (PCA) and arch effects (CA), but alternatives such as SOM do not allow for the control of gradient directions (Giraudel and Lek 2001). Consequently, a combination or fusion of analytical techniques is desirable, particularly in the patterning and clustering of the structures of ecosystem populations and communities.
The applicability of different modeling methodologies is a matter under continual discussion, regardless of whether deductive or inductive approaches are employed. Previously, conventional modeling techniques involved a variety of standardized mathematical and stochastic methods, such as differential equations, multivariate statistics, and regression models, whereas recent modeling approaches have been biased toward heavily computational models based on data warehousing and biologically inspired algorithms (Dolk 2000, Recknagel 2006). Additionally, a few ecological scientists have reported some promising results via hybrid approaches. Hybrid evolutionary algorithms, in which rule sets and algebraic equations define the model architecture but the content is selected via evolution, have been employed in the prediction of chlorophyll
In studies of South Korean freshwater ecosystems, ecological scientists have undertaken only a limited amount of modeling via comparison with the data of hydrological engineers. Thus far, the majority of such research has been biased toward specific analysis methods, particularly statistically based approaches (Yoo 2002, An et al. 2006, Kim et al. 2007c). Mechanistic models have been employed in a few applications, and these have focused principally on pollutant transportation (Shim et al. 1995, Park and Lee 2002). However, these models regarded the physicochemical impacts as more important than the biological influences. However, in the lakes and regulated rivers of South Korea, grazing activity by zooplankton is a critical component in determining water quality during the dry winter period (Kim et al. 2000). Although the modified QUAL2E (QUAL-NIER) incorporated 31 variables in the model, zooplankton activity is not one of them (Choi et al. 2008). Comparatively, in regard to the use of empirical modeling approaches, only a few ML techniques have been applied thus far to the prediction of population and community dynamics in stream and river ecosystems (Chon et al. 2000, Jeong et al. 2006); the numbers of such studies are relatively small compared to other countries
This imbalance in model application may limit future scientific research. Thus, interdisciplinary collaborations may prove an effective solution for understanding and improving ecological modeling. In turn, the development of better ecological models is expected to allow for the development of effective and efficient strategies for water resource management.