The water quality from nonpoint source run off results from different land use types has been studied. The construction of a buffer strip is one method of nonpoint source pollutant control. The Soil and Water Assessment Tool (SWAT) model has been applied to estimate the pollutant removal through the buffer strip. When the non-business land has been changed into grass to form a buffer-strip, the change of land use effects the results of the model according to measures of the water quality. The data from a water level station within the watershed in the years 2006 and 2007 was used for calibration and validation of the model. Under the rainfall conditions in 2007,the removal rates of SS, BOD, TN, TP were 11.5%, 9.5%, 1.2%, and 4.5%, respectively. During the rainy days, the removal rates at the buffer strip were 92.3% of SS, 91.2% of BOD, 82.4% of TN, and 83.5% of TP. The pollutants from nonpoint sources were effectively removed by over 80% as they passed through the buffer strips. Rainfall resulted in soil erosion, which led to an increase in the SS concentration,therefore, the construction of buffer strips protected the streams from SS inflows. Since TN concentrations are affected by the inflows of ground water and the N concentration of the rainfall, the removal rate of TN was relatively lower than for the other pollutants.
The water quality in artificially constructed reservoirs has been considered with the aim of the control of point source pollutants.The pollutants from nonpoint sources would not have previously been controlled to improve the water quality. However,the pollutants from these nonpoint sources have recently been the focus of work on the improvement of the water quality.Yongdam reservoir was constructed to supply drinking water to the Jeonju city area in 2001. As a result of poor water quality measures from the watershed of the Yongdam reservoir, within the Geum River basin, buffer strips were constructed around the reservoir and new constructions was excluded within these buffer strips. This policy was the turning point in the control of the nonpoint source and the point source pollutants in Korea [1].
The role of buffer strips in the U.S. has been studied in order to improve the water quality. Land clearing activities, such as agriculture,construction and forest harvesting, result in erosion,sediment loads and chemical oxygen demand [2]. As the nonpoint source runoff varies with the land use type, the water quality has been studied for the different land use types. Borin and Bigon [3] studied the removal of nitrogen by plants and Mersie et al. [4] researched the runoff and removal of pollutants for two different types of plants. Additionally, Leeds-Harrison et al. [5]reported the nitrogen removal for the grasses found in the buffer strips.
In Korea, many studies have been started on the role of the buffer strips in water quality since 2000. Since the Agricultural Nonpoint Source Pollution (AGNPS) model was developed for rural and agricultural piedmont watersheds, this model has been used many times to analyze the land use change scenarios in South Korea. For instance, the AGNPS model was used to simulate the construction of the plant area and was used with GIS to set the boundary conditions for the buffer strips [6, 7]. The proper width of the buffer strips to control the pollutants was also estimated with this model [8]. Soil and Water Assessment Tool(SWAT) was developed for the simulation of long-term and large scale scenarios with various land-use patterns [9]. This model can simulate the hydrology with the water quality [10] and is a very powerful tool for the control of point and nonpoint sources[11]. Additionally, this model has been applying the simulation of the pollutant removals with Best Management Practices(BMPs) as an integrated model [12-15]. SWAT is applicable from a small watershed to a large scale watershed including a multipurpose dam [16].
In this study, the SWAT model was used to simulate the water quality with the change of the pattern of land use in the upper region of the Yongdam reservoir.
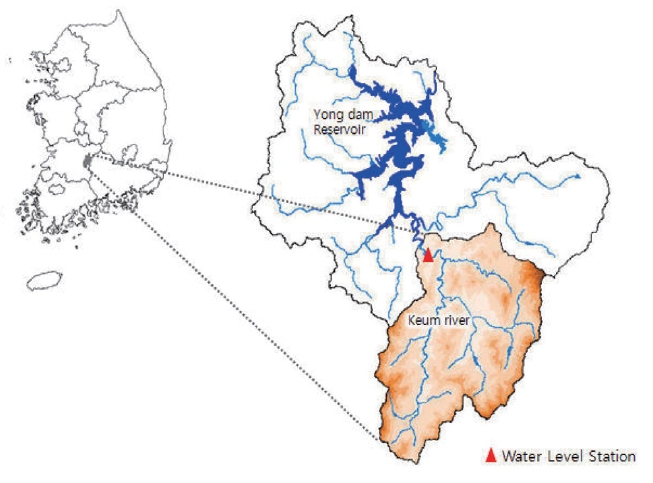
The Yongdam reservoir covers parts of Jinan and Jangsu Provinces,with a watershed area of 930 km2. The reservoir capacity is 815 million m3, making it the 5th largest reservoir in South Korea. The study area was in the upper region of the Yongdam reservoir which was digitally mapped from the source of the Geum River to the inlet of the Yongdam reservoir. The study area
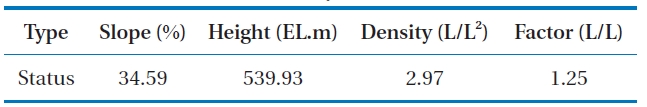
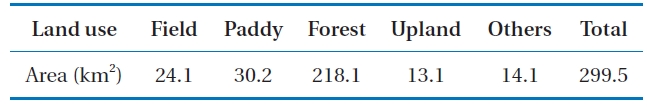
[Table 1.] Characteristics of the study area

Characteristics of the study area
covered 299.5 km2, with a stream length of 18.6 km. The characteristics and the land use patterns in the watershed are shown in Tables 1 and 2.
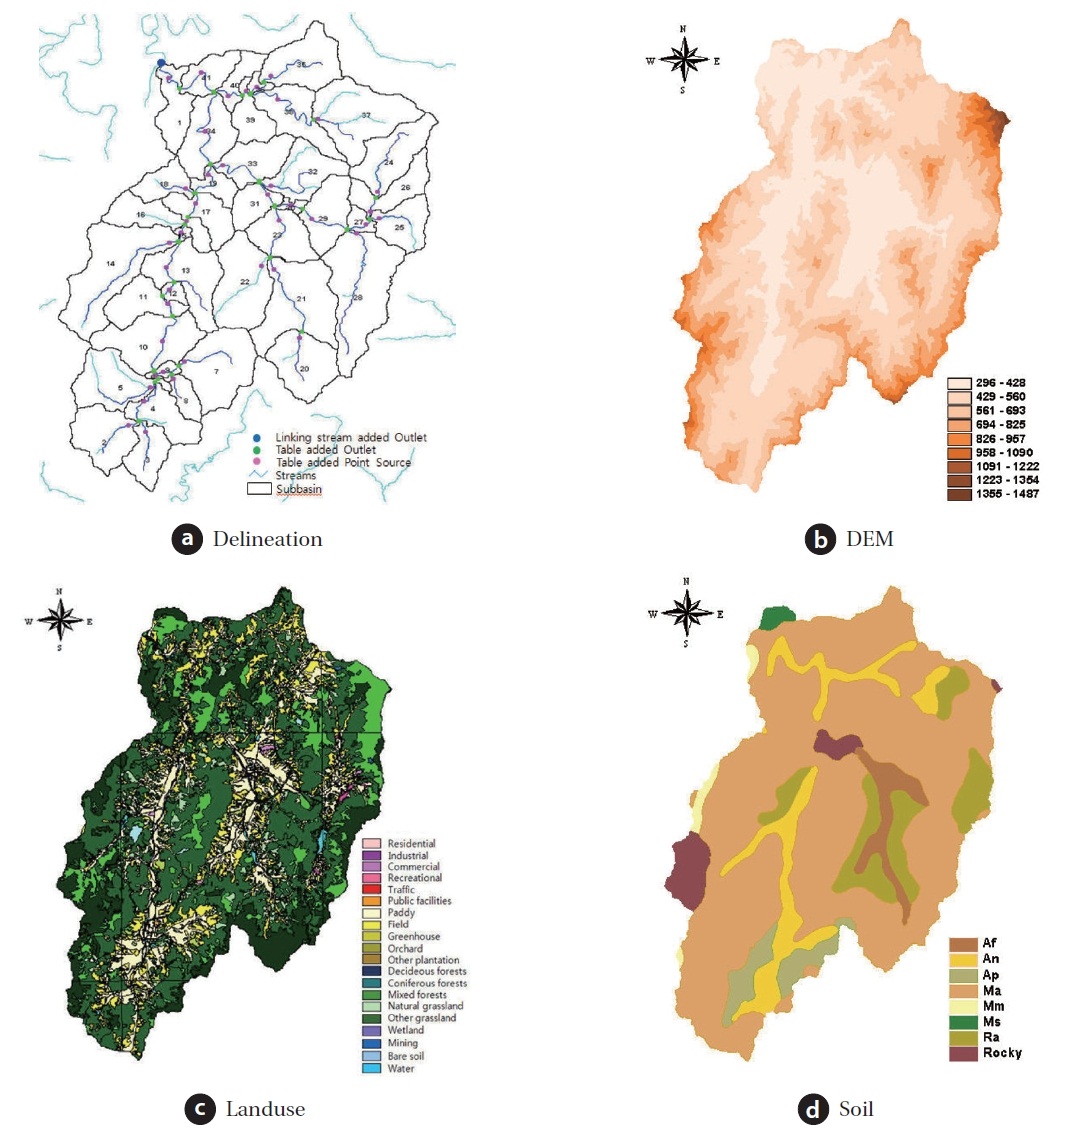
The contour lines were made using 30 X 30 m DEM in Arcview with a map scale of 1:25,000. This data can be utilized to set the boundaries for the small watersheds in the SWAT inputs.The threshold area input for the small watershed in the SWAT was 91 (The maximum number of threshold area input for the small watershed in the SWAT was 91).
and this provided the network of streams by utilizing the flow directions and flow accumulations. Geographical input data
[Table 2.] Land use pattern in the study area
Land use pattern in the study area
was for the small watersheds within the SWAT model, with such entries as areas, slopes, the lengths and width of streams and so on. Soil maps from the National Academy of Agricultural Science were utilized to find the soil information. Additionally, land use data was provided from the LANDSAT data of the Ministry of Environment, Republic of Korea. The runoff and the evapotranspiration were simulated using meteorological data such as the rainfall, wind velocity and temperature. This data was provided
by 5 meteorological stations adjacent to the study area. Daily meteorological data was used from January 1, 1996 to December 31, 2008. Fig. 1 shows the geographical DEM, land use patterns and soil maps within the study areas.
2.3. Runoff and Water Quality Measurements
The runoff and water quality were measured for calibration and validation of the model. The water level stations used are shown in Fig. 2 and the daily runoff data was also supplied from these stations. The Geum River environment research center had analyzed the water quality 30 times at that point [17]. The measurement data from 2007 was used for the model calibration.The runoff and water quality in 2006 were used to verify the model.
3.1. Calibration and Validation
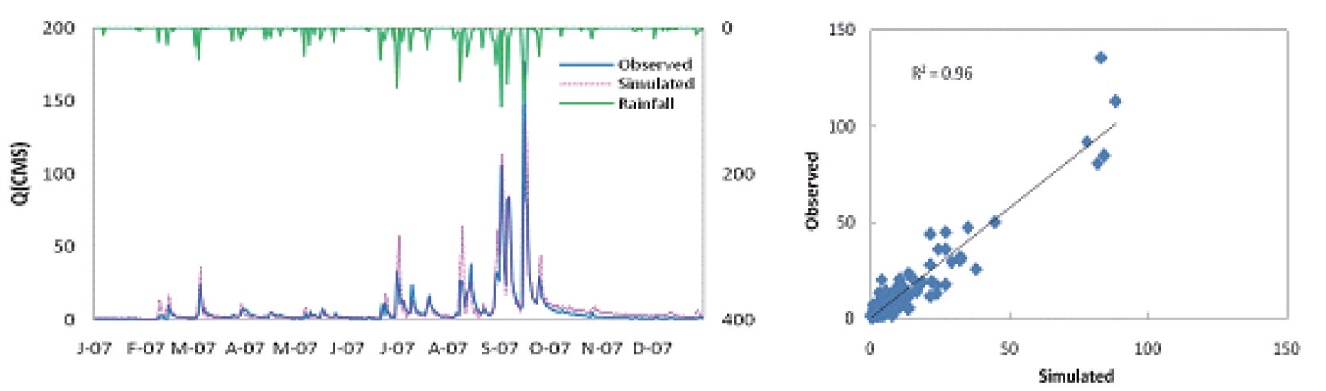
3.1.1. Runoff
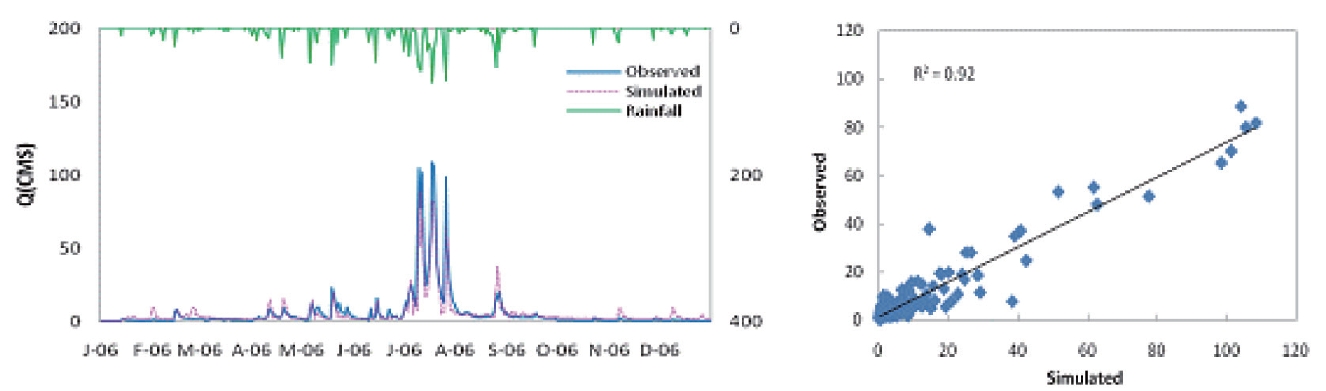
The data from the water level station within the watershed in 2007 was used for the calibration of the model. The R2 value of the runoff calibration was estimated to be 0.96 (Fig. 3). The results of the runoff validation in 2006 led to an R2 value of 0.92(Fig. 4) . The simulation data was therefore similar to the measurement data.
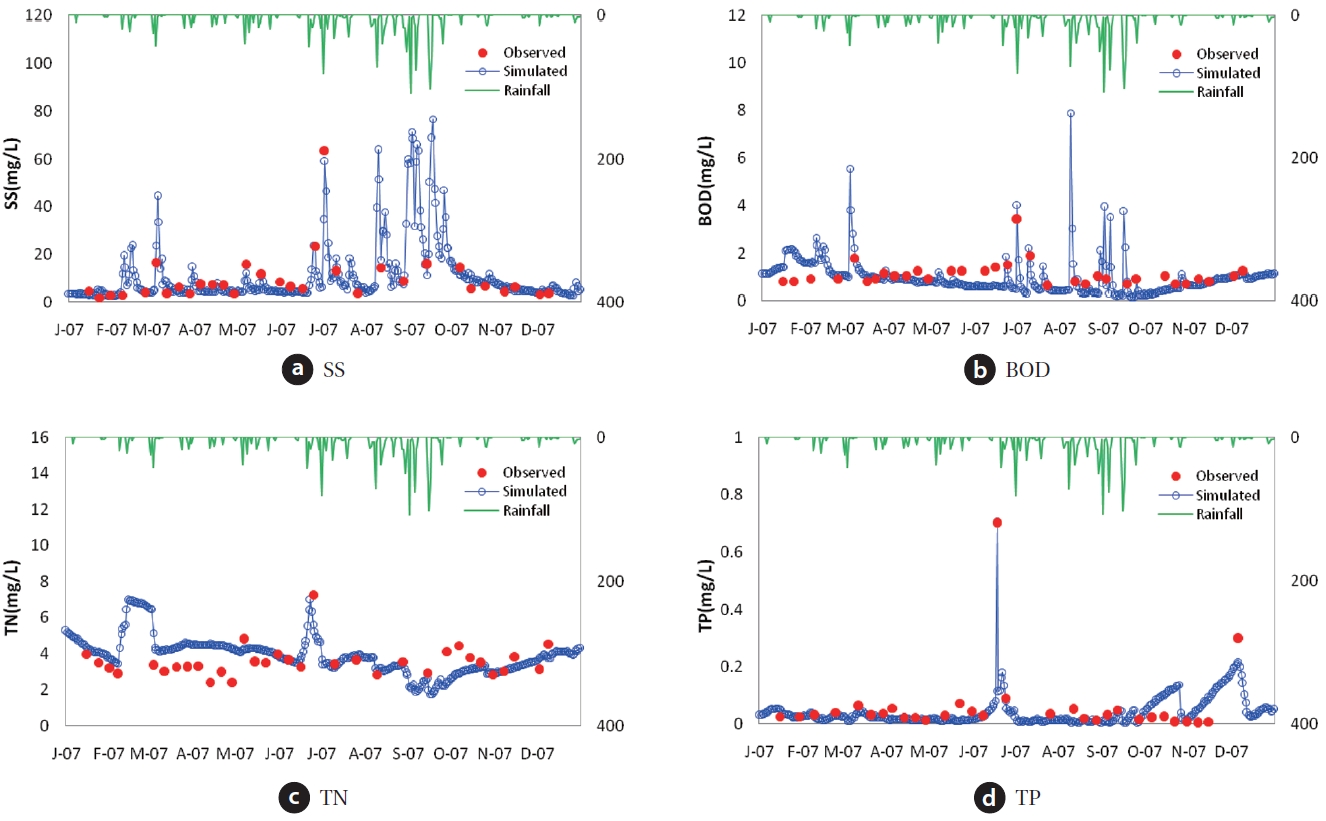
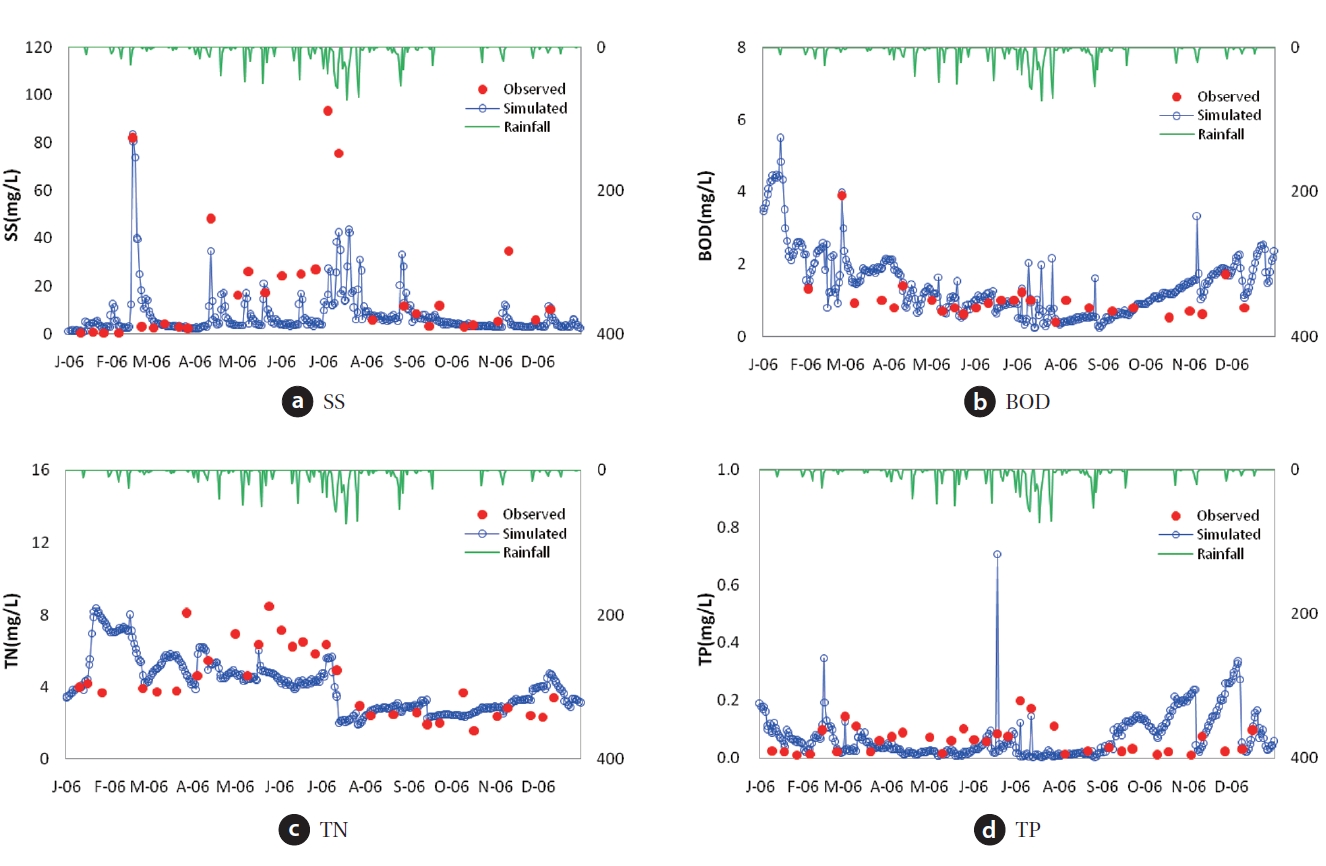
3.1.2. Water quality
The SS was chosen as the first calibration parameter, followed by BOD, TN and then TP. Since the SS content is influenced by the sedimentation, the SS data was calibrated with the measurement data during periods of rainfall. The other outputs such as BOD, TN, TP were calibrated with adjustments to the coefficients.The calibration results for R2 showed 0.91 of SS, 0.59 of BOD, 0.42 of TN, and 0.90 of TP (Fig. 5). However, the validation of the water quality parameters resulted such that R2 presented 0.49 of SS, 0.72 of BOD, 0.22 of TN, and 0.26 of TP (Fig. 6). There was a difference between the calibration and validation data,but the pattern of the water quality in the simulation was similar to that found in the measurement data.
3.2. The Removal Rates of Nonpoint Source Pollutants in the Buffer Strips
3.2.1. The status of buffer strips in the study area
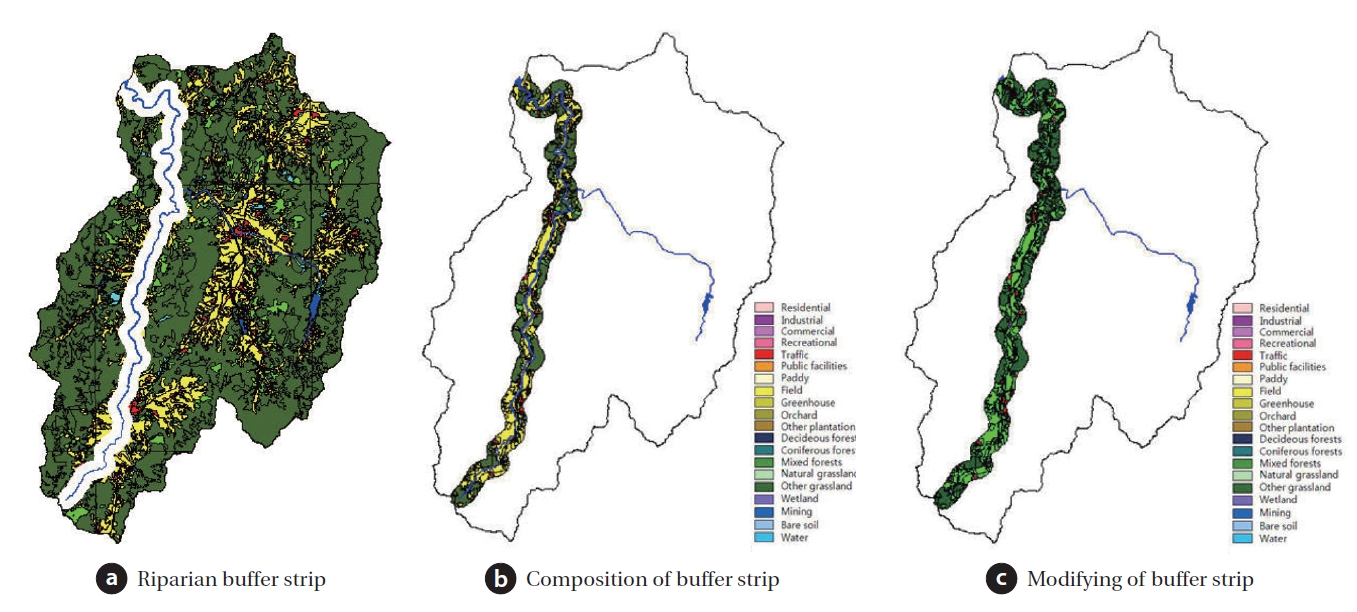
The objectives of the study were to estimate the removal rates for nonpoint source pollutants in the buffer strips. Generally, the watershed can be characterized by the hydrologic response unit(HRU) and the removal of pollutants can be predicted by the digitized watershed based on the HRU [18]. In this study, the watersheds were digitized on the assumption that the buffer strips are constructed 500 m from the banks along the rivers. The create buffer function in ArcView GIS 3.2a was utilized for the construction of the buffer strips, see Fig. 7. The buffer strips were constructed to exclude the sewage treatment areas, urban areas,the limit areas of construction and military protection areas. The capacity for pollutant removal is shown for the various types of land use in Fig. 7. The land use pattern was changed under these assumptions (Table 3). Excluding the construction of the buffer strips, woodland areas were not changed within the study areas and the agricultural areas were changed into grass areas. The SS,BOD, TN, and TP in the SWAT model were simulated with the consideration of land use pattern changes.
3.2.2. Simulation Results of Pollutants Removals
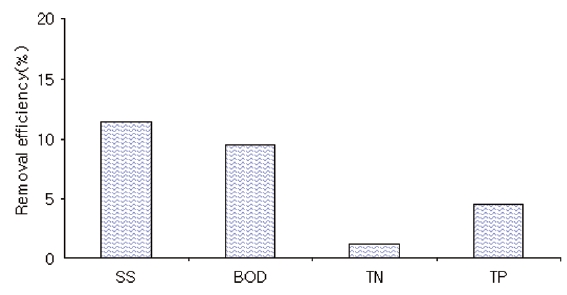
The removal rates for the pollutants in the buffer strips were estimated using the runoff and nutrients by comparisons with before and after the buffer strips construction. The results for the pollutant removal are shown in Table 4, Figs. 8 and 9.
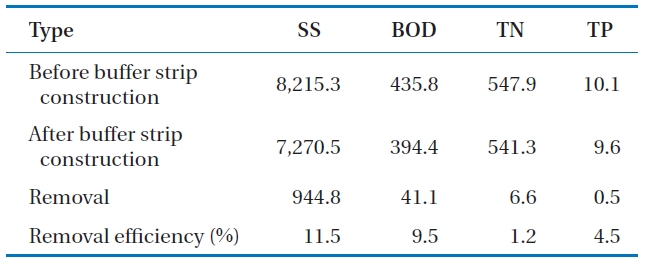
The removal rates were 11.5% of SS, 9.5% of BOD, 1.2% of TN, and 4.5% of TP. Table 4 shows the nonpoint source pollutant inflows into the stream during the rainy days. Therefore, the
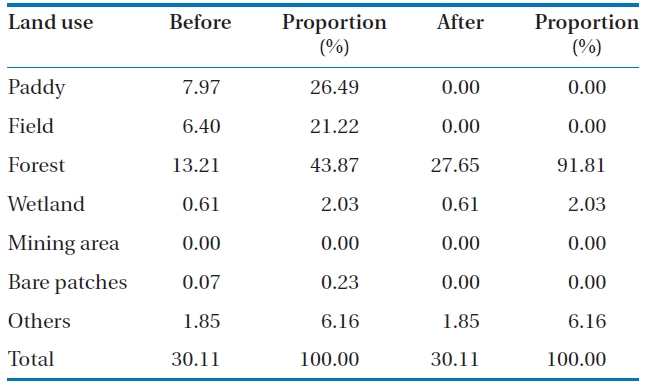
[Table 3.] Land use pattern of buffer strips in the study area

Land use pattern of buffer strips in the study area
[Table 4.] The pollutant removal efficiencies in the buffer strip

The pollutant removal efficiencies in the buffer strip
[Table 5.] The pollutants removals based on the dry and rainy seasons
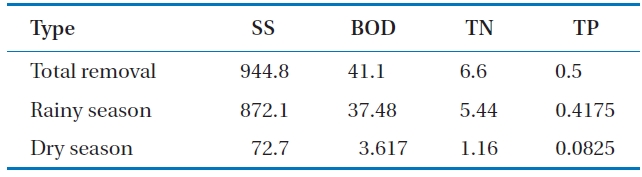
The pollutants removals based on the dry and rainy seasons
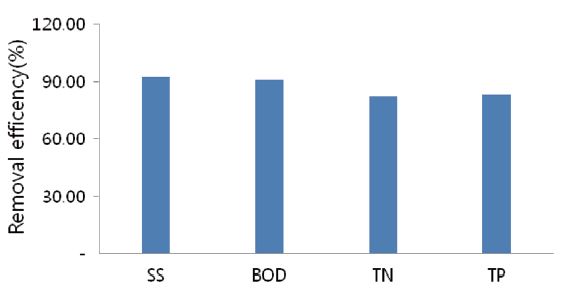
landremovals were considered with the classifications of rainy and dry seasons. During the rainy days, SS was removed at a rate of 92.3% or 944.8 ton/yr due to the buffer strips. On the same rainy days as the SS removal was calculated, the removal of BOD, TN,and TP were 37.4, 5.44, and 0.42 ton/yr, respectively as seen in Table 5. The role of the buffer strips was for the effective removal of pollutants during the rainy days. It can be seen however that the removal rate of TN was lower relative to the other pollutants,this is because the TN concentration is influenced by the inflows of TN in the ground water and by the N concentration of the rainfall [19, 20]. The SS was effectively removed by the decrease of the surface flow and the protection from sediment inflows,although the area of the buffer strips was not big enough to remove the SS. Buffer strips fulfilled the role of protection of the soil from erosion.
Dosskey et al. [21] also reported that the buffer strips performed the function of reduction of the runoff flow and the control of soil loss. In this study, the functions of buffer strips are related to the reduction of the suspended solids and water pollutants.
To protect streams from the direct inflow of pollutants, buffer strips were constructed to improve the water quality with the aim of self purification in the streams. The buffer strip construction was designed along 18.6 km of stream in the upper region of the Yongdam reservoir. The SWAT model was used to simulate the areas from the source of the Geum River to the inlet of the Yongdam reservoir. The final conclusions of the model simulation with the change of land use were as follows:
1) If the buffer strips were constructed to the study assumptions,removal rates were expected to be 11.5% of SS, 9.5% of BOD, 1.2% of TN, and 4.5% of TP under the rainfall conditions of 2007. The outputs were provided with the annual meteorological data. Thus, the simulation data should be considered in the rainy season, since the nonpoint source runoff resulted in a peak discharge due to the rainfall. During the rainy days, most water quality parameters were improved with over 80% of total pollutants removed, with 92.3% of SS removed, 91.2% of BOD removed, 82.4% of TN removed, and 83.5% of TP removed.
2) Rainfall resulted in soil erosion and led to an increase in the SS concentration. Thus, the construction of the buffer strips protected the SS inflows into the streams.
Since TN concentrations are affected by the inflows of ground water and the N concentration of the rainfall, the removal rate of TN was lower relative to the other pollutants.