In this study, a series of experiments was conducted on the relative degradation of commonly known endocrine-disrupting compounds such as bisphenol A (BPA) and 17α-ethinyl estradiol (EE2) in a single-component aqueous solution using 28 and 580 kHz ultrasonic reactors. The experiments were conducted with three different types of model water: deionized water (DI), synthetic brackish water (SBW), and synthetic seawater (SSW) at pH 4, 7.5, and 11 in the presence of inert glass beads and humic acids. Significantly higher sonochemical degradation (93?97% for BPA) occurred at 580 kHz than at 28 kHz (43?61% for BPA), regardless of water type. A slightly higher degradation was observed for EE2 compared to that of BPA. The degradation rate of BPA and EE2 in DI water, SBW, and SSW after 30 min of ultrasound irradiation at 580 kHz increased slightly with the increase in pH from 4 (0.073?0.091 min-1 for BPA and 0.081?0.094 min-1 for EE2) to 7.5 (0.087?0.114 min-1 for BPA and 0.092?0.124 min-1 for EE2). In contrast, significant degradation was observed at pH 11 (0.149?0.221 min-1 for BPA and 0.147?0.228 min-1 for EE2). For the given frequencies of 28 and 580 kHz, the degradation rate increased in the presence of glass beads (0.1 mm and 25 g) for both BPA and EE2: 0.018?0.107 min-1 without beads and 0.052?0.142 min-1 with beads for BPA; 0.021?0.111 min-1 without beads and 0.054?0.136 min-1 with beads for EE2. A slight increase in degradation of both BPA and EE2 was found as the concentration of dissolved organic carbon (DOC, humic acids) increased in both SBW and SSW:0.107?0.115 min-1 in SBW and 0.087?0.101 min-1 in SSW for BPA; 0.111?0.111 min-1 in SWB and 0.092?0.105 min-1 in SSW for EE2. After 30 min of sonicating the humic acid solution, DOC removal varied depending on the water type: 27% (3 mg L-1) and 7% (10 mg L-1) in SBW and 7% (3 mg L-1) and 4% (10 mg L-1) in SSW.
Over 1 billion people do not have access to clean drinking water, and approximately 2.3 billion people (40% of the world population) live in regions with water shortages [1]. The exploitation of natural freshwater resources combined with increasing water demand has given rise to a demand for alternative freshwater resources. Both desalination and water reuse have been successfully implemented to provide additional freshwater for communities, using conventional water treatment and freshwater resources [2, 3]. A great share of the world’s desalination capacity is installed in the Middle East, and although reverse osmosis(RO) is rapidly gaining market share, thermal processes still dominate the market in this region due to the low cost of fossil fuel-based energy and the advantage of using such systems to generate electrical energy (cogeneration of steam and electricity) [4].
There are still several limitations for using an RO membrane to treat seawater or brackish water. Inorganics and organics present in water can adhere to the surface and pores of highpressure membranes used for RO and nanofiltration (NF), which results in a deterioration in performance (i.e., membrane flux decline) of the membrane accompanied by a consequent increase in the energy cost and early membrane replacement [5].One of the major problems encountered in seawater and brackish water treatment using RO and NF membranes is membrane fouling associated with natural organic matter (NOM). NOM is always problematic in the water industry, as it acts as a precursor for the formation of disinfected by-products. Humic substances,which are anionic macromolecules with a wide range of molecular weights, comprise a major fraction of NOM in aquatic environments. Humic substances contain both aromatic and aliphatic components with primarily carboxylic (carboxylic functional groups account for 60?90% of all functional groups) and characphenolic functional groups [6].
Additionally, emerging micropollutants, including endocrine disrupting compounds (EDCs), have become an issue for wastewater reclamation and seawater treatment. Numerous recent studies have shown that conventional wastewater treatment plants do not completely remove many EDCs and pharmaceuticals and personal care products (PPCPs) [7-9]. These EDCs and PPCPs have been detected at trace concentrations(i.e., <1 μg/L) in waters around the world. EDCs, including bisphenol A (BPA),
BPA and EE2 are relatively polar compared to currently regulated polyaromatic contaminants. This, coupled with their occurrence at trace levels (<1 μg L-1), creates unique challenges for analytical detection and assessment of removal performance by potable water treatment plant processes [11]. The analytical determination of BPA and EE2 from surface and wastewater commonly uses gas chromatography-mass spectrometry (GC-MS or MS/MS) [12, 13], liquid chromatography-mass spectrometry(LC-MS or ?MS/MS) [14], and biological assays [15, 16] following solid-phase extraction. In a separate study, a simple analytical technique for rapidly determining BPA and EE2 in drinking water matrices was developed using high-performance liquid chromatography (HPLC) with fluorescence detection [17].
It is necessary to pretreat feed water using RO and NF membranes to lower undesirable fouling materials, including NOM and micropollutants (e.g., EDCs); this is because poor feed water quality leads to a short RO and NF membrane lifetime, short operation period, and high maintenance. Various technologies have been investigated to remove these NOM and EDCs from water and/or wastewater, including biological degradation[18-20], activated carbon adsorption [21-23], and membrane filtration [24-26]. Advanced oxidation processes such as ozone, ozone/ultraviolet (UV), ozone/ultrasound, and UV/hydrogen peroxide (H2O2) play an important role in the removal of NOM and EDCs and are also promising technologies for water and/or wastewater treatment [27-29]. However, chlorination and ozonation increase the estrogenic activity of BPA and EE2 as determined using a human breast cancer cell line (MCF-7) [15]. Sonochemical processes that enhance or promote chemical reactions are an attractive advanced technology for organic contaminant removal from water and wastewater. The process of sonocatalytic degradation has significant advantages because it is easy and safe to operate and produces a minimal amount of toxic byproducts. In general, the sonochemical degradation of pollutants in an aqueous phase occurs as a result of imploding cavitation bubbles and generally involves two reaction pathways, such as pyrolysis inside the bubble and/or at the bubble-liquid interface,and hydroxyl radical-induced reactions at the bubble-liquid interface and/or in the liquid bulk [30]. A previous study has shown effective NOM removal by ultrasonic irradiation [31]. Sonochemical treatment has good potential for degrading organic contaminants, including EDCs and pharmaceuticals [32, 33].However, these studies were still limited to very low background conductivity in the absence of NOM. Therefore, a degradation assessment for both seawater and brackish water would be useful to investigate the NOM and EDC degradation mechanisms.
The objective of this study was to investigate the degradation of EDCs during sonochemical reactivity with synthetic seawater(SSW) and synthetic brackish water (SBW). To accomplish this, sonodegradation of widely known EDCs (i.e., BPA and EE2)was measured at varying pHs and NOM levels with different frequencies.The combined effect of frequency and glass beads on EDC degradation was also investigated.
The highly pure (>99%) BPA, EE2, and humic acid used in this study were purchased from Sigma-Aldrich Chemical Co.,Inc. (Milwaukee, WI, USA). Solvents (methanol and acetonitrile)were obtained from JT Baker Chemical Co., Inc. (Phillipsburg,PA, USA) and were all of HPLC grade. Table 1 lists the characteristics
[Table 1.] Physicochemical properties of bisphenol A and 17α-ethinyl estradiol [34]
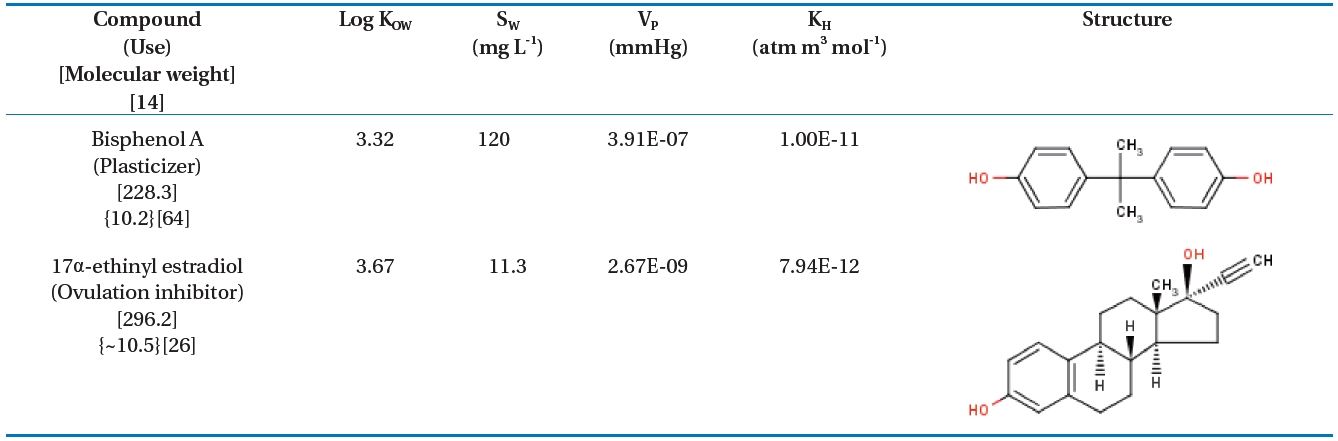
Physicochemical properties of bisphenol A and 17α-ethinyl estradiol [34]
of the BPA and EE2, which were obtained from the SRC PhysProp Database [34]. All sample solutions containing each target compound were prepared with ultrapure DI water.BPA and EE2 were dissolved separately in acetonitrile as stock solutions of 1 mM each. A humic acid stock solution was prepared by adding 1 g of dry humic acid powder to 1 L of deionized water and stirred overnight. The solution was then filtered through 0.45 ㎛ glass microfiber filters (Whatman, Buckinghamshire,UK) to remove particulate matter >0.45 ㎛. Na2SO4,KCl, NaHCO3, MgCl2, and CaCl2 were purchased from Sigma-Aldrich. NaCl was purchased from Fisher-Scientific (Pittsburgh,PA, USA). Glass beads of 0.1 mm diameter were purchased from Goryeo-Ace Inc. (Seoul, Korea).
2.2. Preparation of SSW and SBW
Solutions of SSW and SBS were prepared to investigate the sonodegradation of BPA and EE2 from seawater and brackish water. Volumes of BPA and EE2 stock solutions were both placed together in separate beakers at concentrations of 1 μM,and the acetonitrile was evaporated from the stock solution at room temperature under a fume hood to remove dissolved organic carbon (DOC). Dilutions of humic acid were taken from the stock solution and added to achieve the desired concentration of DOC. Based on a preliminary DOC analysis, the humic acid used in this study consisted of 10% DOC. Then, the other constituents in the synthetic source water were added using the concentrations listed in Table 2 and stirred overnight. The compositions of the SSW and SBS were based on a literature review of several studies related to the treatment and characterization of seawater and brackish water [35, 36]. The pH was adjusted to the desired values using 1 M NaOH and/or HCl.
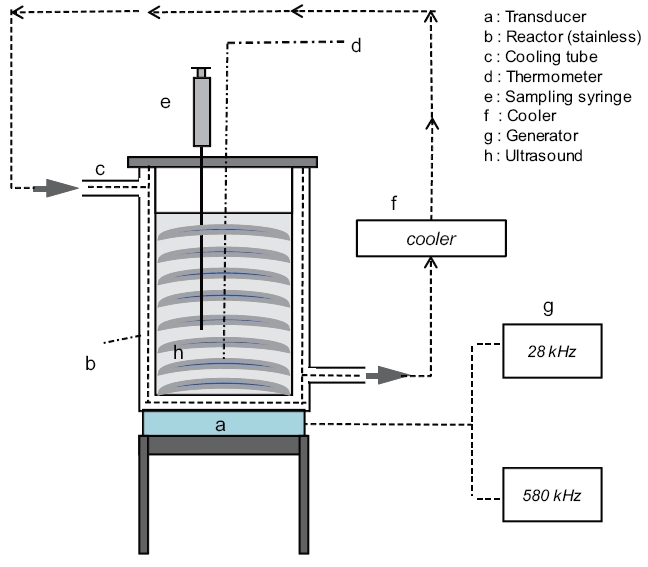
A schematic diagram of the experimental setup is shown in Fig. .1 Ultrasonic irradiation of the aqueous samples was performed in a stainless steel bath-type reactor (15 cm length × 10 cm width × 20 cm height; Ul-Tech, Seoul, Korea) at two different
[Table 2.] Characteristics of the synthetic seawater and brackish waterused in the study
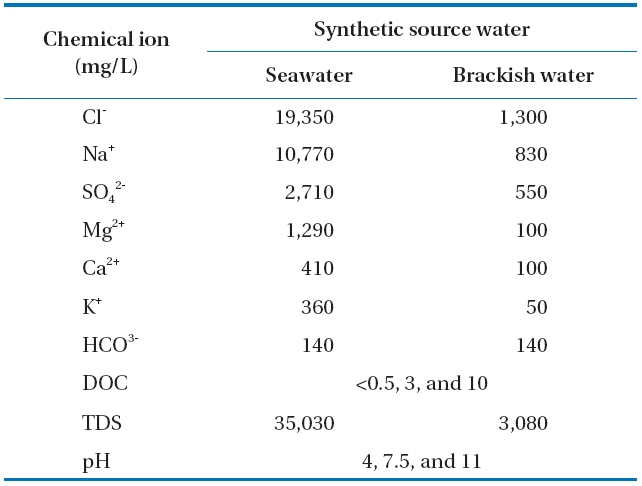
Characteristics of the synthetic seawater and brackish waterused in the study
frequencies of 28 and 580 kHz with an applied power of 200 ± 3 W and at a constant temperature of 20 ± 1°C. Volumes of 1,000 mL each for DI water, SSW, and SBW were poured into the reactor bath, which was connected to a temperature control unit(Thermo Haake, Karlsruhe, Germany). All glassware (sample bottles, beakers, test tubes, and LC inserts) for the experiments were silanized prior to use [37]. Furthermore, all glassware and supplies were rinsed twice with methanol. The power density applied to the solution was 0.2 W mL-1. Aliquots of 1.5 mL each were withdrawn at set intervals of 5 min over the total irradiation time of 30 min. Blank control tests were also performed in a single component in the absence of ultrasonic irradiation for 30 min at a room temperature of approximately 20°C. No change in the BPA and EE2 concentrations were observed. Some of the values reported are an average of experimental results performed in triplicate.
2.4. Analysis Using HPLC-fluorescence
HPLC-fluorescence was conducted on Agilent Technologies 6410 and 1200 Series instruments (Santa Clara, CA, USA)to perform a sensitive and simple analysis of the target compounds.The HPLC-fluorescence system was equipped with a C18 reverse column (150 × 4.6 mm, 5 ㎛) (Agilent Technologies)for determining BPA and EE2 levels. Fluorescence detection was performed using a fluorescence detector at an excitation wavelength of 280 nm and an emission wavelength of 310 nm to identify BPA and EE2. The mobile-phase solvent profile was 30% DI water and 70% methanol for 10 min at a constant flow rate of 1 mL min-1 with a sample injection volume of 10 μL. The concentration of each in the samples was determined against an external calibration curve with five different concentrations of 0.01, 0.05, 0.1, 0.5, and 1 μM prepared in DI water. Calibration standards of 0.05 μM were run between approximately every 10 samples. The method detection limits were 0.13 nM for BPA and 1.29 nM for EE2.
An aqueous KI solution was used to determine the concentration of hydrogen peroxide formed during aqueous sonolysis
[38]. A sample of 1.5 mL was collected, and 0.75 mL of 0.1 M potassium hydrogen phthalate was added. An iodide reagent (0.75 mL) (0.4 M potassium iodide, 0.06 M NaOH, and 10-4 M ammonium molybdate) was added at
3.1. BPA and EE2 Degradation at Different Frequencies
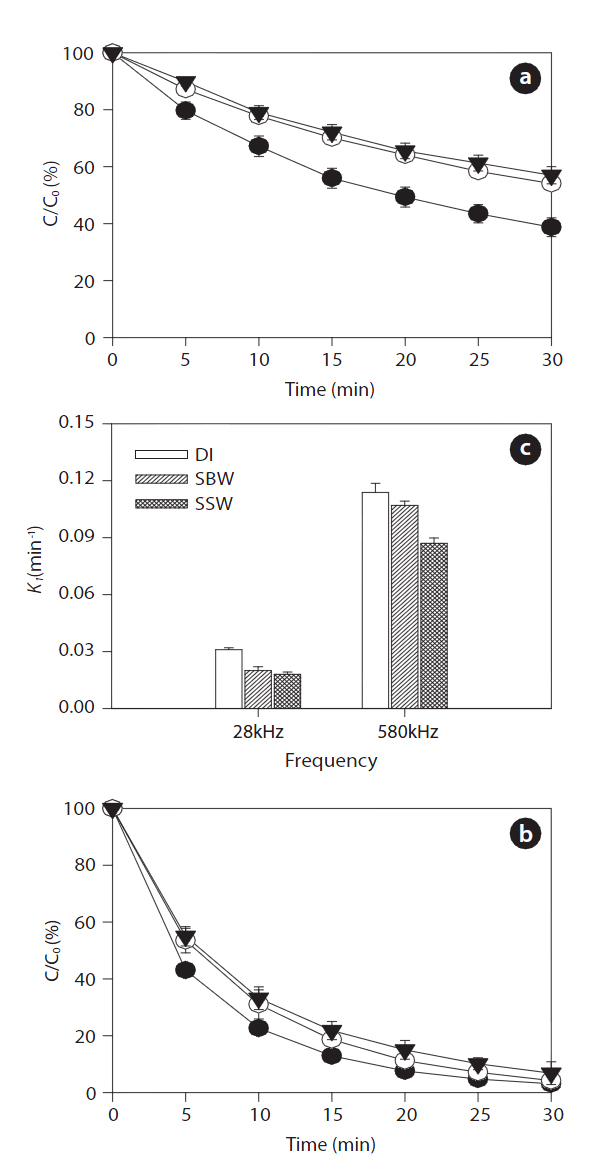
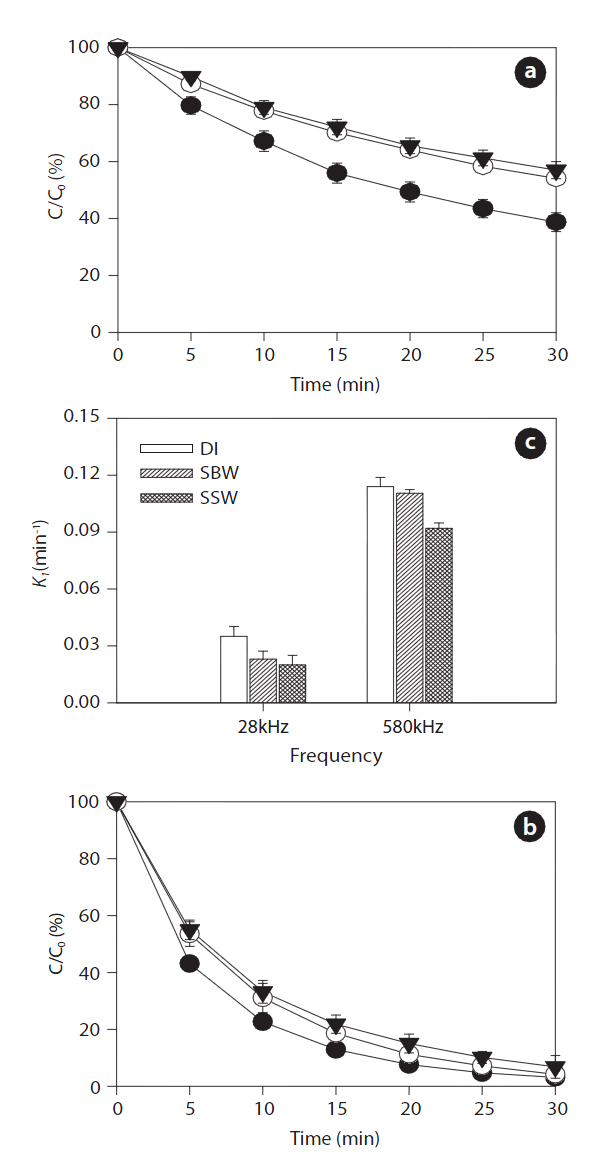
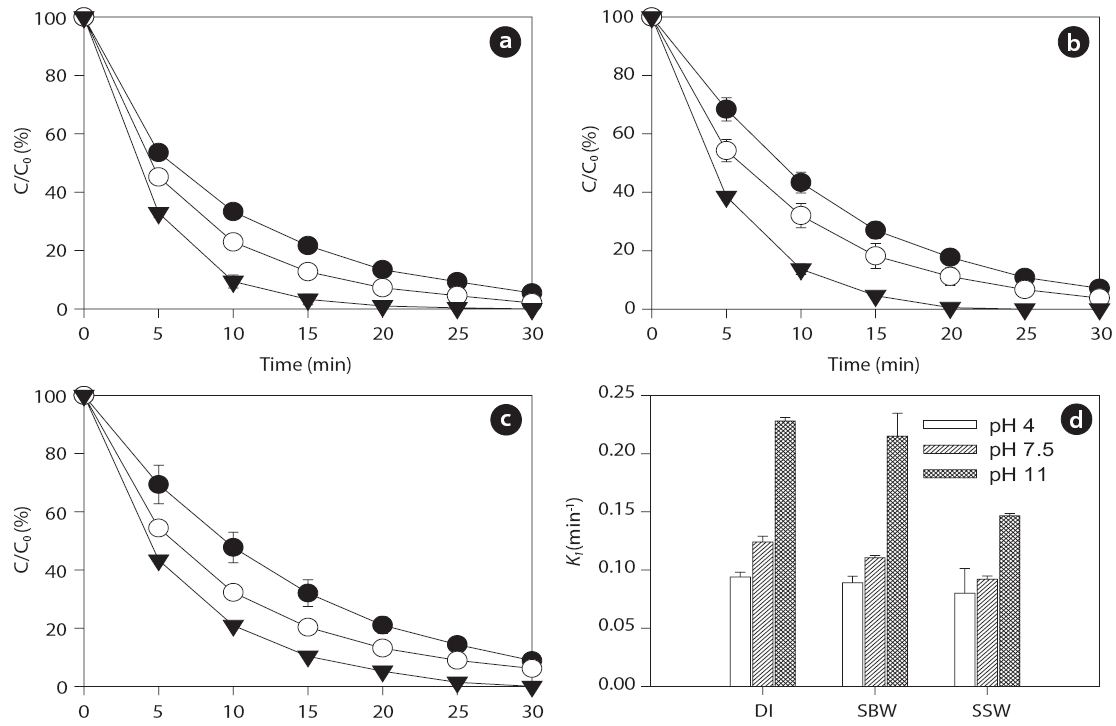
Ultrasonic degradation of the two EDC compounds (i.e., BPA and EE2) in aqueous solution with an initial concentration of 1μM was performed in single-component batch reactors at two frequencies of 28 and 580 kHz with DI water, SBW, and SSW. The ultrasound-assisted degradation and pseudo-first order rate constants of the BPA and EE2 in each case are shown in Figs. 2 and 3. Significantly higher sonochemical degradation (93?97%for BPA) occurred at 580 kHz than at 28 kHz (43?61% for BPA),regardless of water type (Fig.2 ). Slightly higher degradation of EE2 (94?98% at 580 kHz and 48?67% at 28 kHz) was observed compared to that of BPA (Fig.3 ). To bring water into cavitation requires more energy at a higher frequency (487 kHz) than at 20 kHz, and the threshold of cavitation is lower for water saturated with air than for degassed water [39]. In our study, cavitation occurred
mainly at the surface of the emitter at 28 kHz, where the amplitude of the pressure was maximum, whereas at the higher frequency of 580 kHz, the degassing effect can be important at the surface of the emitter, which increases the threshold of cavitation[40]. In addition, this occurs most likely because a higher frequency actually increases the number of free radicals in the system. The mechanism for sonochemical degradation of organic compounds involves the production of free radicals and their subsequent attack on pollutant species [41, 42].
Among the three types of water, the degradation of BPA and EE2 followed this order: DI water > SBW > SSW at a contact time of 30 min. These results are contradictory to those of a previous study, in which a significant increase in degradation rate constants of various estrogens was observed in the presence of NaCl(0?0.17 M) [27]. The enhanced degradation rate due to salinity can be explained by two mechanisms: 1) the “salting out” effect due to NaCl, resulting in higher mass transfer of estrogen hormones from the bulk solution to the interfacial region; and 2) solution salinity can also decrease the vapor pressure and increase the surface tension of the aqueous medium, which promotes a more violent cavity implosion. Both the “salting out” effect and enhanced cavity implosion create favorable conditions for the sonochemical degradation of estrogen compounds [27]. However,in our study, sonodegradation was reduced in the presence of various mono- and divalent anions and cations. Thus, it is necessary to further investigate the effect of ions on sonodegradation,because a previous study has shown that a decrease in the rate of
well-known HO? scavenger [44]. Therefore, HCO3- competes for available HO? in the SBW and SSW solutions and decreases the BPA and EE2 reaction with HO?.
It is well accepted that H2O2 arises from the reactions of HO?and HOO? in the liquid phase around the cavitational bubble and can be used to quantify the efficacy of reactors for generating the desired cavitational intensity [45]. These radicals are capable of initiating or promoting numerous fast reduction-oxidation reactions.In our study, H2O2 measurements were performed in the absence of the target compounds to investigate the efficacy of different sonochemical reactors for generating free radical species.The concentration of generated H2O2 increased linearly with the time of ultrasonic irradiation (Table 3). The H2O2 concentration values obtained at 28 kHz at a reaction time of 30 min were much lower than those obtained at 580 kHz. In addition,the H2O2 concentration was slightly higher in DI water than that in SBW and SSW. A statistical analysis of the data revealed that BPA and EE2 degradation followed pseudo-first order kinetics.The degradation rate constants are presented in Figs. 2c and 3c
[Table 3.] Hydrogen peroxide production in deionized (DI) water
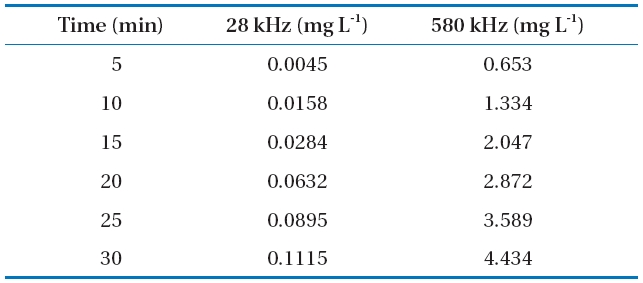
Hydrogen peroxide production in deionized (DI) water
for the different frequencies. EE2 degraded slightly faster than BPA with rate constants of 0.092?0.114 min-1 for EE2 and 0.087?0.113 min-1 for BPA at 580 kHz in the three different water types.A previous study has shown that the best degradation rate of BPA at four frequencies (300, 500, 600, and 800 kHz) was obtained at the lowest frequency [46]. A high BPA degradation (>99%) at an initial concentration of 118 ㎛ol L-1 and contact time of 120 min was obtained using a 300 kHz frequency [47]. Both BPA and EE2 have a phenol group in the benzene ring, which is presumably where radical attacks and degradation occur. The EDC degradation reaction can be initiated by adding HO? radicals followed by the ring cleavage/opening mechanism [48].
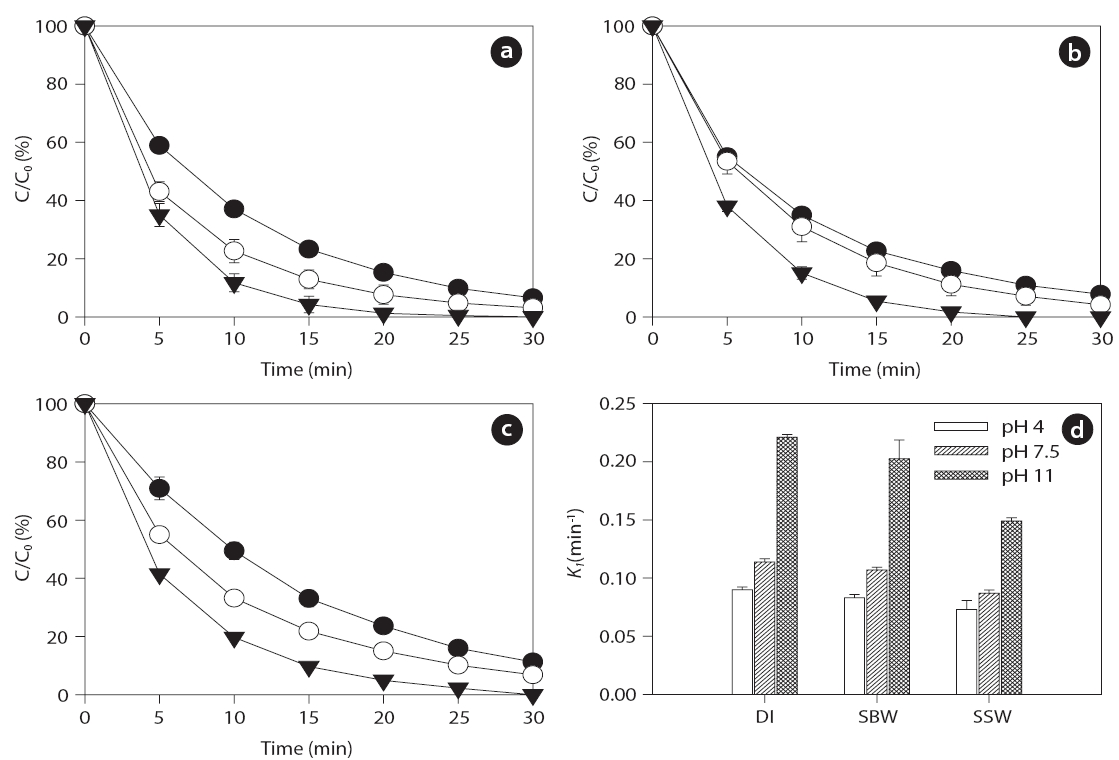
Several studies have shown that pH, which can modify the physical properties (e.g., charge) of molecules with ionizable functional groups, plays an important role in the sonochemical degradation of contaminants [49, 50]. As the charge of the BPA and EE2 compounds is pH-dependent, several experiments were conducted to determine the influence of pH on the degradation of the compounds in the range of initial pHs of 4 to 11.Figs. 4 and 5 show that the BPA and EE2 degradation rates in DI water, SBW, and SSW after 30 min of ultrasound irradiation at 580 kHz increased slightly along with an increase in pH from 4 (0.073?0.091 min-1 for BPA and 0.081?0.094 min-1 for EE2) to 7.5 (0.087?0.114 min-1 for BPA and 0.092?0.124 min-1 for EE2),whereas a significant increase in degradation was observed at pH 11 (0.149?0.221 min-1 for BPA and 0.147?0.228 min-1 for EE2).These results suggest that BPA and EE2 are unstable in a high pH solution (i.e., pH > pKa, where BPA and EE2 are dissociated), and that irradiation with ultrasound significantly accelerates degradation even in water with high ionic strength and salinity such
reboundas SBW and SSW. BPA and EE2 seemed to easily attach to HO? in alkaline solutions (pH > 7). A separate study has shown that at pH values higher than the pKa of
3.3. Effect of Inert Glass Beads
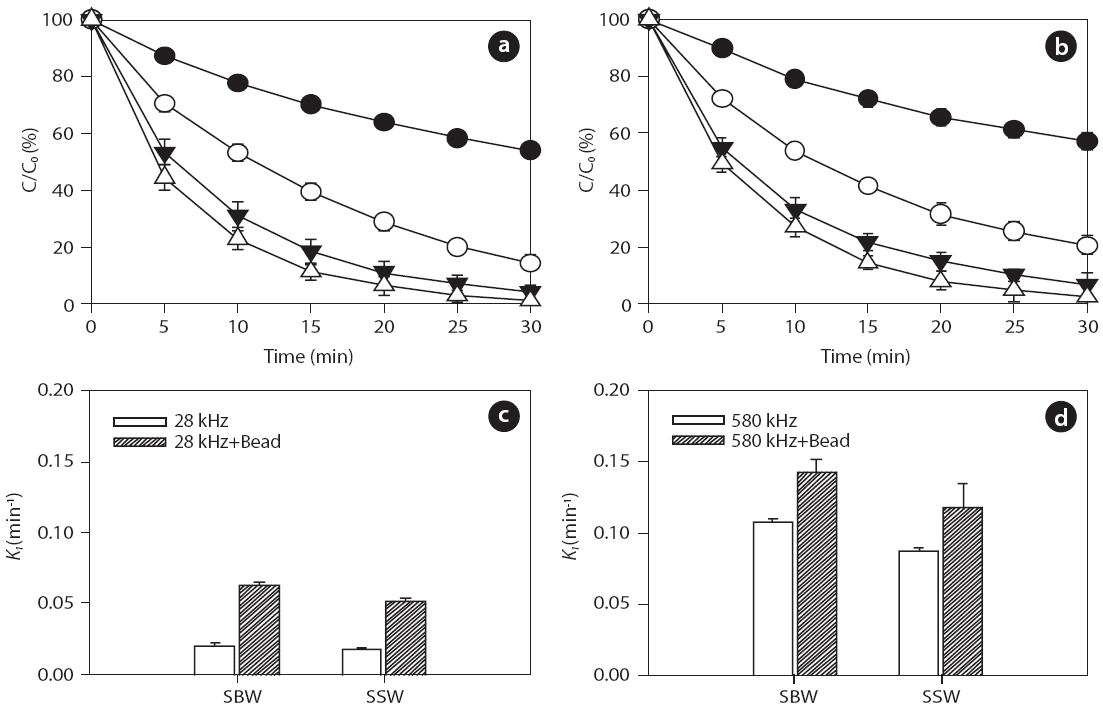
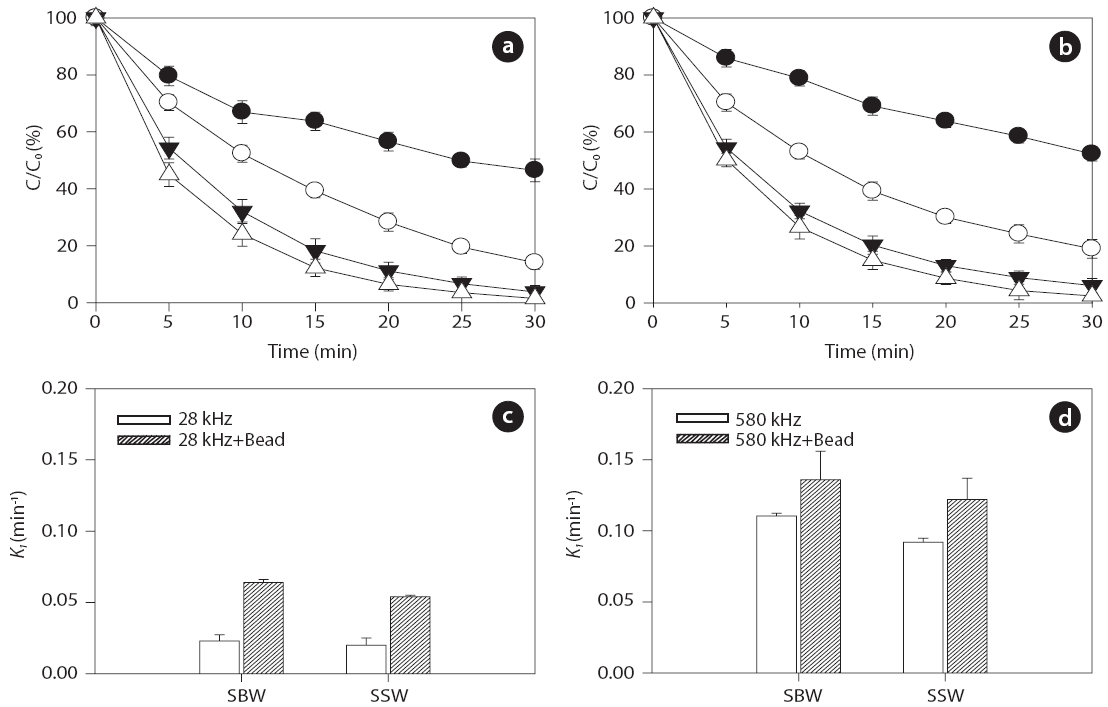
Inert glass beads with a size of 0.1 mm (25 g) were added to aqueous samples at pH 7.5 to investigate the effect of solid surfaces on ultrasonic reactivity. For the given frequencies of 28 and 580 kHz, degradation rate increased in the presence of glass beads for both BPA and EE2, as shown in Figs. 6 and 7, respectively:0.018?0.107 min-1 without beads and 0.052?0.142 min-1 with beads for BPA; 0.021?0.111 min-1 without beads and 0.054?0.136 min-1 with beads for EE2. In general, higher degradation of both BPA and EE2 was observed at 580 kHz compared to that at 28 kHz. Additionally, SBW showed higher BPA and EE2 degradation than SSW. In the presence of glass beads, possible mechanisms of enhanced H2O2 reactivity include 1) catalytic effects at the solid surface, 2) increased/decreased lifetime of H2O2 in the solid surface microenvironment, and 3) changes in the salvation shell morphology of sorbed H2O2[51]. Furthermore, H2O2 formation is enhanced by increasing the bubble population in a standing wave field due to shorter intervals between the active regions corresponding to a decrease in the wavelength [52].
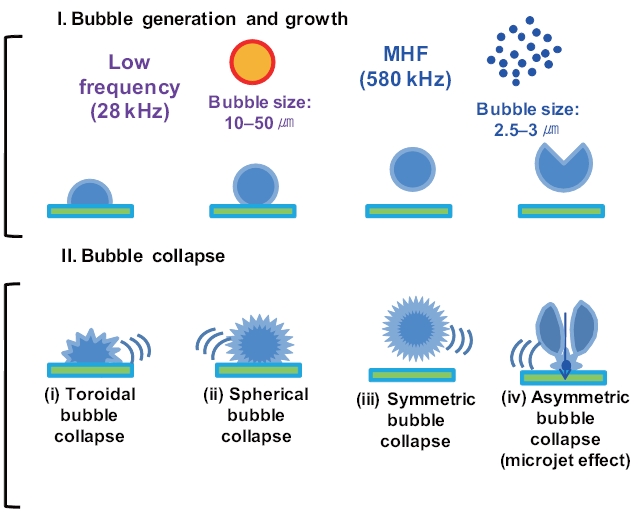
Previous studies have reported that the presence of solids and/or catalysts in aqueous systems increases sonochemistry reactivity [51, 53, 54]. A description of the formation and subsequent dynamic life of cavitation bubbles near a solid boundary in an acoustic field remains difficult. Fig. 8 shows the potential cavitation processes in the presence of glass beads at different frequencies in the four bubble collapses: 1) toroidal, 2) spherical,3) symmetric, and 4) asymmetric (microjet effect). The growth and collapse of cavitation bubbles in an acoustic system is influenced by ultrasound frequency, and the life cycles are very short.Except for frequencies in excess of a few megahertz, a cavitation bubble theoretically grows during the negative portion of the acoustic cycle and is forced to collapse during the positive portion [55]. For similar acoustic intensities and pressure amplitudes,cavitation bubbles at low frequencies (~20 kHz) grow for approximately 25 μs, whereas cavitation bubbles at high acoustic frequencies (~1 MHz) have only 0.5μs of growth [56]. These significant differences in bubble growth result in small bubble sizes at high frequencies and, consequently, less violent collapses:approximately 10?50 ㎛ at low frequencies such as 28 kHz and 2.5?3.0 ㎛ at medium?high frequencies such as 580 kHz, as shown in Fig. 8 [57-59].
For solid surfaces, a previous study reported that a cavitation bubble collapse process is achieved in two acoustic cycles [60]:1) a spherical bubble collapsed towards the solid boundary to its minimum volume and then rebounded and grew into a toroidal bubble (or two individual bubbles) in one acoustic cycle; and 2)a toroidal bubble (or two individual bubbles) collapsed towards the center of the ring to its minimum volume and then rebounded
into a spherical bubble during the next acoustic cycle (Fig.8 ).Asymmetric bubble collapses with a vortex ring produce sonoluminescence in heterogeneous sonochemistry; this results in free radical production in the near vicinity of the solid surface,a rich region for sonochemical reactions [56]. The population(i.e., number and size) of cavitation bubbles depends on the frequency of irradiation. It is well known that lower irradiation frequencies produce a smaller number of cavitation bubbles, as bubbles then grow to a greater extent and undergo higher compression[61]. At a low frequency, bubbles have relatively more time to grow and collapse, which results in large maximum sizes and more violent collapses. In our study, at the low frequency of 28 kHz, an assumption was made that the time available and the amount of water vapor during the growth phase of the cavitation bubbles can be expected to be higher in the presence of glass beads compared to without adding glass beads. Thus, an increase in H2O2 production can be expected as glass beads are added.
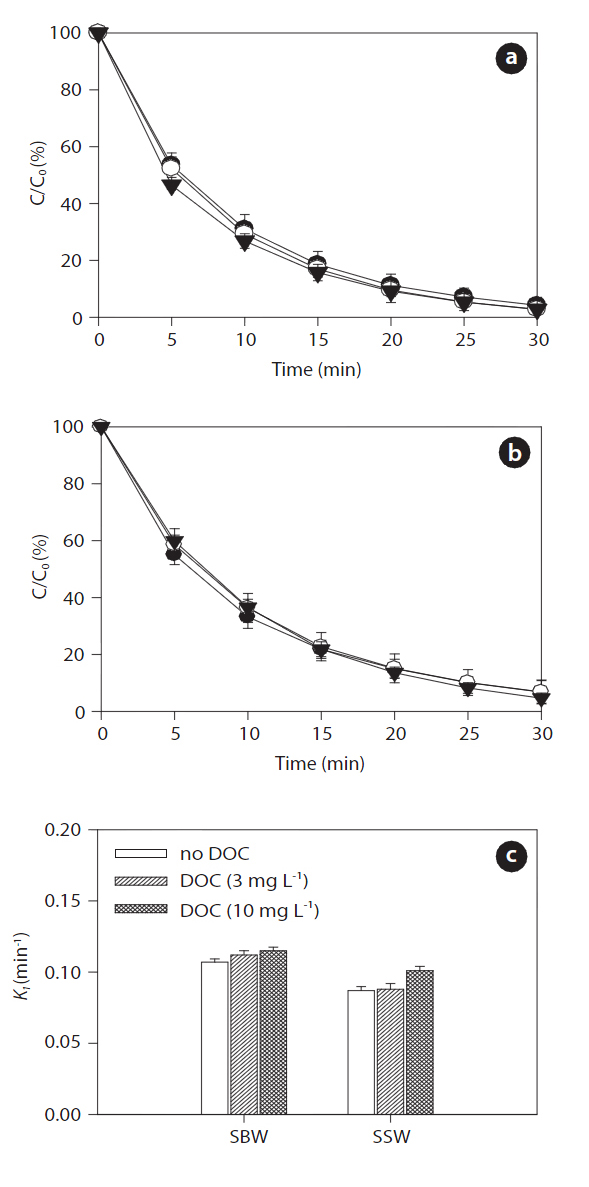
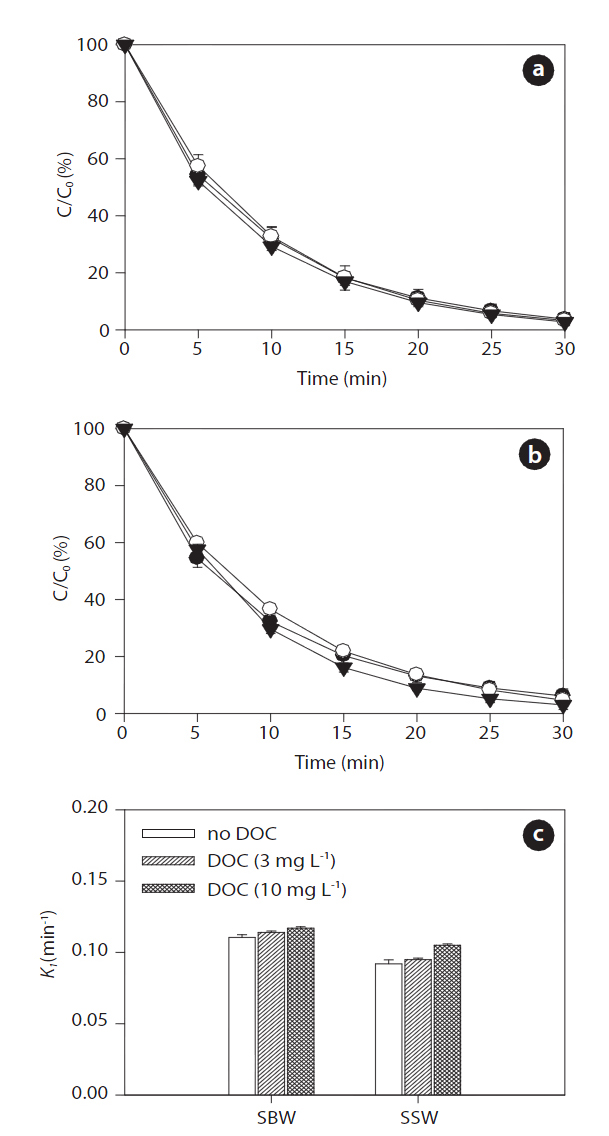
Figs. 9 and 10 show the effects of increased concentrations of DOC on the sonodegradation of BPA and EE2, respectively, at 580 kHz. A slight increase in degradation of both BPA and EE2 was found as the concentration of DOC increased in both SBW and SSW: 0.107?0.115 min-1 in SBW and 0.087?0.101 min-1 in SSW for BPA; 0.111?0.111 min-1 in SWB and 0.092?0.105 min-1 in SSW for EE2. Between these water types, SBW resulted in slightly higher degradation than that of SSW. These results contradict those for the NOM effect on sonodegradation. In a previous study, adding fulvic acid resulted in a decrease in polycyclic aromatic hydrocarbons (anthracene, phenanthrene, and pyrene)[62]. As described previously, reactive transients such as HO? are formed during sonication. These transients then act as oxidants to degrade the pollutants present. However, scavenging of reactive transients results in a continuously decreasing rate constant with added scavenger (fulvic acid) [62]. However, in our study,the degradation of BPA and EE2 increased slightly in the presence
of humic acids. Unlike fulvic acid, it seems that humic acids do not react well with HO?. It is still unclear how this occurs in SBW and SSW. However, an assumption can be made that humic acids associated with high salts in SBW and SSW react as an H? scavenger.
It is generally known that a major reduction in HO? during sonochemical processes is due to its recombination with H? to reform water [63]. Such recombination reactions presumably occur because the two species are close to each other after their initial formation. This recombination process presents a major impediment to the efficient production of HO?. However, adding humic acids associated with background anions and cations trap H?, so they cannot recombine with HO?. The expected result of this trapping would be an increase in HO? concentration in aqueous solution. However, a further detailed study is needed to clarify this matter. Measurements of DOC conducted during ultrasound irradiation in SBW and SSW showed different behaviors with respect to NOM removal. After 30 min of sonicating the humic acid solution, DOC removal varied depending on water type: 27% (3 mg L-1) and 7% (10 mg L-1) in SBW and 7% (3 mg L-1)and 4% (10 mg L-1) in SSW. The effect of ultrasonic irradiation can be explained by two mechanisms: 1) chemical degradation of the humic acids occurs in the cavitation bubbles by oxidation;and 2) physical aggregation of humic acid fragments [31].However, more extensive studies are needed to determine the transport and fate of NOM during sonodegradation, because the degradation of DOC (i.e., NOM) measured by UVA254 does not indicate that it was completely degraded or mineralized.
In this study, two endocrine disrupting compounds (i.e.,BPA and EE2) were sonodegraded in DI water, SBW, and SSW at different frequencies. Ultrasound irradiation was efficient at degrading the EDCs, and the degradation varied depending on the background water chemistry. The degradation of EE2, which is relatively more hydrophobic than BPA, was slightly faster.Among these three types of water, the degradation of BPA and EE2 followed the order DI water > SBW > SSW at a contact time of 30 min; this is because HCO3-, a well-known HO? scavenger,competes for available HO? in the SBW and SSW solutions and decreases the BPA and EE2 reactions with HO?. Additionally, the results revealed that the degradation of EDCs is strongly influenced by sonication frequency, because a higher frequency of 580 kHz typically increases the number of free radicals in the system.The degradation rate of BPA and EE2 at 580 kHz increased slightly along with an increase in pH from 4 to 7.5, whereas a significant increase in degradation was observed at pH 11. For the given frequencies of 28 and 580 kHz, the degradation rate increased in the presence of glass beads for both BPA and EE2. The results also showed that a slight increase in degradation of both BPA and EE2 was found as the concentration of DOC increased in both SBW and SSW. A limited amount of NOM was removed during the sonodegradation of BPA and EE2.

![Physicochemical properties of bisphenol A and 17α-ethinyl estradiol [34]](http://oak.go.kr/repository/journal/10607/E1HGBK_2011_v16n3_137_t001.jpg)

![Comparison of bisphenol A (BPA) sonodegradationin various water types at (a) 28 kHz and (b) 580 kHz.(c) Comparison of pseudo-first order rate constants atdifferent frequencies. Sonication conditions: 0.2 W mL-1; 20 ± 1°C; pH 7.5; no humic acid added; Co = 1 μM (●:deionized water [DI] ○: synthetic brackish water [SBW]▼: synthetic seawater [SSW]).](http://oak.go.kr/repository/journal/10607/E1HGBK_2011_v16n3_137_f002.jpg)
![Comparison of 17α-ethinyl estradiol (EE2)sonodegradation in various water types at (a) 28 kHzand (b) 580 kHz. (c) Comparison of pseudo-first orderrate constants at different frequencies. Sonicationconditions: 0.2 W mL-1; 20 ± 1°C; pH 7.5; no humic acidadded; Co = 1 μM (●: deionized water [DI] ○: syntheticbrackish water [SBW] ▼: synthetic seawater [SSW]).](http://oak.go.kr/repository/journal/10607/E1HGBK_2011_v16n3_137_f003.jpg)