The main reasons for the use of O3 are disinfection and oxidation such as taste and odor control, decolorization, and elimination of micropollutants. Similar to other disinfectants such as chlorine or chlorine dioxide for water treatment, O3 is unstable in water, and undergoes reactions with some water matrix components.However, O3 decomposes, generating OH radicals,which are strong oxidants in water [1]. The disinfection process occurs mainly through the reaction of O3 molecules, whereas the oxidation process may occur through both O3 and OH radicals[2]. O3 reacts with a variety of inorganic and organic compounds.However, the fact that rate constants for the O3 reaction range over several orders of magnitude means that O3 is a very selective oxidant. O3 reacts quickly with phenols, amines, compounds with C = C double bonds, and aromatic compounds.
O3-based advanced oxidation processes (AOPs) are applied to oxidize O3-resistant compounds such as pesticides and chlorinated solvents by OH radicals, which are powerful and non-selective oxidants. OH radicals react very quickly with various inorganic and organic compounds in water. Therefore, OH radicals also contribute to the oxidation of micropollutants.However, their efficiency is often limited by the scavenging effect of the water matrix. In O3-based AOPs, the formation of OH radicals is accelerated by increasing the pH of the water, by dosing H2O2, or by adding UV irradiation. This ensures faster oxidation of O3-resistant compounds.
Potential risks associated with the release of pharmaceuticals and personal care products (PPCPs) into the aquatic environment have become an increasingly important issue for environmental regulators and the pharmaceuticals industry [3]. Therefore,the use of appropriate PPCP removal technologies should be applied in wastewater treatment plants to limit the aquatic risk of PPCPs. Many studies have been conducted on the degradation of PPCPs by O3-based processes, showing that O3 was the oxidant, although some PPCPs seem to resistant to O3[4-7]. A great variety of PPCPs are being used in daily life and have been detected in the water environment [3, 8, 9]. Nevertheless, a limited number of PPCPs have been investigated because of the difficulty of the PPCPs analysis. The objective of this study was to investigate the effects of H2O2 and UV on the degradation of 30 PPCPs during O3 treatment.
2.1. Selected PPCPs and Preparation of Test Water
The 30 PPCPs selected in this study consisted of analgesics,antiarrhythmic agents, antibiotics, bronchodilators, an antiitching drug, anticonvulsants, antineoplastic agents, insect repellents,a carbadox (antiparasitic agent) intermediate, and an N-methyl d-aspartate receptor antagonist. Detailed information on the 30 PPCPs and their analytical method using high performance liquid chromatography-mass spectroscopy/mass spectroscopy(HPLC-MS/MS) was provided in our previous study[10]. To examine the degradability of the 30 PPCPs using O3, O3/UV, and O3/H2O2, test water samples were prepared by spiking the 30 PPCPs into pure water obtained from Nisso Shoji Co., Ltd(Tokyo, Japan). The initial concentrations of the 30 PPCPs in the
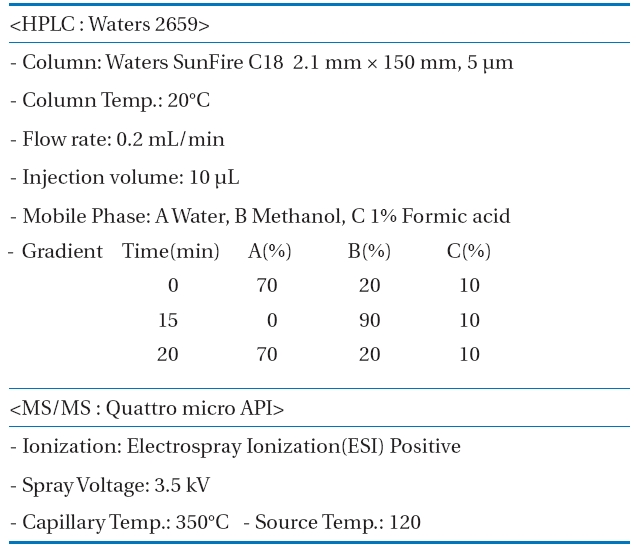
Measurement conditions of the high performance liquidchromatography-mass spectroscopy/mass spectroscopy (HPLCMS/MS) for the pharmaceuticals and personal care products(PPCPs) analysis
test water samples ranged from 4.7 μg/L (mefenamic acid) to 147.6 μg/L (sulfamonomethoxine). The procedure for the preparation of the test water is described elsewhere [10].
The 30 PPCPs were quantified simultaneously with a HPLC/MS/MS. An HPLC Alliance Waters2695 separation module (Water Inc., Milford, MA, USA) and a Quattro micro API tandem mass spectrometer were used for the HPLC and the MS/MS, respectively.MassLynxTM Software (Waters) managed the control of the HPLC/MS/MS system and treatment of the data acquired during the operation of HPLC/MS/MS. A gradient elution analysis method by varying mobile phase polarity with time was adopted to simultaneously quantify the 30 PPCPs. Samples taken during the experiments were introduced directly to HPLC/MS/MS. Table 1 shows the measurement conditions for HPLC/MS/MS in detail.
2.3. Experimental Setup and Conditions
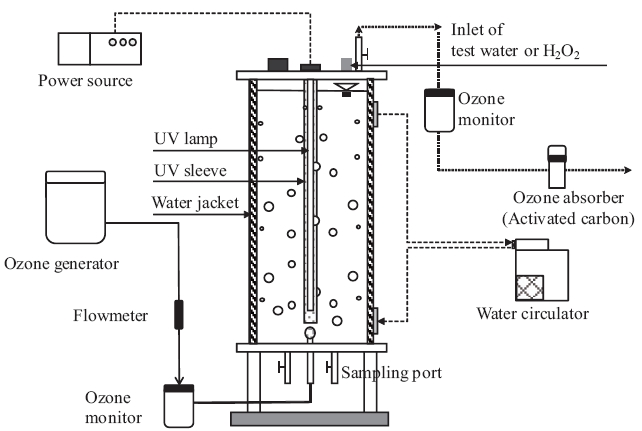
All of the experiments were conducted using a cylindrical stainless reactor (Fig.1 ). The temperature of the test water samples was maintained at 20°C with a hot water circulator. The pH of all test water samples, prepared by spiking the 30 PPCPs into pure water (PW), was adjusted to 7.0 with a 1 M phosphate buffer solution. Treatment experiments started by continuously injecting O3 gas into the reactor. We conducted three different treatment experiments (O3, O3/UV, and O3/H2O2) to compare the degradation characteristics of each PPCP.
An O3 treatment experiment was performed under three different O3 feed rates of 0.15, 0.3, and 0.6 mg/L/min. In this study,O3 feed rate was controlled by supplying O3 gas to the reactor at concentrations of 3.3, 6.6, and 13.2 mg/L, respectively, and by maintaining the flow rate of O3 gas at a constant 1.0 L/min during all experiments.
An 8 W low-pressure mercury lamp emitting radiation at 254 nm with a UV intensity of 0.384 mW/cm2 was used for O3/UV treatment. The O3/UV treatment was performed on test water prepared with PW at O3 feed rates of 0.15, 0.3, and 0.6 mg/L/min.The O3/H2O2 treatment was performed by adding H2O2 solution to the test water before O3 treatment. Initial H2O2 concentrations of 2.3 mg/L and 11.2 mg/L in the test water prepared with PW were used, and the O3 feed rate was 0.6 mg/L/min in both experiments.
3.1. Determination of the PPCP Rate Constants for the O3, O3/UV, and O3/H2O2Treatments
The degradation reaction of an organic compound by O3 is generally expressed as [11]:
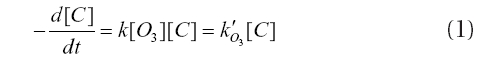
where [C] is the concentration of the organic compound, k is the first order rate constant, [O3] is the concentration of dissolved O3, and k'O3 is the pseudo first-order rate constant. Pseudo firstorder conditions are met if [O3] ≥ ~10 × [C], and [O3] does not
self-decay significantly during the reaction [12]. For experiments using the same reactor, the k'O3 value can be used as an indicator for the reactivity of an organic compound with O3. Integrating Eq. (1), we obtain
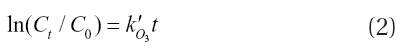
where Ct is the concentration of the organic compound at the reaction time t, and C0 is the initial concentration of the organic compound.
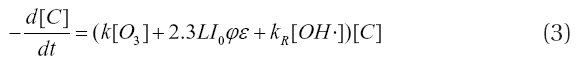
In the case of O3/UV treatment, the organic compound is degraded by O3, direct UV photodegradation, and OH radicals formed by UV photodegradation of O3. Therefore, the decrease in concentration of the organic compound during O3/UV treatment can be expressed as:
Integrating Eq. (3), we obtain
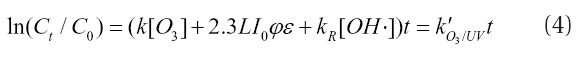
where L is the reactor optical light path (cm), I0 is the UV intensity(einstein/sec), ø is the quantum yield (mol/photon), ε is the molar extinction coefficient of the organic compound (/M/cm),kR is the second-order rate constant of OH radicals, and [OH?] is the concentration of OH radicals.
In the case of O3/H2O2 treatment, the organic compound is mainly degraded by O3 and OH radicals, so the decrease in concentration of the organic compound can be expressed as follows:
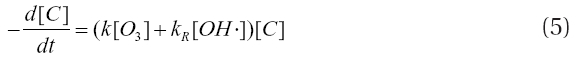
Integrating Eq. (5), the following expression is obtained:
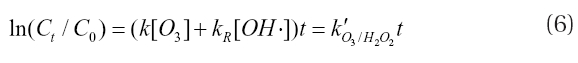
If the ln(Ct/C0) of an organic compound decreases linearly with time, the degradation reaction of the compound by each treatment can be regarded as a pseudo-first-order reaction. In this case, the pseudo-first-order rate constants (k'O3, k'O3/UV, and k'O3/H2O2) for O3, O3/UV, and O3/H2O2, respectively, are obtained from the slopes of each straight line.
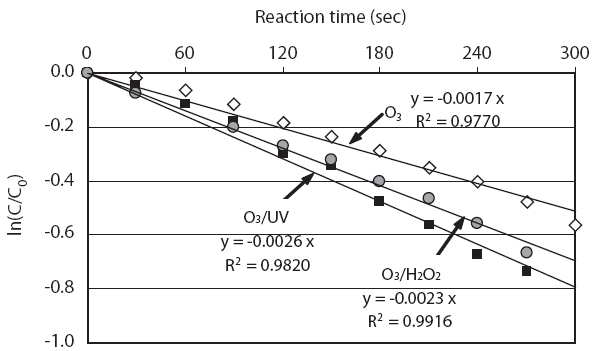
Fig. 2 shows the decrease in concentration of N,N-diethylm-toluamide (DEET) for a reaction time of 5 min during the O3,O3/UV, and O3/H2O2 treatments, which were conducted using test water samples prepared by simultaneously spiking the 30 PPCPs into pure water. O3 was supplied to the reactor at a feed rate of 0.6 mg/L/min in all experiments. O3/H2O2 treatment was performed by supplying O3 to the test water samples with an initial H2O2 concentration of 11.2 mg/L. Regardless of the treatment method, the DEET concentration decreased linearly with time. Therefore, the degradation reactions of DEET with O3, O3/UV, and O3/H2O2 conformed with pseudo-first-order reactions under the experimental conditions of this study. As shown in Fig. 2,the value of k'O3 (the pseudo-first-order rate constant for O3)of DEET was 1.7 × 10⁻³/sec, whereas that of k'O3/H2O2 was slightly enhanced at 2.3 × 10⁻³/sec due to the contribution of OH radicals to DEET degradation. Moreover, the value of k'O3/UV increased by 2.6 × 10⁻³/sec as a result of adding UV to the O3 treatment.
A linear decrease in concentration for a 5 min reaction time was shown by all of the PPCPs selected in this study, irrespective of the applied treatment methods, and the pseudo-first-order rate constants of the 30 PPCPs for each process could be obtained from the slope of each straight line. The pseudo-first-order rate constants were used to compare the degradability of the 30 PPCPs using each treatment method as well as the effects of adding H2O2 and UV during O3 treatment on PPCP degradation.
3.2. Effect of UV on PPCP Degradation during O3Treatment
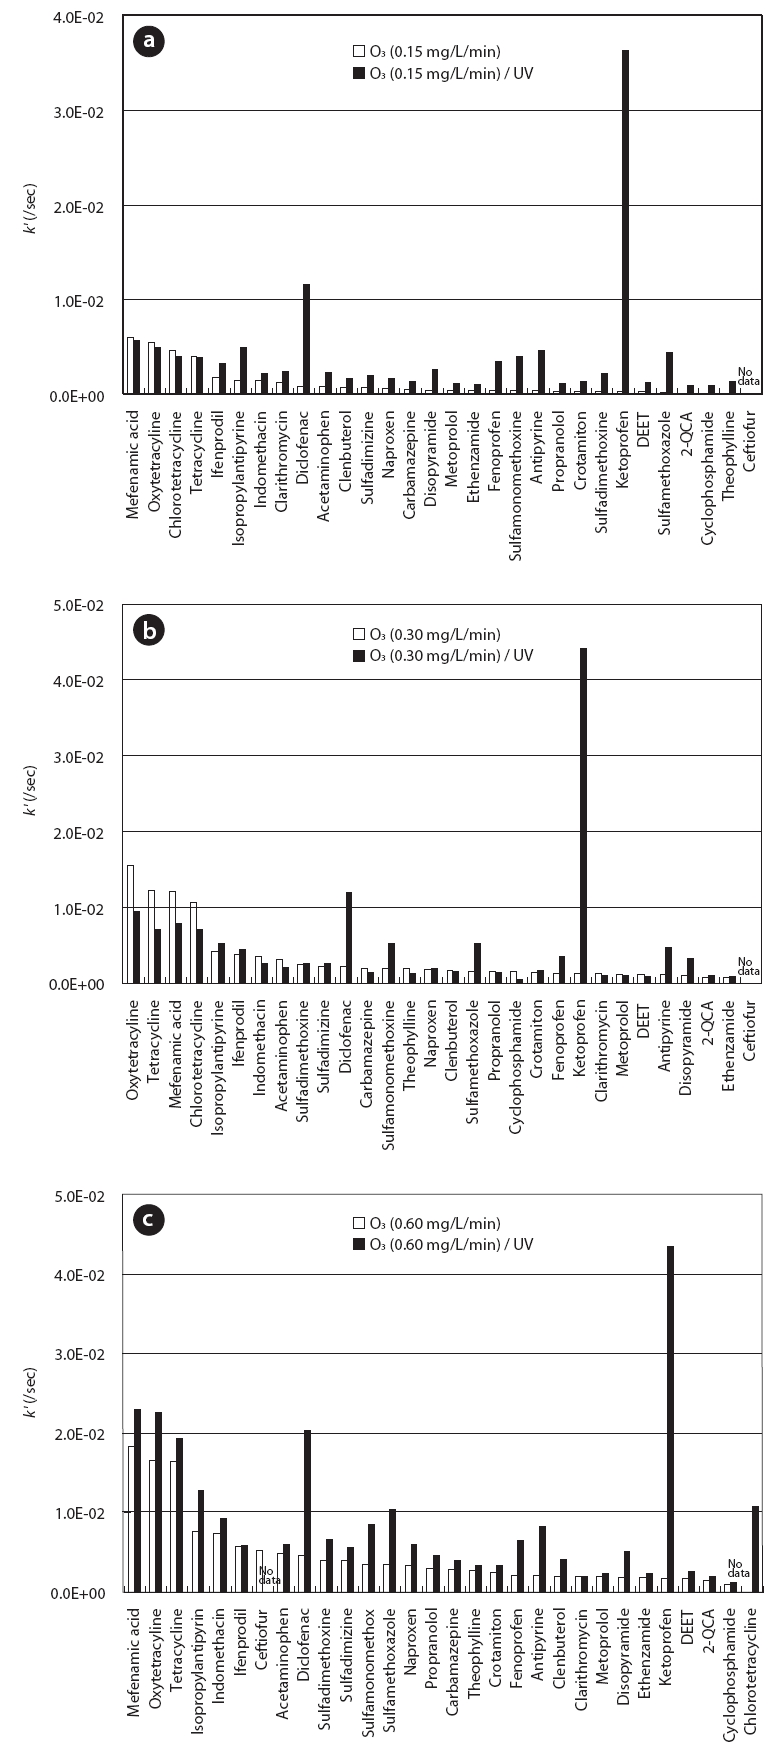
Fig. 3 compares the pseudo first-order rate constants of the 30 PPCPs for O3 treatment with/without UV under O3 feed rates of 0.15, 0.3, and 0.6 mg/L/min, respectively. The combination of UV during O3 treatment led to a distinct improvement in degradation rates of most of the PPCPs. Rate constants of several PPCPs such as ketoprofen, diclofenac, sulfamethoxazole, and antipyrine increased considerably by adding UV during the O3 treatment. In particular, ketoprofen and diclofenac showed much higher rate constants than those for O3 treatment, regardless of the O3 feed rate. Our previous study showed that ketoprofen and diclofenac are degraded very easily with UV, indicating that direct UV photodegradation mainly contributes to its degradation during UV/H2O2 treatment [11]. In this study, it was thought that such fast degradation of ketoprofen and diclofenac could be attributed to direct UV photodegradation rather than to OH radicals during O3/UV treatment.
The degradation efficiencies of the 30 PPCPs with each treatment were compared to investigate the effect of O3 feed rate on PPCP degradation during the O3 and O3/UV treatments. The degradation efficiency was calculated as the ratio of the average rate constant (/sec) for all PPCPs to the O3 consumption per volume of reactor (mg/L). As a result, 1.6 × 10⁻³, 2.2 × 10⁻³, and 1.8× 10⁻³ L/mg/sec were obtained for O3 feed rates of 0.15, 0.3, and 0.6 mg/L/min, respectively, during O3 treatment. The degradation efficiencies following O3/UV treatment were 6.9 × 10⁻³, 3.8 ×10⁻³, and 3.3 × 10⁻³ L/mg/sec for O3 feed rates of 0.15, 0.3, and 0.6 mg/L/min, respectively, showing apparently increased values compared to those for O3 treatment. However, in contrast to the O3 treatment, the highest degradation efficiency was observed at a low O3 feed rate of 0.15 mg/L/min, indicating that the O3 dose required for PPCP degradation can be reduced by combining UV and O3 treatment.
3.3. Effect of Adding H2O2 on PPCP Degradation during O3Treatment
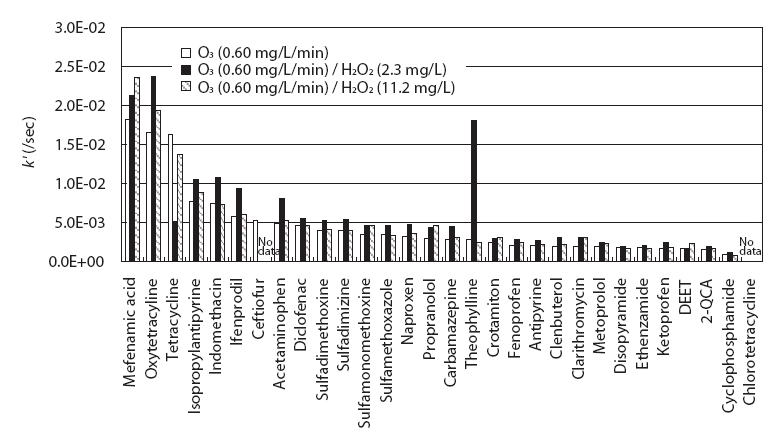
Fig. 4 compares the rate constants of the 30 PPCPs after O3/H2O2 treatment with the k' values obtained for O3 treatment using an O3 feed rate of 0.6 mg/L/min. O3/H2O2 experiments were conducted by maintaining the initial H2O2 concentrations in tested water at 2.3 mg/L and 11.2 mg/L before injecting O3 gas into the tested water. No variation was observed in the PPCP concentrations when only H2O2 was added to the PPCP-tested water. Here, the rate constants of 28 PPCPs were discussed, except ceftiofur and chlorotetracycline, for which peaks were not observed. O3 treatment combined with an initial H2O2 concentration of 2.3 mg/L showed 1.1 to 6.5 times higher rate constants for 26 PPCPs than those for O3 treatment alone. This was due to the contribution of OH radicals formed by the reaction of Eq. (7)[13]. However, the DEET and tetracycline rate constants did not improve despite combining the H2O2 and the O3 treatment.

The rate constants of 17 PPCPs (2-QCA, acetaminophen,antipyrine, carbamazepine, clarithromycin, clenbuterol, crotamiton,DEET, fenoprofen, ifenprodil, isopropylantipyrine, mefenamic acid, metoprolol, naproxen, oxytetracycline, propranolol,and sulfamonomethoxine) increased by 1.1 to 1.6 times when an initial H2O2 concentration of 11.2 mg/L was combined with the O3 treatment. In particular, even slightly lower rate constants than for the O3 treatment alone were observed in four PPCPs such as cyclophosphamide, disopyramide, tetracycline, and theophylline.Moreover, the average rate constants of the 28 PPCPs for 2.3 mg/L and 11.2 mg/L were 6.2 × 10⁻³/sec and 5.1 × 10⁻³/sec,respectively, indicating that a higher H2O2 concentration does not necessarily lead to a faster PPCP reaction. The one reason why a high H2O2 concentration cannot ensure a fast reaction with the target compound is the consumption of OH radicals formed during O3 treatment by excess H2O2. OH radicals can be scavenged by H2O2 in water as shown in Eq. (8) [13], leading to a low degradation rate of the target compounds.

When a high initial H2O2 concentration of 11.2 mg/L was added, OH radicals formed by the reaction of Eq. (7) were scavenged by excess H2O2 added during the O3 treatment; thus, lower rate constants than those for O3/H2O2 treatment using low H2O2 concentration of 2.3 mg/L were obtained. This result indicates that it will be important to determine the appropriate H2O2 dose for O3 treatment to improve reaction rates of PPCPs by adding H2O2 during O3 treatment.
This study investigated the effects of adding H2O2 and UV on the degradation of 30 PPCPs during O3 treatment. The new findings from this study are as follows:
1) Degradation reactions of the target PPCPs with O3, O3/H2O2,and O3/UV could be expressed by pseudo-first-order kinetics.
2) The combination of UV or H2O2 with O3 promoted the degradation reactions of all PPCPs under the tested conditions due to direct UV photodegradation or OH radicals.
3) Several PPCPs such as ketoprofen and diclofenac showed much higher rate constants during O3/UV treatment than those during O3/H2O2 treatment, indicating that their degradation can be attributed to direct UV photodegradation rather than OH radicals.
4) From a comparison of degradation efficiency, defined as the ratio of the average rate constant (/sec) for all PPCPs to the O3 consumption per reactor volume (mg/L), the highest degradation efficiency was obtained at an O3 feed rate of 0.3 mg/L/min during O3 treatment. In contrast, an O3 feed rate of 0.15 mg/L/min produced optimum degradation efficiency during O3/UV treatment. This result indicates that the O3 dose required for PPCP degradation by O3 can be reduced by combining it with UV.
5) PPCP degradation by O3 was promoted by adding H2O2 during the O3 treatment. However, when a high initial H2O2 concentration was added during the O3 treatment, formed OH radicals were likely to be scavenged by excess H2O2, leading to low PPCP degradation. Therefore, it is important to determine the appropriate H2O2 dosage during O3 treatment to improve PPCP degradation by adding H2O2 during O3 treatment.