An optical fiber-based beam width measurement technique is presented. The proposed system can be applied to the optical fiber industry in applications such as lensed fiber, optical fiber based laser beam source, and fiber optic sensor. The measurement system is composed of optical fiber, which is used as a transceiver, and a single grating panel which consists of a multi-reflection area with an even non-reflection area. The grating panel is used to vary the reflected light. When the widths of the reflection area and non-reflection area are larger than the optical beam width, the reflected light is varied at the interface between the reflection area and the non-reflection area by the movement of the grating panel. Experiments were conducted in order to verify the feasibility of the proposed technique. Multi-mode fiber combined with a collimator was selected as an emitter and a receiver, and the beam width measurement system was contrived. Subsequently, the proposed method and the system were verified by comparing the experimental results with the results of the conventional charge-coupled device technique.
Most light beams of laser based sensors, such as a laser displacement sensor, or light beams in laser cutting are assumed to be Gaussian beams. A significant parameter that affects high resolution is the spot size, which is related to the target area. Various lensed-optical fibers (wedge fiber,graded index lensed fiber, photolithographic lensed fiber)have been developed in order to facilitate flexible designs incorporating working distances and spot sizes for efficient optical coupling (Kim et al., 2004). Verifying the performance requires that the beam width is known in order to identify how much light is focalized and integrated.
Optical fiber is widely used as a light guide in fiber-based laser and sensor technology. In these sensors, the optical beam width emitted from the end of the optical fiber is a critical parameter for determining the condition of the sinusoidal signal (Feng and Kim, 2006; Kim, 2009; Lee et al.,2008, 2009). Therefore, a simple system is required to measure the emitted beam width at the end of an optical fiber.
Currently, knife-edge (Ishii et al., 2003; Wright et al.,1992) and charge-coupled device (CCD) techniques are used to measure beam widths. Knife edge techniques are capable of achieving high resolution depending on the edge shape. In comparison to the knife edge technique, the CCD technique is more economically efficient and convenient for determining the beam width and the beam profile. However,measuring beam width using the measurement systems of these techniques is complicated.
ISO 11146 specifies a standardized and alternative test method for measuring the beam width (International Organization for Standardization, 1999).
The proposed technique is similar to the moving slit and knife-edge methods. Like these methods, the beam width of fiber based emitted light can be measured within acceptable accuracy based on a simple system provided by the presented scheme. However, this scheme does not provide the beam profile.
This paper is organized as follows. The section 2 describes a beam width measurement method based on optical fiber.The section 3 describes how the method was realized and summarizes the proposed method and system and compares it to the CCD technique.
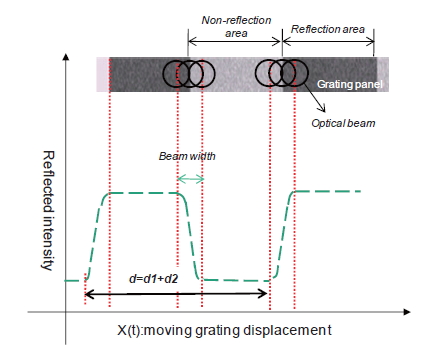
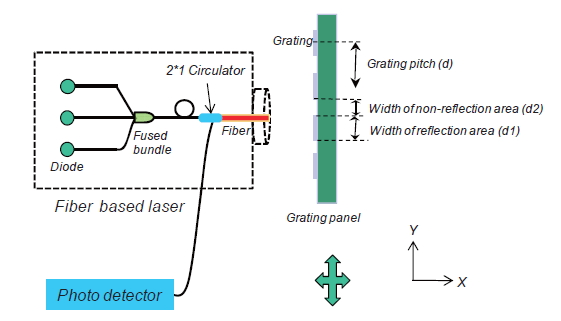
The main mechanism for the measurement of the optical fiber-based beam width using a reflective grating panel and optical fiber, which used as a transceiver, is proposed. Lee et al. (2009) presented the principle of the optical fiber sensor using a single grating panel. When the widths of the reflection area and non-reflection area were smaller than the optical beam width, he used the reflected signal as a sensor signal induced by the movement of the grating (Hecht, 2002; Lee et al., 2009). This principle was the basis of the proposed motif in this study. As shown in Fig. 1, the grating panel, which had a larger reflection area width and non-reflection area width compared to the optical beam width, was perpendicularly located in front of the end face of the optical fiber. The grating pitch d is a constant and is the sum of the width of reflection area (
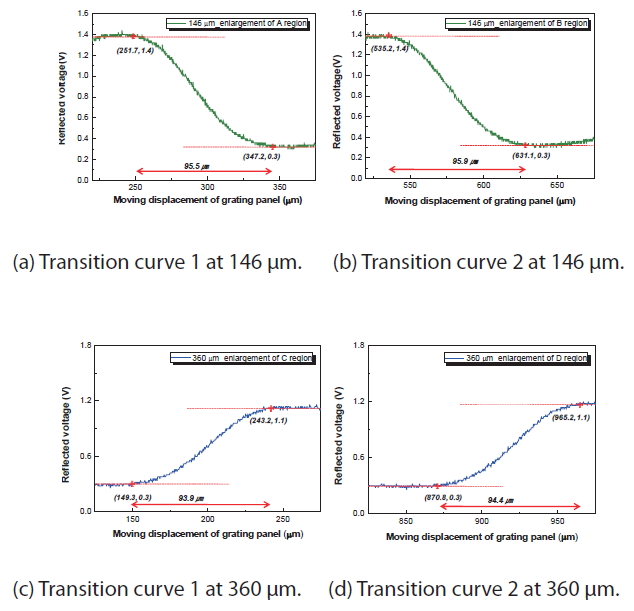
Figure 2 describes the expected reflected signal. In addition, the optical beam and a schematic diagram of the grating panel are illustrated in order to clarify the relationship between the signal and the location of the optical beam. When the optical beam is fully coupled to the non-reflection area,a constant minimal reflected signal appears, and vice versa.Consequently, the obtained reflected intensity versa time can be processed to the reflected intensity versa movement of the grating panel, because the constant velocity of the grating panel is known.
A fiber-based beam width was measured based on the aforementioned experimental set up. In order to verify the proposed technique, the CCD technique was employed.Through a comparison of the results of the two techniques, the principle proposed in this paper was verified.
3.1 Estimation of the lensed fiber beam width
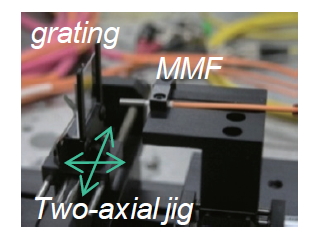
For the experiment, a MMF combined with a collimator(LPC - 05 - 1300 - 62.5/125 - M - 0.45 - 1GR - 35 - 3s - 10 - DPLX;Oz Optics Co., Ottawa, Canada) was used. A broadband source (BBS1550+2FP00, JDS Uniphase) was used as a light source, and a two-axial jig was utilized. The distance between the end of the optical fiber and the grating panel was kept as minimal as possible. The gap was kept within 0.1 mm in order to prevent scratching of the grating panel. The grating panel was moved using a continuous motor system, as shown in Fig. 3. Reflective light was obtained through a circulator and a photo detector (v2011; New Focus Inc., Irvine, CA, USA).Finally, each of the 10,000 data points of reflective light was stored in a data acquisition system.
Two grating panels in total were used to measure the beam width. Figure 4 shows the experimental results with the grating widths of 146 μm (
3.2 Comparison to the CCD technique
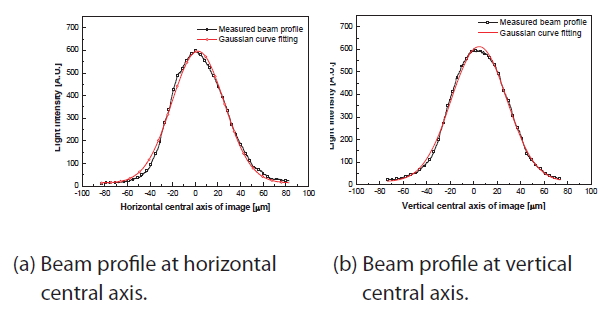
A beam width test was conducted using the CCD conventional method in order to establish a comparison.The beam profiles of the horizontal and vertical central axes were obtained and Gaussian curve fitting was then individually implemented, as shown in Fig. 5. The R-square value of each beam profile was determined to be 0.993 and 0.997, respectively.
[Table 1.] Comparison of the measured beam widths obtained from two techniques
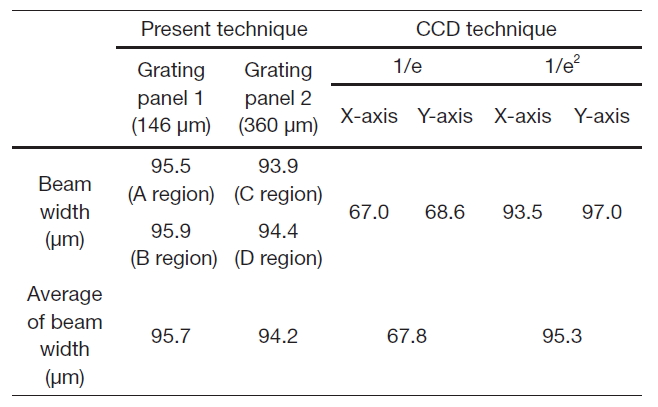
Comparison of the measured beam widths obtained from two techniques
Therefore, the measured beam profiles could be assumed to have a Gaussian distribution. The measured beam widths,which were measured for both the central row and the column axis, are described in Table 1. The beam width was investigated using three criterions based on the measured beam profile data. Following the full width at half maximum criterion, the beam widths were respectively 56.6 and 58.4μm for the central row and the column axis. Following the one over the exponential criterion, the beam widths were respectively 67.0 and 68.6 μm for the central row and the column axis. Following the one over square of the exponential criterion, the beam widths were respectively 93.5 and 97.0μm for the central row and the column axis. The estimated beam width based on the proposed technique was identical to that following the criterion of the one over square of the exponential of the CCD technique, as shown in Table 1. This indicates that the optical beam width following the criterion of the one over square of the exponential can be measured by the proposed technique. In terms of the average beam width, relative errors were 0.4 % and 1.2 %, respectively.
A fiber based beam width measurement method based on a simple and effective system was presented. The measurement head was composed of an optical grating panel and optical fiber, which acted as an emitter and a receiver,respectively. Finally, the results obtained from experiments conducted using the proposed method compared to results obtained using the CCD technique. The proposed method and system were verified for measuring the fiber-based beam width. Although the information of the beam profile could not be investigated, this method was able to acquire several data through one experiment because the grating panel had several periodic gratings.