Protuberances exist on the surfaces of almost all aerodynamic vehicles. And complex flow phenomena, such as shock-shock interactions and/or shock-boundary layer interactions, exist around the various protuberances on the surfaces of supersonic or hypersonic vehicles. Such complex flow phenomena cause aerodynamic loads and heating loads in the vicinity of the protuberances. The severity of these loads becomes greater at higher flight speeds, raising serious concern for the design of hypersonic vehicles in regards to the flow field surrounding these protuberances.Predicting the heat transfer rate around the protuberance is an imperative course of action necessary for protecting the surface of the vehicle from locally increasing heating loads.However, due to the complex flow features associated with the protuberance, this process cannot be comprehended solely through theoretical analysis.
In order to alleviate these complex issues, experimental studies conducted through wind tunnel tests, revealing qualitative flow characteristics near the protuberance based on static pressure data and Schlieren and oil flow visualization images, have facilitated thorough understanding of complex flow phenomena (Couch, 1969; Hiers and Loubsky, 1967;Kaufman et al., 1973; Sedney, 1973, 1975; Waltrup et al.,1968; Westkaemper, 1968; Whitehead, 1969). However,few experimental studies exist concerning heat transfer around the protuberances caused by aerodynamic heating(Hung and Clauss, 1980; Hung and Patel, 1984; Truitt, 1965);in addition, the quality of the data is limited. In recent studies, Lee et al. (2009) examined aerodynamic heating characteristics near the vicinity of the protuberance from measurements acquired from heat flux sensors, such as a Gordon gauge through the blow down hypersonic wind tunnel testing under a Mach number of 7.
However, the conventional blow down hypersonic wind tunnel requires a heating device in order to prevent the liquefaction of expanded air as well as supply a constant stagnation temperature resulting in greater monetary expense for its construction and operation. A solution for this financial dilemma comprises the use of hypersonic shock tunnels as a facility in which an experiment for hypersonic flows can be conducted. Many research institutions have already employed hypersonic shock tunnels because hypersonic shock tunnels do not require heating devices.In spite of the numerous advantages for using a hypersonic shock tunnel, this shock tunnel also possesses a notable disadvantage: the test time is very short, consequently requiring additional measurement devices containing fast response times such as coaxial thermocouples and thin film gauges. Such devices are usually used to obtain heat flux data. This study suggests a technique for obtaining the heat flux over the protuberance using a hypersonic shock tunnel and coaxial thermocouple. Techniques using heat flux gauges or coaxial thermocouples are point measuring techniques in which it is possible to obtain the data only in the positions where the thermo gauges are installed. Thus, it is necessary to install many gauges for good data resolution.This brings about other problems such as the expensive cost for the installation of gauges and the damages made to the test model. In order to overcome this problem, an optical technique using temperature sensitive paint (TSP) was developed . This paper also suggests techniques using TSP in order to obtain the heat flux data.
An experimental study was conducted with a two dimensional protuberance protruding from a flat plate surface in order to measure the heat flux in front of the protuberance at a hypersonic flow of Mach 7. The effect of the height of the protuberance was the only factor that was considered and which were subsequently used to compare the obtained results to the data acquired from Lee et al.’s(2009) experimental study. The data obtained from two measurement gauges were compared and the heating characteristics were analyzed in detail.
2.1.1 Hypersonic shock tunnel
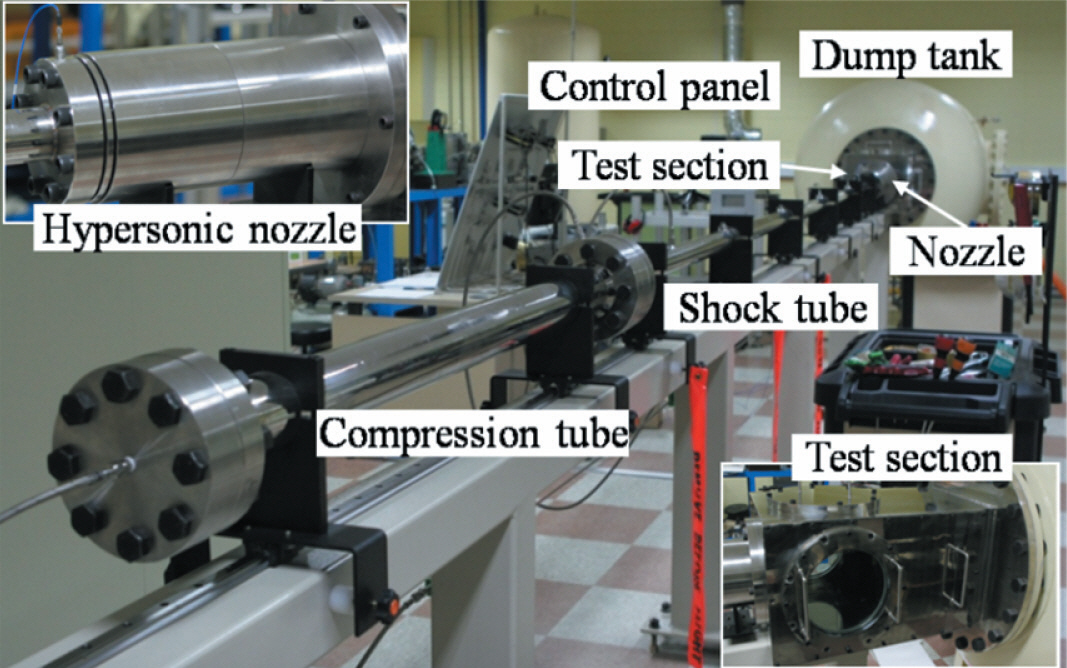
Experiments for obtaining the heat flux from the coaxial thermocouples were conducted using the hypersonic shock tunnel at the Aerospace Propulsion and Combustion Laboratory (APCL), Seoul National University (SNU). This hypersonic shock tunnel comprised of a compression tube(length 1.5 m, internal diameter 89 mm), a shock tube(length 5.2 m, internal diameter 43 mm), a hypersonic nozzle, a test section, and a dump tank, as shown in Fig. 1.The experimental conditions in the hypersonic shock tunnel varied with the pressure ratio of the pressure in compression tube to the pressure in the shock tube (Pc/Ps). Experiments were conducted at a pressure ratio of 20.4 and 78.7. The condition of Pc/Ps = 20.4 was established in order to simulate the same flow conditions presented in the investigations
performed by of Lee et al. (2009) in which a blow down hypersonic wind tunnel at University of Tokyo (UT) was used.The other pressure ratio (Pc/Ps = 78.7) demonstrated the high enthalpy condition, which was utilized to understand the heat characteristics more clearly. Figure 1 shows the hypersonic shock tunnel of SNU.
2.1.2 Blow down hypersonic wind tunnel
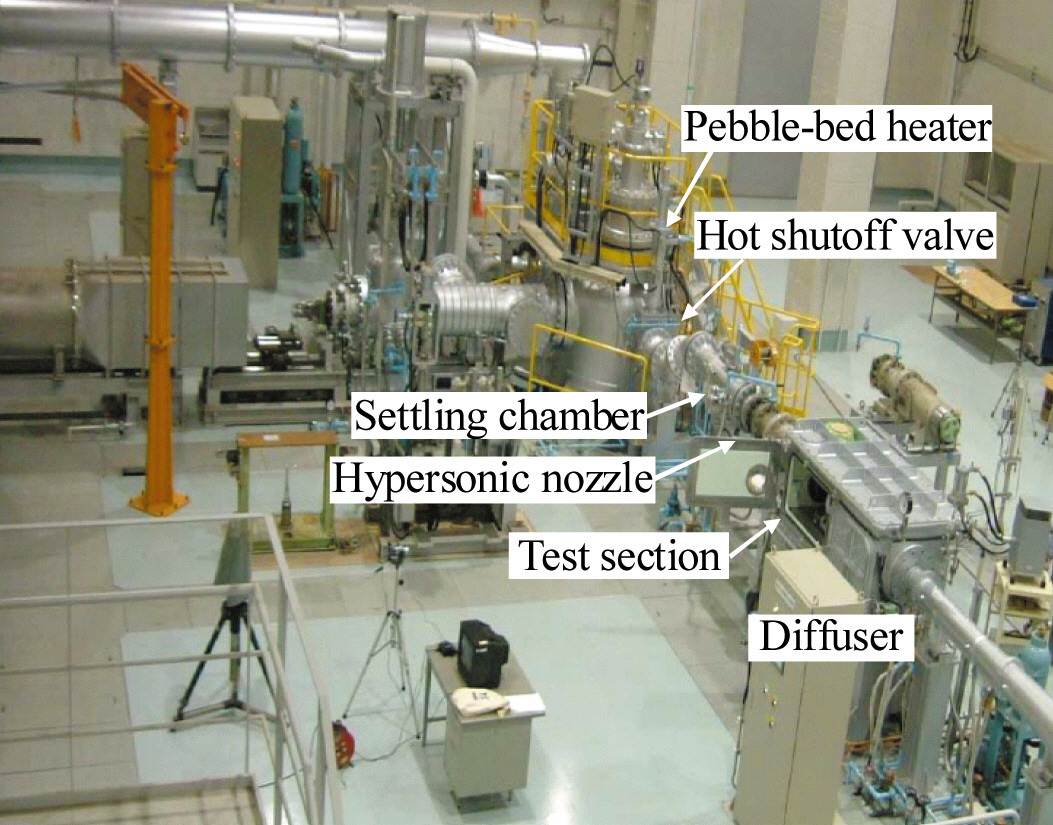
Experiments for measuring the heat flux from the TSP were conducted using the hypersonic blow-down wind tunnel at Kashiwa campus of UT. This conventional hypersonic wind tunnel comprised of a pebble-bed heater, a hot shut-off valve, a settling chamber, a hypersonic nozzle, a test section,and a vacuum tank, as shown in Fig. 2. All the experimental conditions were set: the stagnation pressure and the temperature were set to 0.95 MPa and 600 K, respectively,at the settling chamber. The static pressure of the inflow was approximately 200 Pa, and the unit’s Reynolds number was 2.0 × 10⁶/m. The maximum cross sectional area of the test model was about 1,300 mm2, which corresponds 4% of the nozzle exit area. The diameter of the visualization window,which was located at the side and upper surface of the test section, was 200 mm. The experimental conditions in this study are summarized in Table 1, and they match Lee et al.’s (2009) experiment. Figure 2 shows the hypersonic wind tunnel of UT.
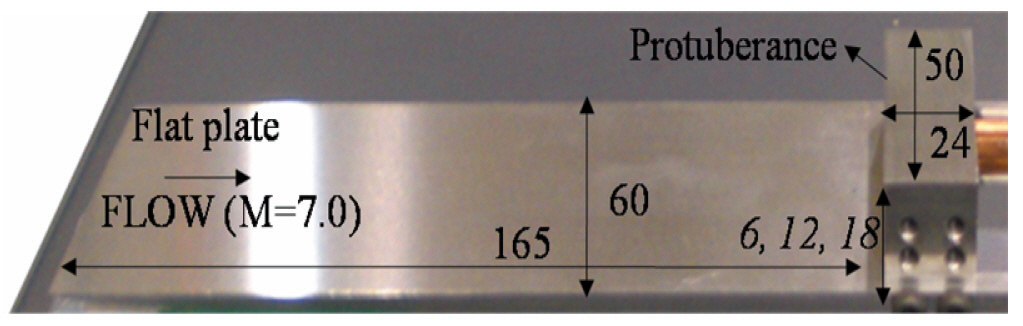
The test model consisted of a flat plate and a two dimensional object protruding from the flat plat, as shown in Fig. 3. All parts were composed of stainless steel (SUS 306). The length of flat plate was determined to be 165 mm.The height of the protuberance was determined following the measurement of the length of the flat plate. The height of the protuberance was a necessity for the prediction of the boundary layer thickness due to the fact that the flow field around the protuberance is related to the boundary layer thickness immediately upstream from the protuberance.The Blasius equation was used to calculate the boundary
[Table 1] Experimental conditions
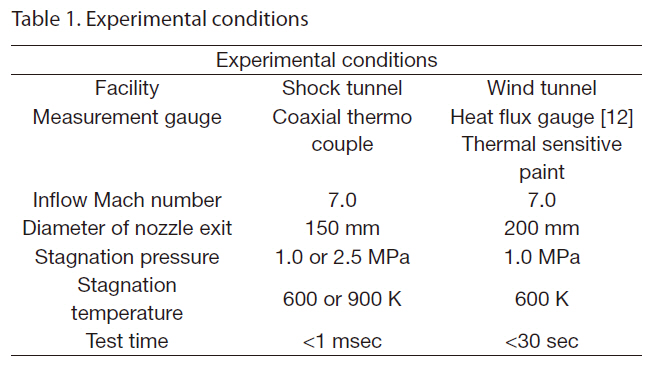
Experimental conditions
layer thickness at the end of the flat plate because the flow was determined to be laminar. The calculated boundary layer thickness was 1.4 mm. With the diameter of the coaxial thermocouple (2.0 mm) and the calculated boundary layer thickness (1.4 mm) taken into consideration, it is impossible to submerge the protuberance in the boundary layer. Thus,the protuberance was designed to have a basic height of 6 mm from the flat plate, and to be raised at intervals of 6 mm.The designed test model is shown in Fig. 3.
2.3 Experimental data acquisition
Two techniques were applied to measure the heat flux. The results acquired from both techniques were subsequently compared with that of Lee et al.’s (2009) experimental investigations. The first technique comprised using a coaxial thermocouple with a very fast response time and the impulse hypersonic shock tunnel. The test time was very short, below the order of 10 ms, and the coaxial thermocouple that contained a very fast response time in the order of 1 μs. Using coaxial thermocouples, a surface temperature was measured during the test time. Through one dimensional and semiinfinite body assumptions, the heat flux was obtained from the converted temperature distribution with the test time by Eq. (1) (Buttsworth et al. 2005; Ohmi et al., 2006).
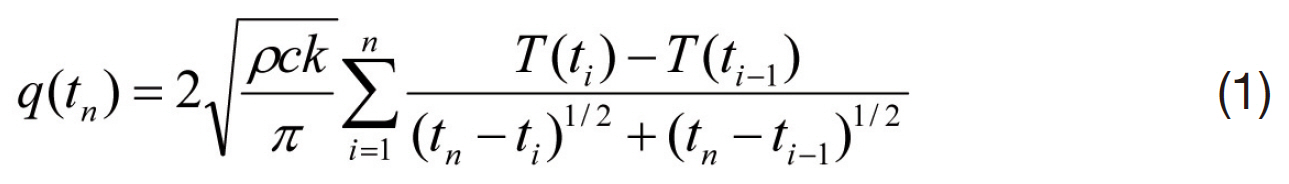
where, q and T are the heat flux and the temperature respectively, ρ, c, k are density, specific heat and the thermal conductivity coefficient of the thermocouple material,respectively.
The second technique employed TSP and the blow down hypersonic wind tunnel. When illuminated with light at an appropriate wavelength, the sensor molecules of the TSP become electronically excited to an elevated energy state and then undergo a transition back to the ground state by several mechanisms, such as radiative decay and non radiative decay through release of heat (Liu and Sullivan,2005; Nakakita et al. 2003). Therefore, the luminescence of the TSP coating decreased with increasing temperature. The intensity of the luminescence was measured by a charge-coupled device (CCD) camera during the test and was transformed to a temperature value by Eq. (2), which was obtained through calibration tests and fitted to a polynomial equation through regression techniques (Bell et al., 2001;Ohmi et al., 2006). The spatial temperature variation of all surfaces was measured over the entire test time, but the heat flux was obtained through the same procedure as the second technique from the temperature data at the initial test time in which a one dimensional semi-infinite assumption was valid.The composition of the TSP used in this study was as follows;the luminophore is dichlorotris(1,10-phenanthroline)-runthenium(II) hydrate, that is Ru(phen)32+,the binder is polyacrylic acid and the solvent is ethanol. Ru(phen)32+ is known to have a high temperature sensitivity near room temperature and is often used in wind tunnel testing. The concentration of Ru(phen)3 2+ with respect to the volume of poly acrylicacid is 10-2 mol/liter.
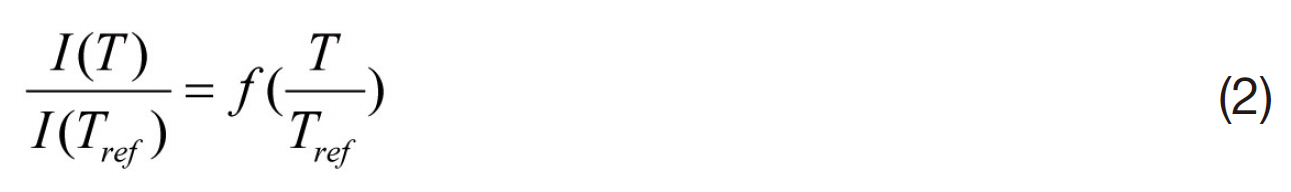
where, I and T are the intensity of luminescence and the temperature, respectively.
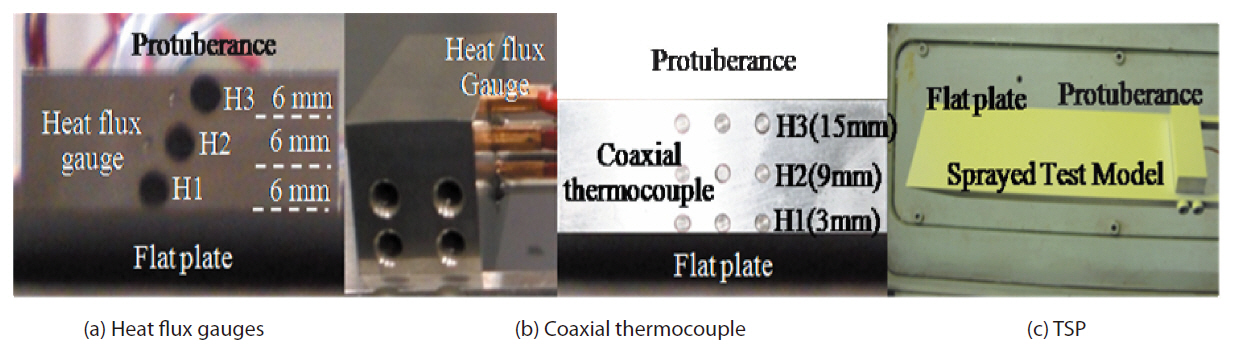
The pictures of gauges installed in the test model are
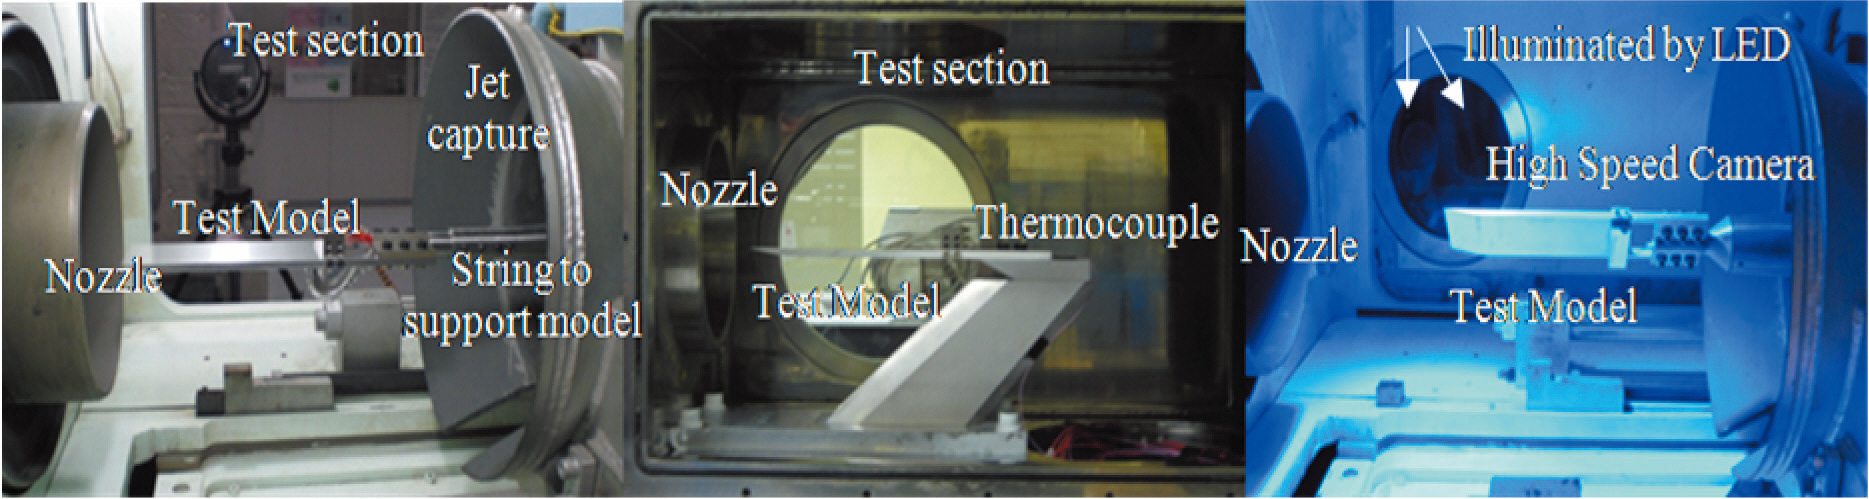
presented in Fig. 4. Lee et al.’s (2009) experimental test model incorporating heat flux gauges was also considered as a means to facilitate an easier understanding of the experimental set up. Figures 4a and b show the installed heat flux gauges and the coaxial thermocouples in front of the protuberance,respectively. For convenience, the gauges were named by H1, H2 and H3 from bottom to top of the protuberance, as shown in Fig. 4. The gauges were installed at intervals of 6 mm and the center position of the gauges was 3 mm (H1), 9 mm (H2) and 15 mm (H3) from the flat plate. Figures 5a and b show the test models installed in the test section of both the hypersonic wind tunnel and the hypersonic shock tunnel.The lead cables of the installed gauges were connected to the data logger through the multi-pin connector for vacuuming and the signal amplifier as shown in Figs. 5a and b. Figure 4c shows the test model in which the TSP was sprayed on the surface of the flat plate and the protuberance. Unlike point measuring techniques using heat flux gauges and thermocouples, it is possible to measure the heat flux on all surfaces of the test model, as shown in Fig. 4c. After the sprayed test model was installed, a blue beam with a wave length in the range of 430-450 nm irradiated on all surfaces uniformly, as shown in Fig. 5c, using two illumination light sources (LED-A294, Hamamatsu, Japan) at the top surfaces of the test section. During the wind tunnel test, the intensity of the luminescence with a corresponding temperature rise
was obtained using a high speed camera (SA5, Photron,Japan) with a high pass filter of 560 nm.
3. Experimental Results and Discussion
3.1 Heat flux measurement using coaxial thermocouples and hypersonic shock tunnel
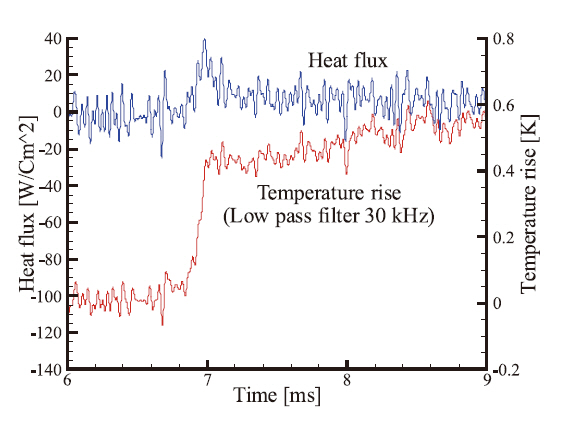
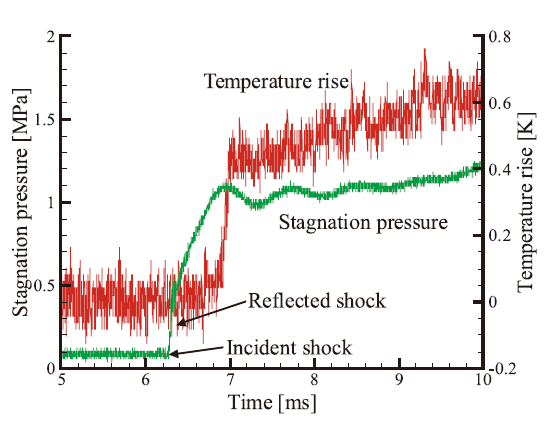
The hypersonic shock tunnel at SNU was operated using the shock generated from the pressure difference between the compression tube and the shock tube at the point in which the diaphragm between the two tubes ruptured. This pressure,deemed “burst” pressure, of both tubes were measured using conventional strain gauge pressure transducers, and the stagnation pressure was measured using a dynamic piezoelectric pressure sensor. Figure 6 shows the stagnation pressure distribution of the hypersonic shock tunnel and the temperature rise distribution in front of the protuberance at the burst pressure ratio (Pc/Ps) of 20.4 (compression
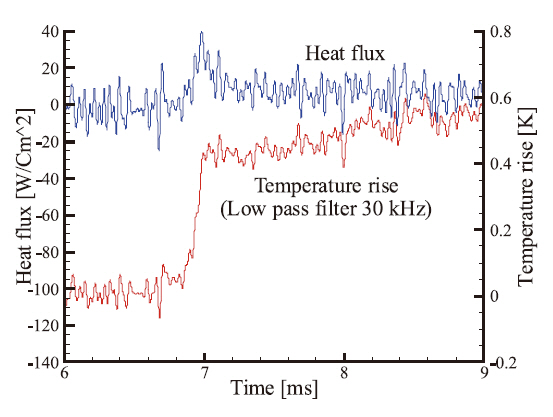
tube: N2, Pc = 20.4 bar, shock tube: Air, Ps = 1.0 bar) using the protuberance of height 18 mm and the measurement position of H3. At this burst pressure ratio, the measured stagnation pressure was approximately 1.1 MPa, correlating well the value of 1.2 MPa obtained through theoretical analysis for a shock tube. Based on this result, the stagnation temperature was predicted to be 600 K using theoretical analysis. Therefore, it can be estimated that the experimental condition using the impulse hypersonic shock tunnel at SNU at the burst pressure ratio of 20.4 is very similar to that using blow down hypersonic wind tunnel at UT. As shown in Fig.6, the temperature at the front surface of the protuberance was about 0.5 K at a time near 7 ms, which is not a large value in comparison to the noise signals. Post-processing, such as noise reduction or smoothing techniques, proves to be an imperative function when taking heat flux measurements using a fast response thermocouple. For sufficient noise reduction, coaxial thermocouples were made to sink into cool water at a temperature of 0°C. A temperature decrease was measured. Through this testing, the positive signals where the temperature seems to rise were regarded as noisy signals and the lowest frequency measured by this method was approximately 30 kHz. Based on this result, a low pass filter of 30 kHz was applied to the raw data and a heat flux was then calculated using Eq. (1). Figure 7 shows the temperature rise distribution in which a low pass filter of 30 kHz was used and the heat flux distribution calculated from that temperature rise. The results show that the heat flux clearly increased at a test time of 6.8-7.2 ms, which corresponds to 20-40 W/Cm2 and the time mean value during the test time was 24.6 W/Cm2. This value is similar to the averaged heat flux with time measured using the heat flux gauge in Lee et al.’s (2009) experiment, which was 27.6W/Cm2. On the other hand, it was very difficult to observe the heat flux variation at positions H1 and H2 because the temperature rise was too small, although post-processing using low pass filter was applied.
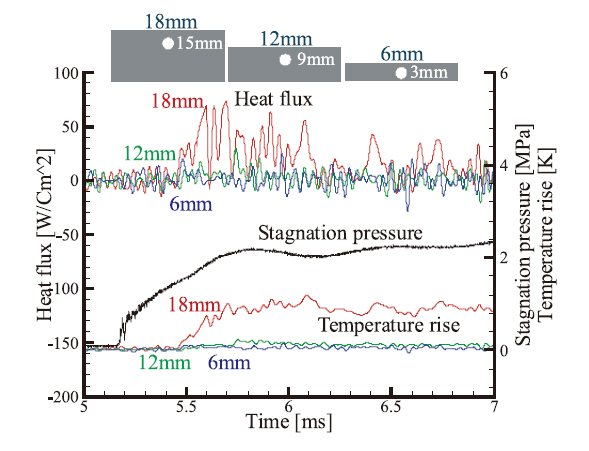
An experiment was conducting incorporating high enthalpy conditions in order to identify the relationship between the heat flux and the protuberance height and measuring position. All experimental conditions remained the same, except for the stagnation temperature. Figure 8 shows the variation of temperature and heat flux with time at the burst pressure ratio of 78.7. The protuberance height was 18 mm. During 5.5-6 ms, the heat flux and temperature displayed a significant increase at the position H3, but those variations were not observed at positions of H1 and H2.The measured heat flux was below 10 W/Cm2 at H1 and H2,but the heat flux was about 70-100 W/Cm2 at H3. Figure 9 shows the variation of temperature and heat flux when the protuberance height varied. The results show that the heat flux decreased as the protuberance height decreased. This
finding demonstrated the same tendencies as that of the previous experiment in which a blow down wind tunnel incorporating heat flux gauges was used.
3.2 Heat flux measurement using TSP and the blowdown hypersonic wind tunnel
The purpose of using TSP was to develop a general understanding of the aerodynamic heating characteristics near the vicinity of the protuberance; TSP facilitated the visualization of the temperature rise and heat flux in all surfaces ahead of the protuberance. An important procedure to undertake during the TSP experiment was to uniformly spray the TSP with a proper thickness. A section of the sample plate was covered by masking tape during the TSP spraying. The tape was then removed, revealing an unpainted section, used to measure the thickness of the applied TSP.A confocal laser scanning microscope was used to measure the thickness of the TSP layer on the sample plate. The microscope used in this study had an A/D resolution of 12 bits and a pixel resolution of 0.01 mm (maximum 1024 ×1024 pixels). The layer thickness was evaluated from a step in the height between the TSP layer and the base plate. The TSP was sprayed uniformly with 0.17-0.2 mm for all the experimental conditions. A TSP thickness layer of 0.2 mm is ideal when performing wind tunnel tests and applying the semi-infinite assumption (Liu and Sullivan, 2005).
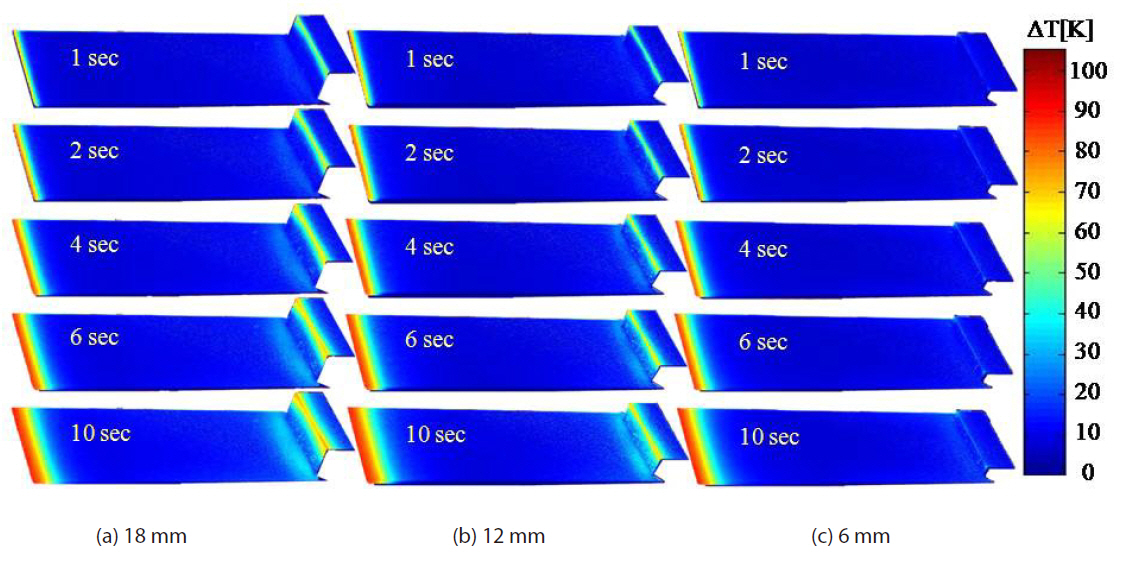
The images of the sequential temperature rise at the protuberance and the flat plate are shown in Fig. 10.Although the heat flux was calculated from the temperature data of an initial test time within 30 ms, the observation of the temperature variation of the whole test time was still necessary because the general aerodynamic heating characteristics and the locally concentrated heating position was understood more easily. The temperature rise took place near the leading edge and immediately upstream the region of the protuberance at the flat plate. The local temperature increased largely near the top edge of the protuberance.The two regions in which the local temperature increased at the flat plate can be explained from the flow visualization images produced by the experimental studies of Lee et al.(2009). The temperature rise near the leading edge region of the flat plate was caused by the oblique shock occurring at the wedge of the lower surface. The temperature increase caused by the separation bubble, which exists in front of the protuberance experienced at the region upstream of the protuberance at the flat plate, garnered concern. For the front surface of the protuberance, a sharp temperature increase was observed over two-thirds of the protuberance from the flat plate, and aerodynamic heating was severely applied near the top edge. This heating rate decreased for a shorter protuberance. Sudden temperature increases were not observed for a protuberance of height 6 mm. This is mainly because a bow shock was not generated near the top edge of the protuberance as was totally submerged under the separation region, as shown in Fig. 10.
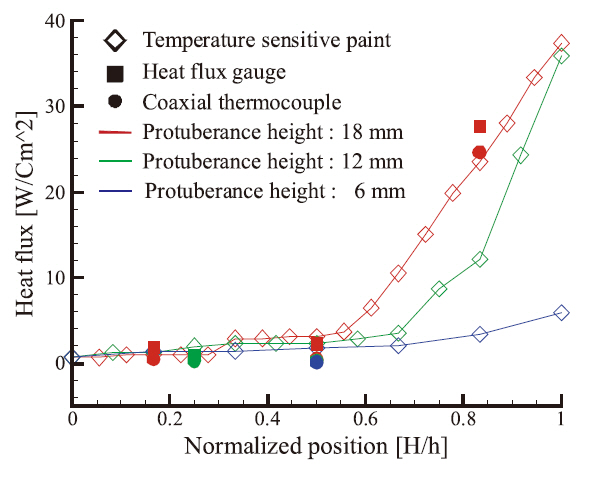
Figure 11 shows the heat flux distributions for different protuberance heights using each measurement device. The heat flux data using heat flux gauge in Lee et al.’s (2009)experiment are represented together. The horizontal axis of Fig. 11 represents the measuring position which is normalized by the height of the protuberance. All measured or calculated heat fluxes are the averaged values with the test time. The heat flux values based on the temperature changes with time, such as the cases using thermocouples and TSP,are slightly lower than that obtained using the heat flux gauge, but the three result sets correlate well as a whole. It is presumed that this difference in the heat flux is caused by
the fluctuating temperature data. The aerodynamic heating characteristics as mentioned before can be observed more clearly from Fig. 11 in which the heat flux becomes larger as the protuberance becomes higher; additionally, the heat flux was larger at higher positions than lower ones. The heat flux started to increase suddenly at height of about 0.6-0.7 of the protuberance height ranged from 12 mm and 18 mm.However, for the case of the protuberance of height 6 mm,there no jump occurred in the heat flux due to the fact that no shock developed near the protuberance as it was submerged into the separation region. This result suggests that the aerodynamic heating was not severe when the protuberance was sufficiently small in spite of its exposure to hypersonic flows.
An experimental study was conducted to measure the heat flux ahead of a protuberance at hypersonic flows using fast response thermo gauges, such as coaxial thermocouples and TSP. Experimental techniques and data acquired from the experimental investigations were presented in this paper.The acquired data were compared to the experimental studies conducted by Lee et al. (2009) in which a blow down wind tunnel and heat flux gauges were used. The comparison demonstrated an attractive correlation, producing a clear understanding of the protuberance heating characteristics.
Aerodynamic heating was severely applied at the front surface of the protuberance. Basically, the overall heat flux increased as the height of the protuberance increased.Additionally, the heat flux was greater at higher positions than at lower ones. During instances in which the protuberance was high, the bow shock developed at the upper tip of the protuberance and the heat flux started to rise at about 0.6-0.7 of the height of the protuberance. Also the heat flux rise under an inflow condition in which the stagnation temperature was high exhibited a greater value at higher regions than at lower regions. However, even if the protuberance was higher than the boundary layer thickness immediately upstream, a bow shock did not develop at the tip of the protuberance as the protuberance was totally submerged under the separation region when it was sufficiently short. As a result, the rise of the heat flux was very small. These results suggest that the aerodynamic heating was concentrated near the tip of the protuberance for high protuberances but was not large at any position when the protuberance was sufficiently short.The experimental results will be used for the prediction of the heat flux in front of protuberances, and validation data will be obtained via numerical analysis. The experimental techniques presented in this paper will be conducive for hypersonic wind tunnel testing, such as flow visualization,and for the measurement of the heat flux in high speed flows.