

The external fuel tank of an F-5 E/F has a fuel capacity of 150 gallons. Furthermore, this particular fuel tank is cylindrically shaped with a cone-type nose and tail. The tank has vertical and horizontal fins that ensure longitudinal and directional stability if the tank needs to separate safely from an aircraft.Fatigue crack propagation has occurred frequently at the after-joint corner of the horizontal fin, which is composed of magnesium alloy. Fatigue crack extension occurs mainly because of the repetitive vibrating action of an aerodynamic load. Thus, the life cycle of the horizontal fin is shortened,resulting in a demand to replace magnesium alloy (Kang and Yoon, 2008). In order to investigate a new material that can replace magnesium alloy and to suggest an optimized design, the analyses of separation problems are required.
Store separation analysis is defined as the determination of the position and altitude histories of a store after it is deliberately separated or ejected from the aircraft while the store is still in the complex non-uniform flow field near the aircraft (Spahr, 1974). In earlier studies, store separation was conducted mainly in a hit or miss fashion?the stores would be dropped from the aircraft at gradually increasing speeds until the store closely approached or sometimes actually hit the aircraft. Traditionally, separation testing has relied on flight tests which comprised a difficult, time-consuming, and expensive process (Kim et al., 2006). During the 1960’s, the captive trajectory system (CTS) method for store separation wind tunnel testing was developed. Prior to this, the free-drop testing had been used. The grid test technique is provided as an alternative method to the CTS technique (Cenko, 2009).Aerodynamic grid data are used to compute trajectories after testing, and they allow for numerous parametric studies(Veazey, 2004). Recently, the need of wind tunnel testing has been recognized for store separation analysis. Such testing could be used in the preliminary design stages, ultimately reducing the number and magnitude of full-scale flight drop tests.
In this research, free-drop tests were conducted using a 15% scaled model to analyze store separation characteristics of external fuel tanks for various flight conditions. In addition,off-line 6-degree of freedom program for store separation was developed. Store separation trajectories based on grid tests were also obtained to verify the results of free-drop tests.
Wind tunnel models of most aircraft and external stores must be scaled down in order to fit within the wind tunnel test section. During free-drop tests, researchers should consider the effects caused by gravity and inertial force. When a model is scaled down, aerodynamic forces and moments decrease in proportion to the characteristic area of the model. However, the effect of gravity decreases in proportion to the volume of the model. Therefore, free-drop test models must be designed to meet dynamic similarity criteria to the actual full scale simultaneously with geometric similarities.There are three methods for achieving dynamic similarity:Froude scaling, heavy scaling, and light scaling (Them and Chiang, 1970).
In this study, the Froude scaling method was employed.Each parameter is calculated using following expressions(Barlow et al., 1999),
where λ is a scale factor between the model and full scale,and
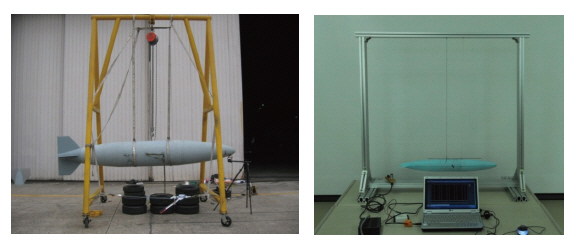
In order to calculate the moment of inertia (MOI) of a real fuel tank, the period is measured using the bifilar swing method as shown in Fig. 1. The MOI is calculated using the following expression (Yoon et al., 2009),
where,
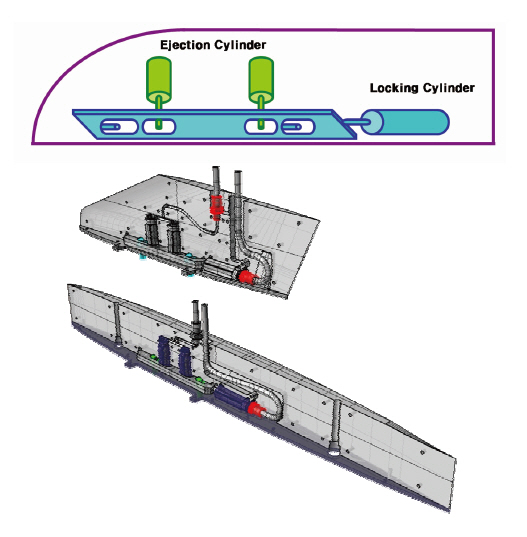
Since the store is released from the body of an aircraft by means of piston type ejectors, ejector modeling is a highly important parameter. Ground tests of ejectors are the best source for data to build and validate building and validating ejector models (Keen et al., 2009). These results are given in Table 1. The initial downward ejection pressure was 0.413MPa. Ejector modeling and layouts are illustrated in Fig. 2.
[Table 1] Measurements and calculated ejection pressure
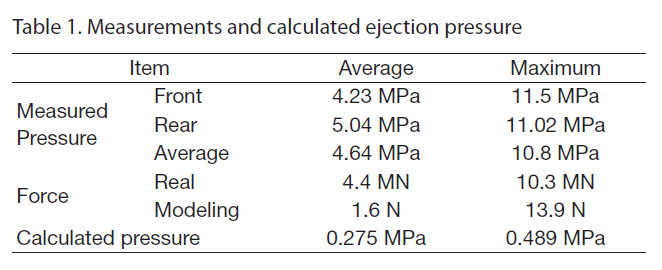
Measurements and calculated ejection pressure
2.4 Experimental setup and process
A subsonic wind tunnel located at the Republic of Korea Air Force Academy was used for conducting the experiment.The facility is a continuous, closed-loop, subsonic wind tunnel with a test section of 2.45 m high, 3.5 m wide and 8.7 m long. The turbulent intensity is less than 0.05% for
the available test section speed range from 5 to 92 m/s. The contraction ratio is 7.26:1, flow angularity is less than 0.1°,and the axial turbulence intensity is 0.04% at the free stream velocity of 74 m/sec (Cho et al., 2009).
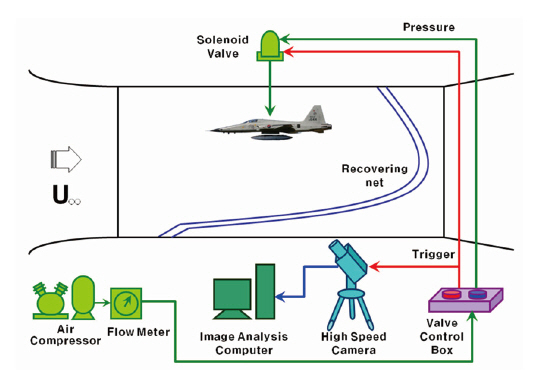
The experimental scheme of a free-drop test is illustrated in Fig. 3. The aircraft model was mounted under the ceiling of the test section. The store attached on the aircraft was ejected by air pressure controlled with a solenoid valve. The control of the solenoid valve was synchronized with a high-speed camera (500 fps) using a valve control box. The dynamic motion of the tank separation from aircraft was filmed by the high-speed camera. There was a recovering net in the lower portion of the test section in order to protect the models and the structure of test section (Yoon et al., 2008).
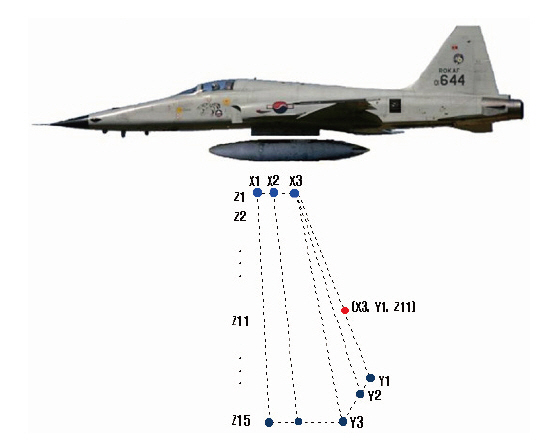
Grid points must be located at which the aerodynamic loads acting on the tank would be measured must first be measured. Grid points were determined by free-drop in order to make the covered area large enough for all potential trajectories and narrow enough for test efficiency. Grid points and the reference coordinate system used for longitudinal(
The reference line was defined from the results of the freedrop test; the reference point was (X2, Y2, Z1). Along the longitudinal axis X1 was set to be located 32 mm forward and had a 3.3° inclined angle with respect to the reference line,and X3 was set to be located 64 mm backward and had a 9.9°inclined angle with respect to the reference line. Along the lateral axis Y1 was set to have a 4° inclined angle with respect to the reference line, and Y3 was set to have a 8° inclined angle with respect to the reference line. Along the vertical axis, 15 points were chosen in order to have a population of
dense positions close to the airplane. Therefore, aerodynamic forces and moments were measured on 135 points.
3.2 Experimental setup and process
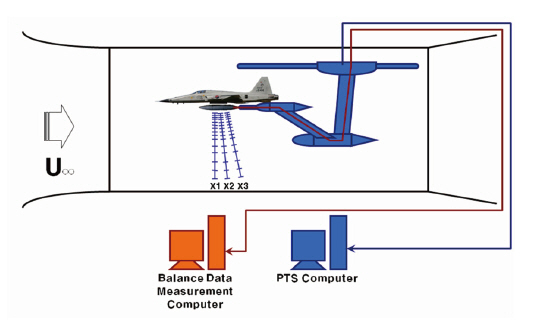
In general, the grid test was performed to validate the freedrop trajectories. The experimental setup for grid testing is shown in Fig. 5. The setup consists of a probe traverse system (PTS), PTS computer and balance data measurement computer. The store was mounted on the PTS installed in the ceiling plate. Store positions and attitudes were completely controlled automatically by PTS computer. The aerodynamic forces and moments were measured with a balance data measurement computer in order to obtain the aerodynamic coefficients at each grid point.
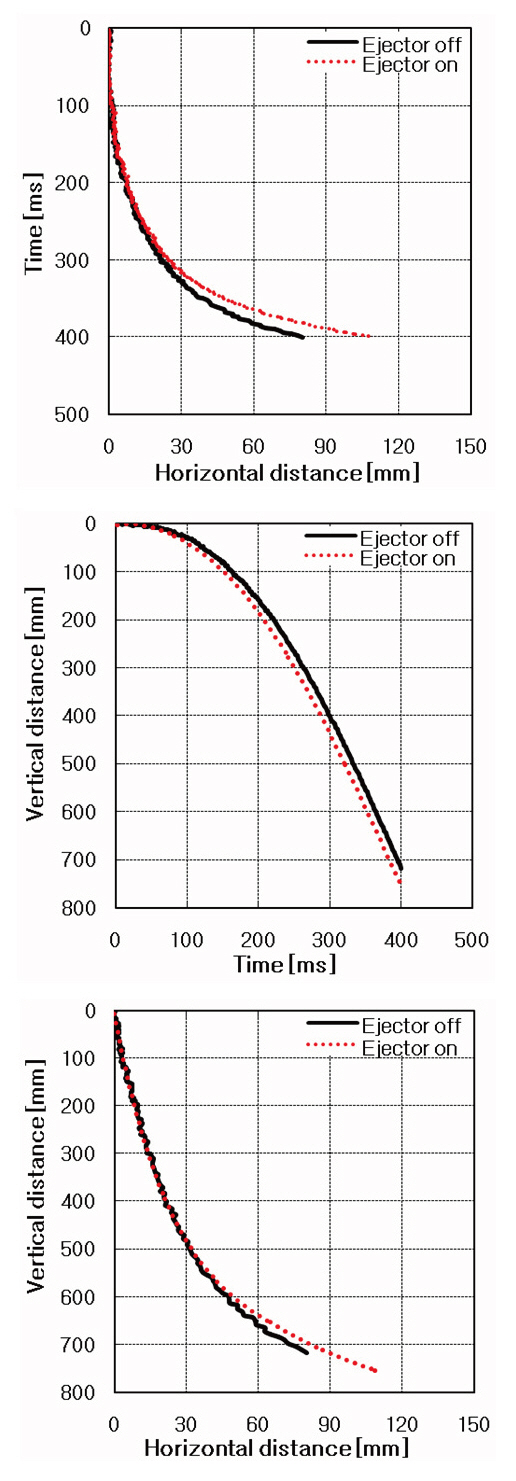
The results of free-drop tests are shown in Fig. 6. This figure shows the differences of store trajectories with and without the ejector force. This result indicates that ejector force contributed to safe store separation because the ejector
force increased both of the horizontal and vertical distances after the store is separated from aircraft launcher.
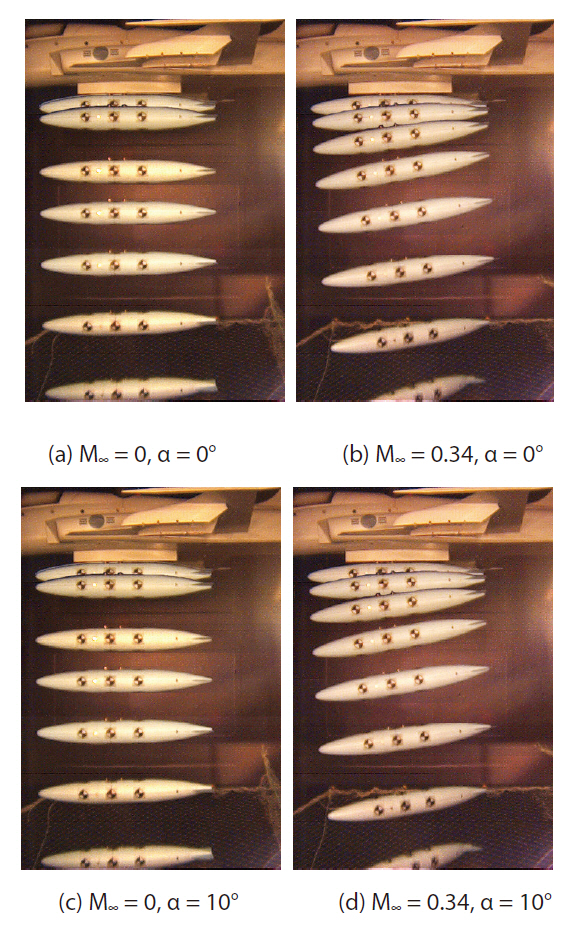
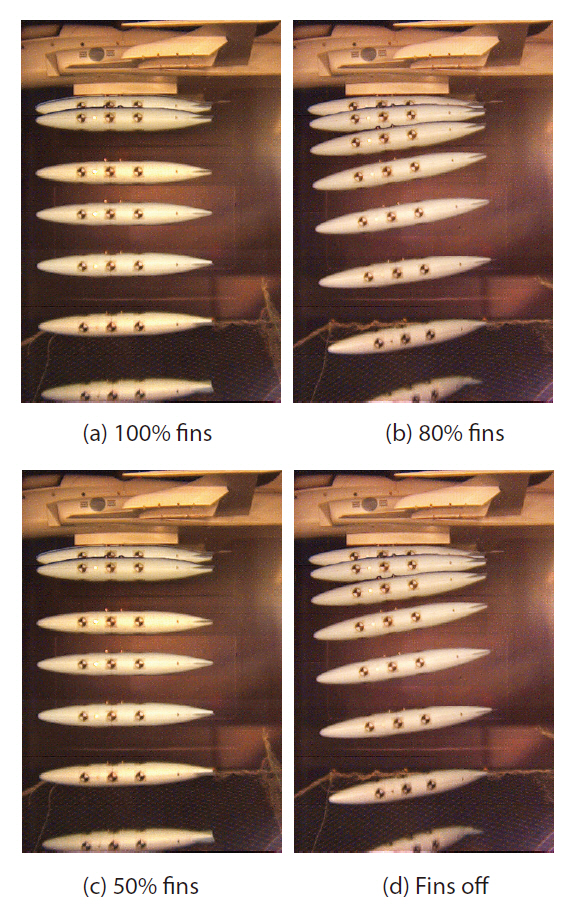
The photo image results of the free-drop test are presented in Figs. 7-10. Each photo image consists of pictures at same time interval. The time interval between the frames of each picture was 60 ms.
There were four sets of flight conditions of interest. The first in Fig. 7 was Mach number and an angle of attack, (a) M∞= 0 and α = 0°. The second was (b) M∞ = 0.34 and α = 0° which is considered as the normal separation condition. The third was (c) M∞ = 0 and α = 10°. The last was (d) M∞ = 0.34 and α =10° which is considered as an unusual separation condition.Comparisons of Figs. 7(a) and (b) were investigated in order to examine the influence of velocity on the system. When comparing the results of Fig. 7(d) with those of Fig. 7(b), a reduced separated distance was observed at a high angle of attack. As observed, the higher angle of attack was more dangerous than the normal situation.
To investigate the effectiveness of the horizontal fin area,attitudes of the separated store were acquired with various fin areas. The results of the three free-drop test trajectories with various fin areas are presented in Fig. 8, and indicate that a discernible difference exists between fins-on and finsoff. That is, the horizontal fin is essential to longitudinal static stability.
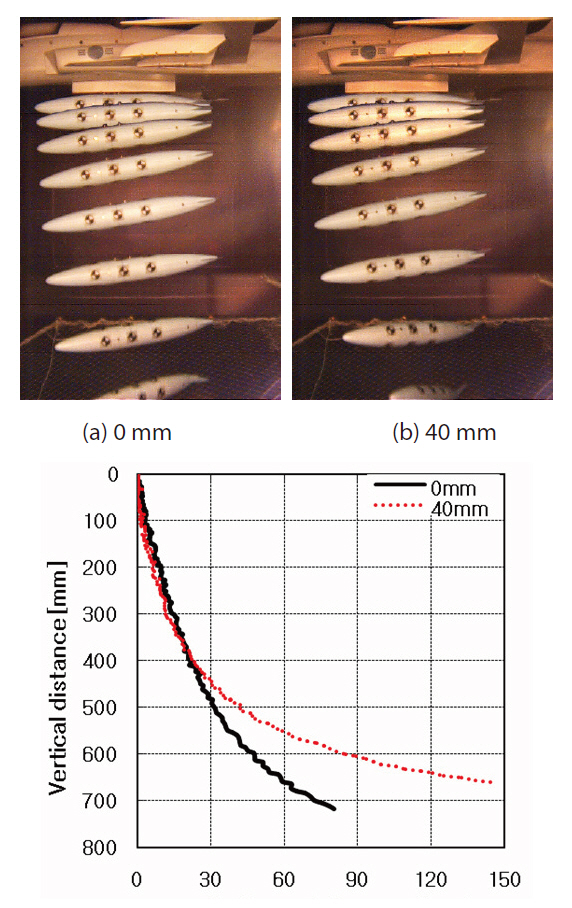
The horizontal position of the center of gravity (cg)affects the attitude of the separated store. As the cg moves aft, the results show that the longitudinal static stability of the store decreases. The store in Fig. 9(a) illustrates the original cg position, and the store in Fig. 9(b) illustrates a cg position 40mm backward. As shown in Fig. 9, the cg position influences the horizontal separated distance as well as the vertical separated distance because of the affected attitude of the separated store.
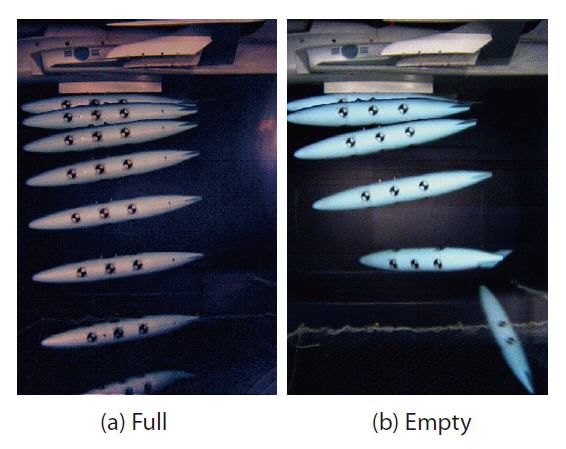
An assumption that we maintained during the test described above is that the fuel tank is full during normal store separation because store separation happens only during an emergency after take-off. But, for a situation such as dogfighting, unusual separation must be considered.Separation of an empty fuel tank is the most dangerous scenario because ratio of volume to mass is the highest(Keen et al., 2009). A comparison of separation behavior was evaluated for the two cases?with fuel and without fuel.This comparison is presented in Fig. 10. The most significant influence of aerodynamic interference on the store can be observed for an empty fuel tank. Because no uniform flow by a covering net existed, the attitude of the store changed in the end portion of the trajectory. This analysis indicates a strong dependence on the separation trajectory to the quantity of fuel.
Wind tunnel data are the basis for high fidelity grid test trajectory predictions. Thus, the computer program uses 6 degree-of-freedom trajectory calculations to compute the motion of the store (Kang et al., 2010).
As the store separation data were obtained from the grid
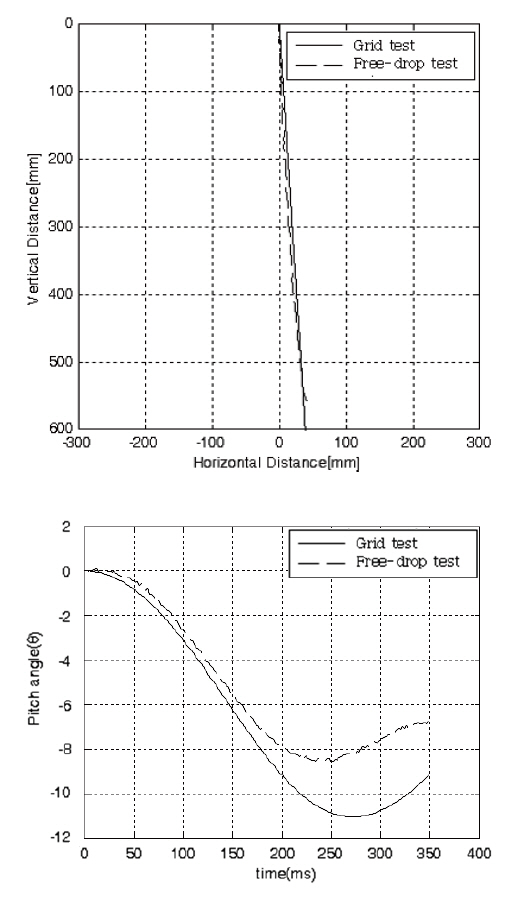
test at each grid points, trajectory simulation using these data after extrapolation can be compared with the freedrop test results. This comparison was conducted in order to verify the result of the free drop tests. Examination of the computational and observed displacement histories in Fig.11 exhibits an excellent agreement between the two. Notable differences between the computational and observed results appear in the latter part of the pitch angle history.This is considered mainly due to the recovering net which is installed in the lower portion of the test section.
Several cases were investigated using free-drop tests to examine the store separating characteristics of external fuel tanks. From the results, the analyses showed that the store could be satisfactorily ejected at a Mach number of 0.34.However, serious store separation problems occur only if the center of gravity is too backward for high attitudes and with fins-off.
Grid tests were also conducted in order to validate the accuracy of the free-drop test. The free-drop test and grid test trajectories correlated well with one another, especially in the early stages of the store separation.
