Activated carbon was prepared from pre-carbonized petroleum coke. Textural properties were determined from studies of the adsorption of nitrogen at 77 K and the surface chemistry was obtained using the Fourier-transform infrared spectrometer technique and the Boehm titration process. The adsorption of three aromatic compounds, namely phenol (P), p-nitrophenol (PNP) and benzoic acid (BA) onto APC in aqueous solution was studied in a batch system with respect to contact time, pH, initial concentration of solutes and temperature. Active carbon APC obtained was found to possess a high surface area and a predominantly microporous structure; it also had an acidic surface character. The experimental data fitted the pseudo-second-order kinetic model well; also, the intraparticle diffusion was the only controlling process in determining the adsorption of the three pollutants investigated. The adsorption data fit well with the Langmuir and Freundlich models. The uptake of the three pollutants was found to be strongly dependent on the pH value and the temperature of the solution. Most of the experiments were conducted at pH 7; the pH(PZC) of the active carbon under study was 5.0; the surface of the active carbon was negatively charged. The thermodynamic parameters evaluated for APC revealed that the adsorption of P was spontaneous and exothermic in nature, while PNP and BA showed no-spontaneity of the adsorption process and that process was endothermic in nature.
Increasing requirements for water, linked with limited resources, have compelled changes in water system management. The reconditioning of water allows the reuse of waste water after its purification by physicochemical methods. Activated carbon is widely used as an adsorbent in the decontamination processes because of its high efficiency and removal capacity.
Activated carbon is a carbonaceous material with a well-developed porous structure; it can be made from any substances containing high amounts of carbon. The raw material has a very large influence on the characteristics and performance of the resulting activated carbon. There have been many studies on the production of low-cost activated carbon from agricultural wastes [1-5], coal [6,7] and petroleum coke by-products [8-10].
The most reliable process for removing of aromatic compounds from aqueous solutions is adsorption employing activated carbon as the adsorbent [11-14]. The adsorption of aromatic organic molecules from water onto activated carbon has garnered increasing interest during the last three decades, in which there have been phenomena of over population and industrial expansion leading to the increase of human activity and consequently to an increase in environmental pollution. Activated carbon is widely used for separation and purification processes involving aqueous solution systems.
Cokes are by-products of the petroleum industry. It is wellknown that petroleum coke (PC) is a good precursor for preparing high surface area activated carbon because of its high carbon content, low volatility and good ash content. PC was selected as a raw material because it is abundant and cheap.
Generally, activated carbon can be prepared via a physical or chemical method. The chemical activation of petroleum coke with potassium hydroxide (KOH) or with sodium hydroxide (NaOH) has been successfully used in the preparation of activated carbon [9,15].
The adsorption of aromatic compounds onto the surface of carbonaceous materials is affected by the properties of both the adsorbate and the sorbent, including the physical nature of the adsorbent, the pore structure, the ash content and the functional groups. The chemical nature of the adsorbate, its solubility, molecular weight, size and shape, and the type of functional groups present all have significant effects on the behavior of adsorbate [16-19]. The solution conditions, such as pH, ionic strength, and the adsorbate concentration are also very important.
Adsorption of aromatic compounds, particularly phenols,from solution has been studied extensively [20-22]. It was found that the uptake of phenol is a combined effect of physisorption and surface polymerization. Phenol uptake increases as a result of the removal of carboxylic functional groups from the carbon surface. Gasten and Weiss [23] have suggested a mechanism that is consistent with the observed surface polymerization of phenol on carbon surfaces. They proposed that phenol is adsorbed partly chemically and partly physically. The chemical portion of the adsorption is considered to be due to a primary reaction between carbon and oxygen, resulting in the adsorption of acid and the liberation of hydrogen peroxide. Thus, for example, if chromene groups are present on the surface, it is possible that phenol reacts with the hydrogen peroxide released to form phenoxy radicals, which subsequently initiate the surface polymerization.
Lim et al. [24] have shown that absence of polymerization in the case of benzoic acid can be explained on the basis of their results obtained. They speculated that carbon is not a strong enough catalyst to catalyze the polymerization of benzoic acid on the carbon surface.
The present investigation was devoted to: (1) the characterization of the textural properties of the non-activated coke (PC) and KOH-activated PC (APC), (ii) the determination of the chemistry of both PC and APC, (iii) the study of the effect of pH on the adsorption of phenol (P), p-nitrophenol (PNP) and benzoic acid (BA) onto APC, and (iv) the determination of the equilibrium isotherms at 303-323 K and the kinetics of adsorption of these adsorbates at different initial concentrations at 303 K.
Non-activated PC was prepared by the pyrolysis of a representative petroleum coke sample, provided by El-Nasr Company
[Table 1.] Elemental analysis of PC and APC

Elemental analysis of PC and APC
(Suez-Egypt), at 673 K, in nitrogen atmosphere for 2 h. KOH-activated sample APC was obtained by the pyrolysis of KOH-impregnated PC at 1023 K for 2 h, in nitrogen atmosphere; the KOH: PC ratio was 2:1. Details of preparation can be found elsewhere [9]. The elemental analysis of PC and APC were determined using a Varioel elemental analyzer; the elemental analysis results are listed in Table 1. The fraction of particle size >0.2 and <0.6 mm was used for the adsorption measurements.
P, PNP (Ex-pure-oxford Laboratory Reagent, India) and BA with purity greater than 99% (Fluka Chemical Corp., USA) and distilled water were used to prepare the aqueous solutions. The concentrations of these compounds in samples were measured using a Shimadzu UV-2401 PC spectrophotometer (Japan). The values of maximum wavelength for P, PNP and BA were found to be 270, 318 and 224nm, respectively, in the present study.
Nitrogen adsorption isotherms at 77 K were constructed using a conventional volumetric apparatus. The sample was degassed at 200℃ for 6 h under a reduced pressure of 10-5 torr.
The pH value at the point of zero charge, pH(PZC), of carbon was determined as suggested by Noh and Schwarz [25] by adding various amounts of solid to 10 mL of a 0.1 M NaCl solution (prepared in pre-boiled water). The sealed bottles were placed in a constant temperature shaker overnight and the equilibrium pH values of the mixtures were then measured. The limiting pH was taken as the pH(PZC), pH(PZC) = 5.0 (figure not illustrated).
Noh and Schwarz suggested that at pH = pH(PZC), the surface of the carbon is neutral; at a pH value higher than pH(PZC), the surface would be negatively charged; and at a pH value lower than pH(PZC), the carbon surface is positive. Under the last circumstance,the carbon surface would have a high affinity for anions.
The different types of functional groups were identified by Fourier transform infrared (FT-IR) spectroscopy in the range of 4000-400 cm-1 using a Perkin Elmer Paragon 1000 FT-IR spectrometer(USA), and the KBr disc technique.
The base neutralization capacities of PC and APC were determined using the Boehm titration method [26]. The total acidity and the total basicity of each sample were determined by neutralization with 0.1 N NaOH and 0.1 M HCl, respectively.
To adjust the initial pH of the adsorption solution at (2-10), a few drops of diluted NaOH or HNO3 were added. This allowed the determination of the appropriate pH, leading to maximum uptake from each adsorbate for anions.
To follow the kinetics of sorption, a sample of dry adsorbent (~0.5 g) was added to 100 mL of the aqueous adsorbate solution at initial pH of 6.0. Different initial adsorbate concentrations Co
were used for each adsorbate. The uptake of the adsorbate per unit mass of the adsorbent was followed in time by withdrawing 2 mL samples at fixed time intervals to determine the concentration at each time Ct. Co and Ct were measured with spectrophotometry.
Equilibrium adsorption measurements were carried out at 303-323 K and pH 6.0. Different initial concentrations of the adsorbate were used and these solutions were shaken in a thermostat for 24 h to ensure equilibrium conditions. Two mL samples were withdrawn from each adsorption flask to determine the equilibrium concentrations. The amount adsorbed at equilibrium qe (mmol/g) was determined from the corresponding initial concentration using Eq. (1).
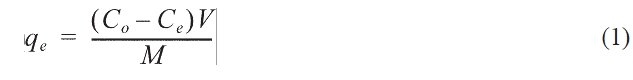
where Co and Ce are the initial and equilibrium concentration (mmol/L), respectively, V is the volume of adsorption solution (l), and m is the mass of the adsorbent (g).
3.1 Characterization of PC and APC
3.1.1 Textural properties
The textural properties (surface area and porosity) of an adsorbent are important factors in determining its capacity for adsorption from solution and from a gaseous phase. For activated carbon, the amount of the activating agent used and the activation temperature are important parameters [9]. Our previous work [9] indicated that activation of PC with KOH at 1023 K led to APC with the highest surface area and total pore volume compared to those values for samples subjected to activation at lower or higher temperatures. In the present investigation, the ratio KOH: PC was 2:1 and the activation temperature was 1023 K.
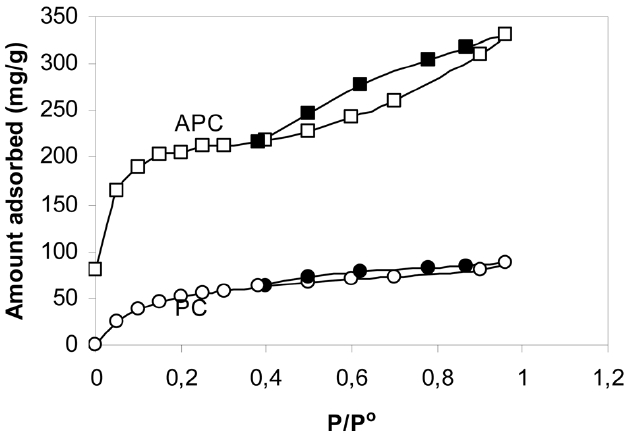
Fig. 1 shows the nitrogen adsorption-desorption isotherms onto PC and APC measured at 77 K. The adsorption was found to be rapid, with the equilibrium attained within 30 min, indicating the absence of ultrafine pores in which adsorption may be a diffusion controlled process. The isotherm of PC is type I with no hysteresis, indicating a micropore structure. On the

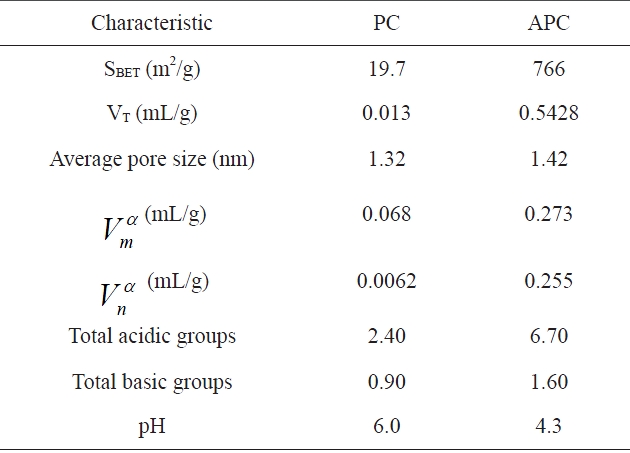
Textural and chemical characteristics of adsorbents is evaluated from nitrogen adsorption and Boehn titrations
other hand, the nitrogen adsorption isotherm of the APC exhibit type II isotherm has an initial steep portion, a plateau up to the relative pressure P/Po = 0.5, an upward deviation beyond P/Po= 0.5 and a closed hysteresis loop. Table 2 lists the surface area as determined by the Brunauer-Emmett-Teller (BET) equation, SBET (m2/g), the total pore volume VT (mL/g), and the mean pore radius (nm). The α-method of Sing [27] was also applied to determine the micropore volume and the non-micropore volume, both expressed in (mL/g).
Inspection of Table 2 reveals that: (i) the SBET of APC is about 39 times higher than that of PC; also, the VT of APC is ~41.8 times higher than that of PC; (ii) for both sorbents investigated, the micropore volume is about 8 to 9% higher than the nonmicropore volume; (iii) activation with KOH at 1023 K of PC to give APC is associated with a tremendous increase in the porosity of average radius (1.42 nm), i.e., this radius becomes more or less equal to the average pore radius of the non-activated petroleum coke PC (1.32 nm), indicating that the activation with KOH proceeds via the destruction of low molecular weight hydrocarbons and tarry materials blocking most of the pores.
3.1.2 The chemistry of the surface of PC and APC
The chemistry of the surface of the adsorbent is equally important to its textural properties in determining the adsorption capacity of this adsorbent, particularly in case of adsorption from solution.
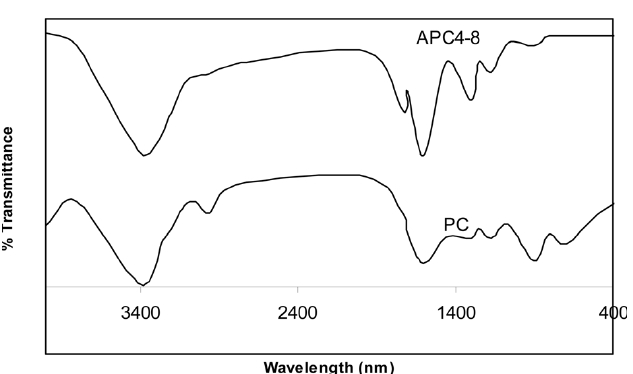
The FT-IR spectra shown in Fig. 2 show that activation with KOH of PC at 1023 K is associated with a noticeable change both in the strength and the broadness of some of the absorption band. Moreover, activation with KOH led to the appearance of new bands and to the disappearance of others. Thus, the spectra of PC include bands at 700-900 cm-1and also a band centered at 2925 cm-1. All these bands are ascribed to the C-H of the methyl and methylene groups. These bands disappear [28] upon activation with KOH at 1023 K. The FT-IR spectra of PC shows poorly developed bands at 1200-1300 cm-1; these bands are well developed in the FT-IR pattern of APC. The 1200-1300 cm-1 bands are ascribed to the C-O and C-O-C groups [29].
The band located at 1717 cm-1 is assigned to stretching C = O
vibration, indicating that the formation of acid groups, such as quinone, and of carboxylic groups [30], which is clearly shown in the spectra of APC and is absent from the spectra of PC. The band located at 3400 cm-1, characteristic of O-H stretching vibration [31], is shown in the spectra of PC and APC, but is more developed in the spectra of the latter.
The total acidity and the total basicity of PC and APC are listed in Table 2. It is quite clear that both the acidic and basic groups are by far more abundant on the APC surface. During the activation with KOH at a temperature as high as 1023 K, the deposited tarry materials and hydrocarbons are removed, thus leaving a less contaminated surface ready to interact with the residual and combined oxygen, and thus creating surface C-O groups with their type depending on the mode of carbon-oxygen interaction. On the other hand, the non activated PC, which was thermally treated only for 2 h at 673 K in absence of any activating agent, may have a surface contaminated with deposited hydrocarbons and tarry materials. These contaminants mask, the surface C-O groups, thus inhibiting their function and preventing the contaminated surface from interaction with residual oxygen to create surface C-O groups either of acidic or basic type.
The surface acidity of APC is large, resulting in a lowering of the pH value (Table 2). This is attributed to the development of acidic functional groups, and is in agreement with the FTIR results. Thus, the resulting activated carbon APC contains, to a certain extent, oxygen-containing groups with basic character, but is still acidic in character.
The controlling mechanism in the adsorption of P, PNP and BA with three different initial concentrations at 303 K were examined using various kinetic models such as the pseudo-firstorder Eq. (2), pseudo-second-order Eq. (3) and intrapartical diffusion model Eq. (4) to determine whether processes such as mass transfer and/or chemical reactions were involved.
where qe and qtare the amounts of solutes adsorbed at equilib-
rium and at a time t (mmol/g), respectively; K1 is the pseudofirst-order adsorption rate constant (min-1); and K2 is the pseudosecond-order adsorption rate constant mmol/(gmin).
If intraparticle diffusion is assumed to be the rate-limiting step in the adsorption process, the corresponding equation may be written as the equation of Weber and Morris, viz.

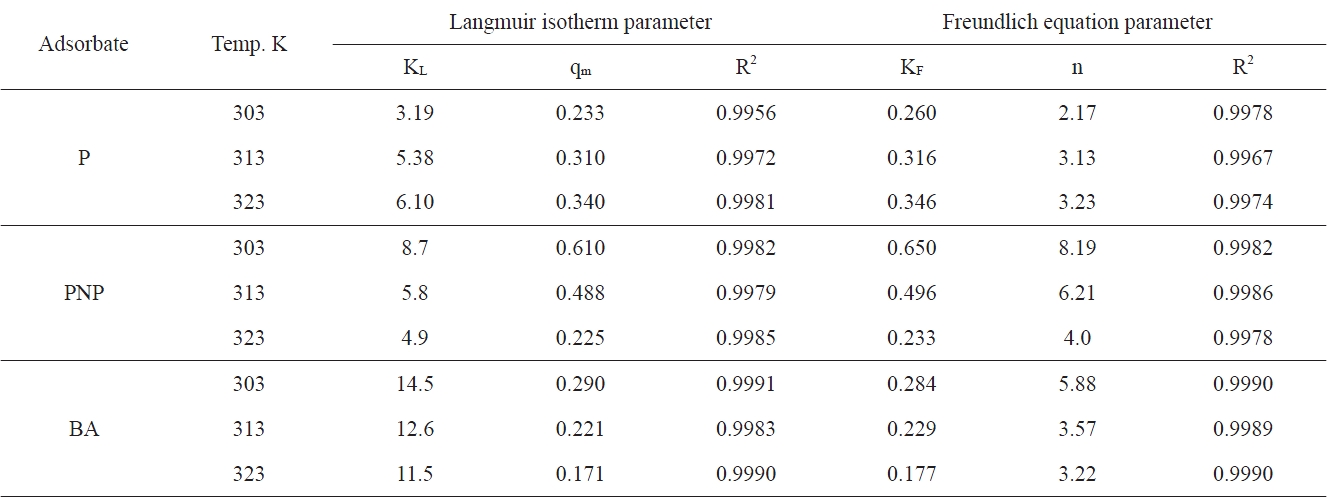
Langmuir and Freundlich equation coefficients for P PNP and BA adsorption onto APC at different temperatures
where Kid is the intraparticle diffusion constant (g/Kg min0.5) and qt and t have the same meanings as given above.
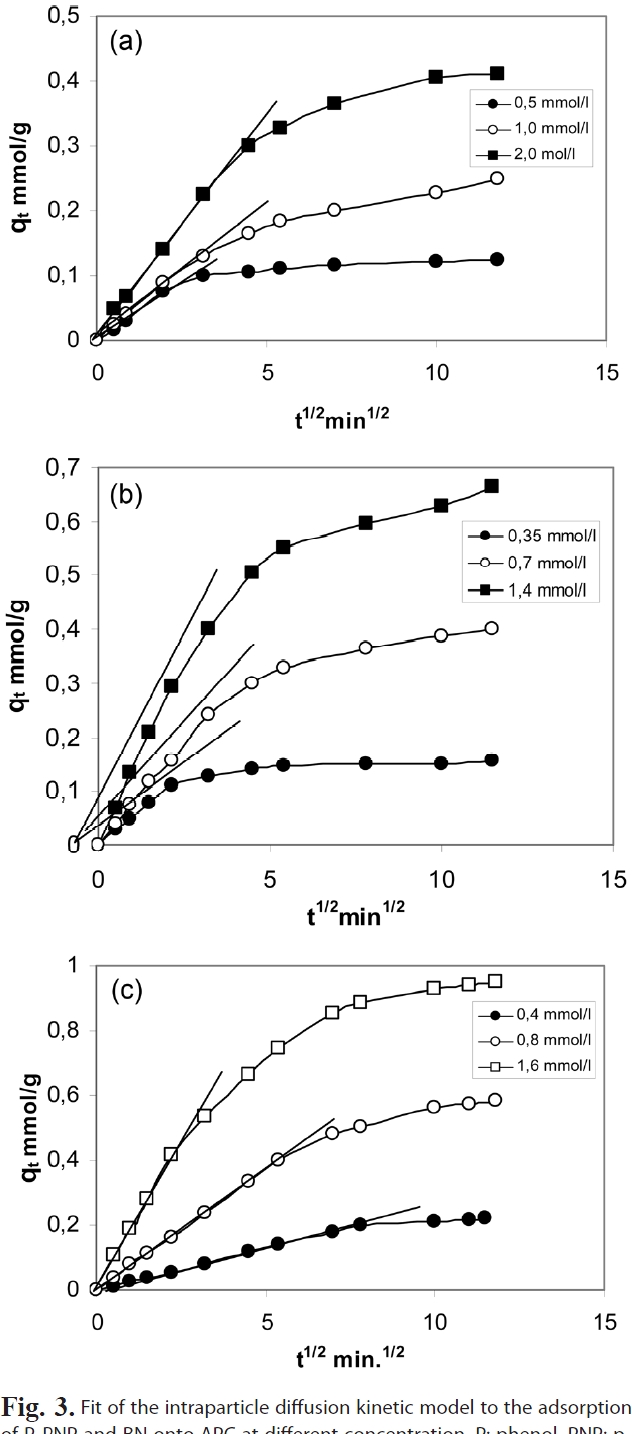
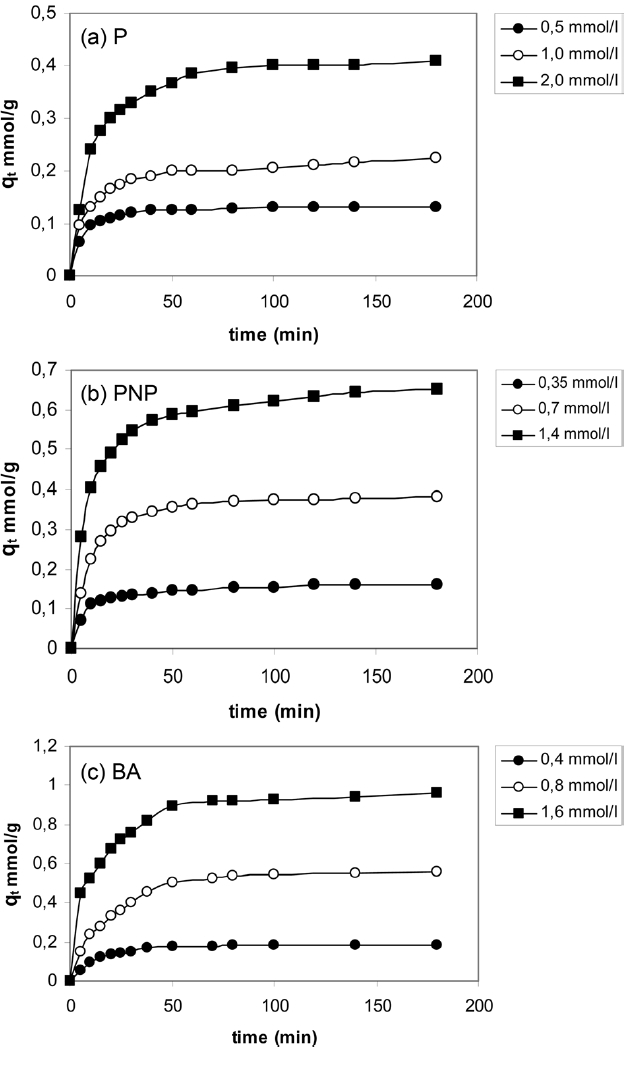
The kinetic adsorption curves at 303K for P, PNP and BA were obtained with three different initial concentrations (i.e. 0.5,1.0 and 2 mmol/L P; 0.35, 0.70 and 1.4 mmol/g PNP and 0.4, 0.8 and 1.6 mmol/L BA. Fig. 3 shows the influence of time on the adsorption of P, PNP and BA onto APC.
As can be seen in Fig. 3, the adsorption processes of P, PNP and BA onto APC involved two distinct steps. For lower solute concentrations, the first step was the rapid adsorption of solutes within 10 and 20 min for the three solutes, followed by a slower second step that led to the attainment of equilibrium within 40 and 80 min for P, PNP and BA. For higher solutes concentrations, the first step corresponded to the rapid adsorption of aromatic compounds within 40 min, with a slower second step to attain equilibrium within 100 min. The rapid step is thought to be due to the abundant availability of active sites on the surface of APC, with the adsorption becoming less efficient and slower as these sites become increasingly occupied.
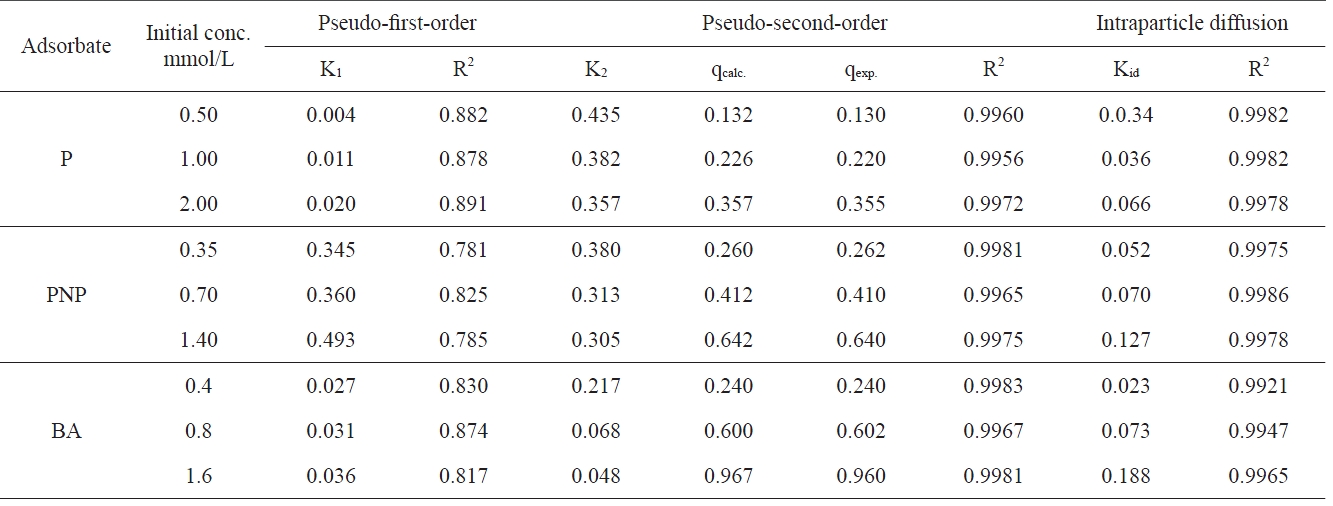
All the kinetic parameters arising from the application of the three models to the data for the adsorption of the three pollutants onto APC are listed in Table 3. The correlation coefficient, R2, is also listed in Table 3.
The first-order kinetic equation was applied to the data obtained. No satisfactory straight lines were obtained, indicating that the sorption of the investigated pollutants onto APC does not follow the first order kinetics. On the other hand, the pseudosecond-order rate equation was found to be satisfactorily applicable to the adsorption data obtained, giving straight lines with high values of correlation coefficient R2 (Table 3).
All the values of q2 thereby obtained were virtually equal to qexp with the corresponding values of R2 being equal to more than 0.995, thereby confirming the applicability of the pseudosecond-order kinetic model of these adsorption processes. These results reveal that adsorption of P, PNP and BA onto chemically activated carbon complies very well with the pseudo-secondorder-reaction. This may be taken as evidence that the rate of reaction depends on both the sorbent and adsorbate concentration.
The second-order rate constant K2 decreases with the increase of the initial concentration of the adsorbate. This may be ascribed to the enhancement of the diffusion of the pollutant molecules from the bulk of the solution to the sorbent surface as a result of the decrease of the number of water molecules holding each pollutant molecule compared to the number of water molecules in less concentrated solution. This was found to be true for all the pollutant molecules investigated.
The status of the intra-particle diffusion as the single ratecontrolling step in the present work was tested through the use of Eq. (4). Fig. 4 shows that for different initial concentrations of different adsorbates P, PNP and BA have a constant adsorbent mass of 0.5 g. It can be seen in Fig. 5 that all the plots exhibit some general features, i.e., a linear portion extending upwards to a curved plateau. These features may be interpreted by assuming that the linear portion arises from intra-particle diffusion. The values of Kid were calculated and are listed in Table 4.
The intraparticle diffusion constant Kid also shows a significant increase with the increase of the initial concentration, supporting thus the enhancement of the pollutant molecules on the surface located between adsorbent particles.
Moreover, it seems that the intraparticle diffusion is the only controlling process that determines the adsorption of the pollutants investigated in the present work. The back extrapolation of the straight line representing the initial part of qt vs t0.5 passes through the origin. Fig. 4 provides additional evidence for this explanation.
The plots of log Kid versus logCo (figure not shown) were linear,thus indicating a gradual increase in Kid with increasing Co and supporting the view of an increase in the driving adsorbate from the bulk solution onto the solid surface [32].
[Table 4.] Kinetic parameters for the adsorption of P PNP and BA onto APC at 303 K

Kinetic parameters for the adsorption of P PNP and BA onto APC at 303 K
3.3.1 Effect of pH
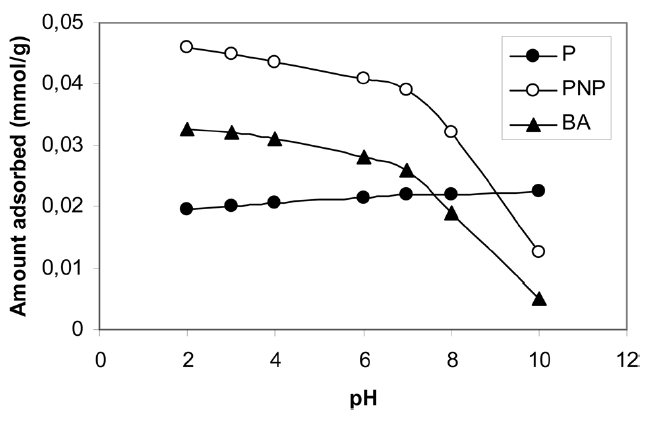
It is well established that the adsorption of pollutants from their aqueous solution is significant. The adsorption of P, PNP and BA at 303 K on ABC was studied at pH 3-10. The initial concentration of the pollutant was 0.4 mol/L and the adsorbent dosage was 100 mg. The initial pH of the solution was adjusted to the required value using 0.1 M of NaOH or 0.1 M HNO3. The adsorption flasks were shaken in a thermostat for 24 h to ensure the attainment of equilibrium; the equilibrium concentrations were also determined.
Fig. 6 shows the variation of the maximum adsorbed from each pollutant qmax (mmol/g) versus the initial pH of the adsorption solution. Fig. 6 shows a very slight increase in the value of qmax with the increase of pH, indicating that the high concentration of hydrogen ions inhibits phenol adsorption, which may be ascribed to a competition between hydrogen ions and phenol molecules for the surface of the adsorbent. On the other hand, the maximum uptake of PNP or BA decreased with the increase of pH from 3 to 10, with the decrease being more pronounced between pH 8 and pH 10, although the pKa of the two adsorbates were different, i.e. 7.2 for PNP and 4.2 BA. However, the decrease of the qmax of BA with the increase of pH of the solution from 8 to 10 is a more drastic result compared with the corresponding decrease of PNP. Similar behavior has been reported [33] and was ascribed to the low pKa value of BA; low pKa value means high dissociation of the solute and, consequently, that a high repulsive force would be expected. It remains now to explain the low adsorption capacity of APC for BA over the pH range of 3-10.
However, for PNP and BA, adsorption is preferred to come from acidic aqueous solutions.
The carbon surface is generally electronegative over a wide range of pH, i.e. electro-donating at pH approaching the pH of point zero change pHPZC. Based on this, the adsorption of PNP and BA at pH = 2-5 is expected to be higher than the adsorption at pH 7, where π-π electrostatic attraction is the only mode of
sorbent-sorbate interaction. Now in considering the high adsorption of PNP compared to BA, one can ascribe this to the interaction of the electron-donating sites on the surface of the carbon with the electron-withdrawing NO2 group of PNP.
Evidently, the adsorption of PNP and BA at solution pH 7 was lower compared to their adsorption at pH 2. However, most of the experiments were conducted at pH 7 in order to realize field conditions that are possible in the field for treating drinking water and/or waste water. Since the pH(PZC) of the investigated carbon is 5.0, it follows that at a solution pH value of 7.0 the surface of the carbon is negatively charged.
3.3.2 Effect of temperature
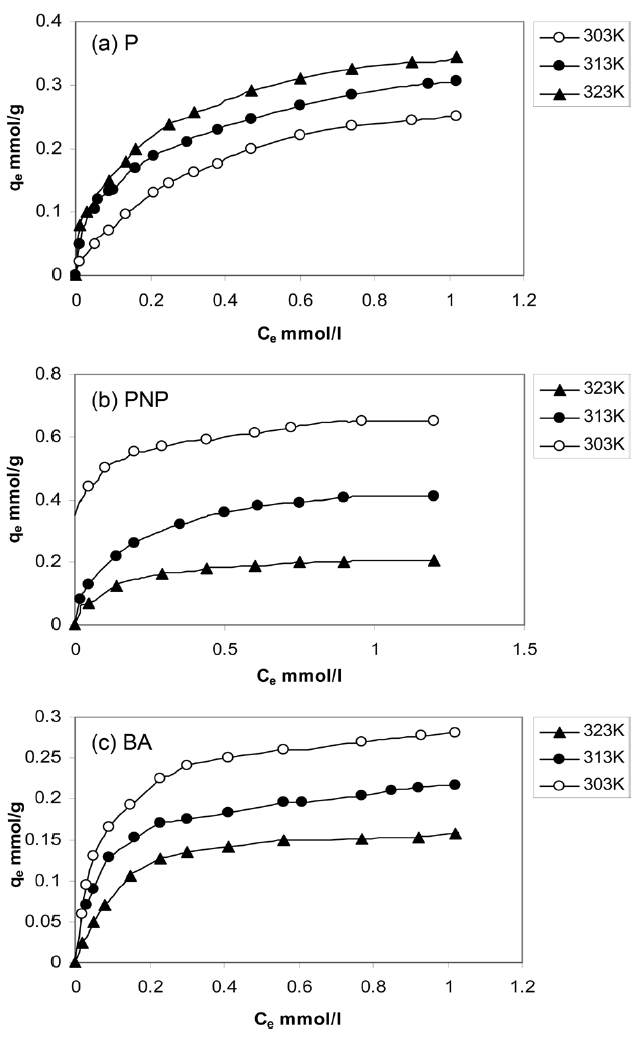
The equilibrium adsorption of P, PNP and BA from their aqueous solutions of pH 7 at 303-323 K was carried out. The solution was shaken in a thermostat for 24 h to ensure the attainment of equilibrium conditions. Fig. 7 shows the equilibrium adsorption isotherms of P, PNP and BA, respectively.
The essential characteristics of the Langmuir isotherm can be expressed in terms of a dimensionless constant separation factor or equilibrium parameter RL, which describes the type of isotherm [34] and is defined by the following relationship:
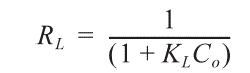
where KL (L/mmol) is the Langmuir constant and Co (mmol/L) is the initial concentration of the adsorbate. The parameter RL gives an indication of the isotherm type.
Here, the magnitude of RL is a reflection of the isotherm shape, according to the following.
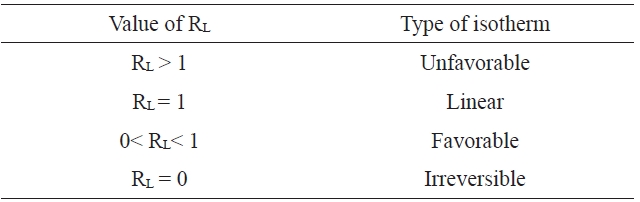
The values of RL for the adsorption isotherms of P, PNP and BA at 303 K at different initial concentrations were calculated. The RL values were found to decrease from 0.03 to 0.003 for P; for PNP adsorption, RL decreased from 0.011 to 0.001 and for BA from 0.0068 to 0.0008, i.e., all the RL values are greater than 0 and less than 1, indicating the favorability of the adsorption of the investigated pollutants by the APC sorbent.
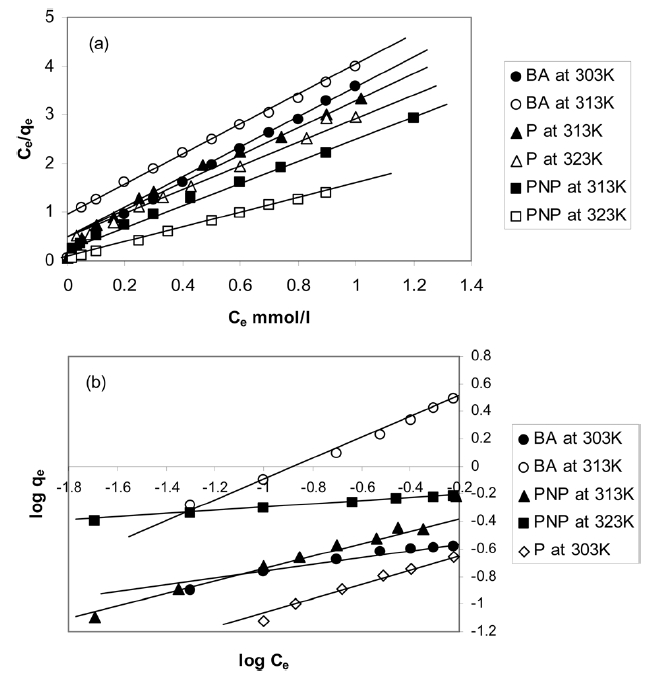
The isotherms in Fig. 7 were analyzed using the Langmuir and Freundlich adsorption models. Eq. (5) is the linear form of the Langmuir isotherm.
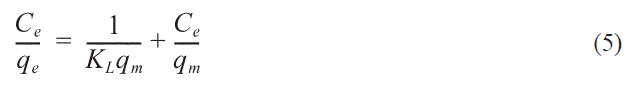
where qe is the equilibrium amount adsorbed at the equilibrium concentration Ce and qm is the maximum amount adsorbed, and which is assumed to be the monolayer adsorption capacity, both expressed in (mmol/g), and KL is the Langmuir constant (L/mmol).
The linear form of the Freundlich equation is given as
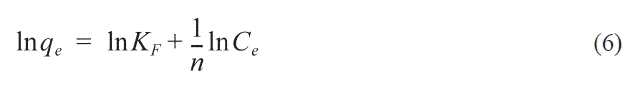
where KF is the Freundlich constant related to the adsorption capacity, in which n/1 is a constant related to the adsorption strength, i.e. the adsorbent-adsorbate interaction. Table 4 lists the different adsorption parameters. Included also in Table 4 are the corresponding values of the correlation coefficients R2; it is indicated that the adsorption data fit well with the Langmuir and Freundlich models. Representative linear plots of Langmuir and Freundlich are shown in Fig. 5, respectively.
Inspection of Table 4 indicates that (i) the values of KL and KF, although different, follow the same two trends because both of them are functions of the adsorption capacity; (ii) for phenol adsorption, both qm and KF increased with the increase of the adsorption temperature from 303 to 323 K; this indicates that the adsorption of P by APC is an endothermic process; (iii) the adsorption of both PNP and BA decreased with the increase of the adsorption temperature from 303 to 323 K, which means that the adsorption of these two pollutants onto APC is an exothermic type reaction; evidently, qm and KF, decreased with the increase of adsorption temperature, although this decrease is not the same; (iv) KL values for P adsorption increased with the increase of the adsorption temperature; for PNP and BA, the opposite trend was exhibited, which may be taken as showing that the uptake of these two pollutants by APC proceeded via an exothermic process; (v) the values of n, the constant of the Freundlich equation, follow the same trend of KL with respect to the effect of adsorption temperature.
It is obvious from the experimental data that the values of qm of APC toward P increase with increasing temperature, which indicates a chemical process; such chemical adsorption involves π-π interaction, donor-acceptor complex formation, and solvent effect [35,36]. The active carbon investigated in the present study, APC, contains a large fraction of microporosity. This type of porosity necessitates diffusion energy in order for phenol molecules to reach the surface located in the microspores. Also, the increase of temperature may be decreasing the number of water molecules surrounding each phenol molecule; this is expected to enhance the phenol adsorption. Moreover, with the rise of temperature, water sorption decreases, thus allowing phenol adsorption to dominate. It has also been reported that the increase of temperature led to an increase in the rate of adsorption as well as to the phenol polymerization via hydrogen bonding [37]. As for the ratio of the acidic/basic group concentration, see Table 2; the ratio is 4.211. Koganovski et al. [38] have reported that the adsorption of phenol was lower with the increase of the acidic/basic ratio.
The adsorption of PNP onto APC was found to be considerably higher than that of BA onto the same sorbent. Thus, PNP adsorption exhibited a qm value of 0.610 mmol/g, whereas the BA adsorption gave a qm value of 0.290 mmol/g. These results contradict the principle indicating that the extent of adsorption is generally inversely proportional to the solubility in water [39,40]; the solubility of PNP = 0.32 g/100 mL and that of BA is 0.34 g/100 mL. However, the present results agree well with those previously reported [39,40], and this may be indicate that the role of the solubility of a solute in water in determining its adsorption on a solid sorbent is not a dominating role. Also, because the adsorption from solution is controlled by many factors, the overlap of the contributions of these factors may lead to the minimization or even to the inversion of the effect of some factors.
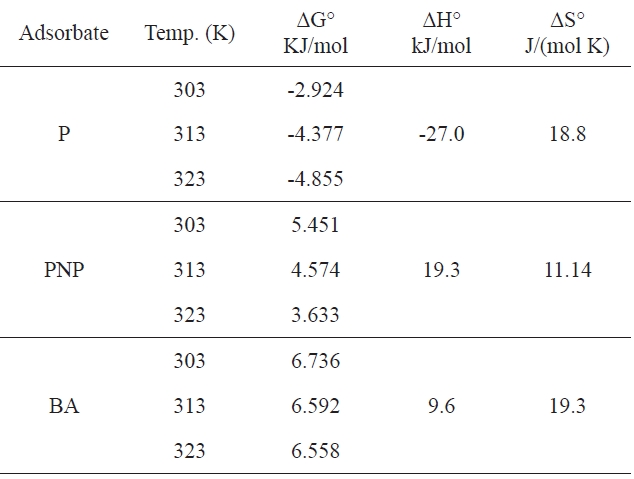
The better fitting Langmuir plots were used to make estimations of the changes in free energy (ΔG), enthalpy (ΔH) and entropy during the adsorption of P, PNP and BA onto activated carbon APC. For such calculations, the following relationships were employed.


Eqs. (7) and (8) allow the relation between the Langmuir constant, KL, and the thermodynamic parameter ΔH and ΔS to be described by Van’t Hoff’’s equation.
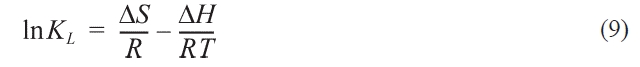
This allowed ΔH and ΔS to be calculated from the slope and intercept of the plot of ln KL versus 1/T. Table 5 summarizes the values of ΔG, ΔH and ΔG for every sorbent-adsorbate-system.
It can be predicted from Table 5 that (i) for P, the negative values of ΔG indicate that the adsorption process was spontaneous at all temperatures studied; the fact that this spontaneous tendency increase on APC with increasing temperature is reflected in the increasing ΔG° values; the negative values of (ΔH°) indicate that the interaction of P with the investigated adsorbent APC is exothermic in nature, thereby demonstrating that the process is stable energetically; the value of ΔH° is negatively low compared with the heats evolved in the chemisorption process; the value of ΔH° may be ascribed to a specific interaction between P and adsorbent surface; (ii) in contrast, for PNP and BA, the values of ΔG are positive at all temperatures, indicating the nonspontaneity of the adsorption process; furthermore, these values decrease with increasing temperature, indicating that the sorption process is favored under such conditions. The positive value of ΔH shows that endothermic nature of the adsorption process, indicating the presence of an energy barrier in the adsorption
[Table 5 .] Thermodynamic parameters

Thermodynamic parameters
processes; (iii) the positive ΔS value for all three pollutants indicates that the pollutant molecules in water are caged by solvation molecules (water molecules) and also gives evidence of the weak adsorption forces between the carbon surface and the pollutant molecules.
The preparation of chemical KOH, activated petroleum coke, is described. The surface acidity of the resulting carbon is large, and is attributed to the development of acidic functional groups.
Three sorption kinetic models were used to explain the probable mechanism of aromatic compound uptake. The kinetic data for the adsorption process for all adsorbates obeyed a secondorder rate equation. The intraparticle diffusion Kid is the rate determining step of the P, PNP and BA.
The uptake of the three adsorbents was found to be strongly dependent on the pH and the temperature of the solution. The thermodynamic parameters revealed that the adsorption of P was spontaneous and exothermic in nature, while PNP and BA showed no-spontaneity of the adsorption process and that process was endothermic in nature.
Activated carbon prepared from petroleum coke (an industrial waste) could be used as a potential adsorbent for the removal of sample aromatic compounds from aqueous solutions and is an inexpensive material for treating industrial waste water.