Activated carbon fiber (ACF), is known as one of excellent carbon adsorbents, has been obtained from various precursors by an adequate stabilization, carbonization, and activation process. ACFs are now manufactured from regenerated cellulose (viscose rayon), phenolic resin (Kynol), polyacrylonitrile (PAN), and coal tar pitch-based fibers. Recently, new materials are sought for the production of highly effective and cheap fibrous carbon adsorbents.
Natural cellulosic fibers, such as henequen (
Therefore, the purpose of this study is preparation and characterization of AHF from natural henequen fiber to investigate the production of new carbon adsorbent. To obtain the purpose: i) natural henequen fiber was stabilized, carbonized, and activated at various conditions, ii) surface morphology and properties of AHFs were investigated by EA, TGA, BET, SEM, and iii) adsorption capacity of AHFs was evaluated by removal of contaminants from aqueous water.
Refined henequen fibers (
2.2. Preparation of activated henequen fiber
Henequen fibers were cut into small pieces (5 cm length), stabilized, carbonized, and activated. Stabilization was carried out in a box furnace at 200, 250, 270, 300, and 400℃ in air. The heating rate from room temperature was 2℃/min and the temperature was held at the target temperature for required minutes. The stabilized henequen fibers (270℃, 2 hr) were subsequently carbonized at 500, 600, 700, 800, 900, and 1000℃ in nitrogen condition. The heating rate from room temperature was 10℃/min. The carbonized henequen fibers (800℃, 1 hr) were activated under continuous 0.45 H2O / N2 (v/v) flow, in a conventional tubular furnace at 600, 700, 800, and 900℃.
Weight loss was measured by using TGA (TGA 2050, TA Instruments, USA) to investigate the degradation of henequen and select the stabilization conditions as increasing the
temperature in nitrogen surrounding. Element analysis was carried out during the stabilization and carbonization by using an elemental analyzer (Flash EA 1112, Thermo Fisher Scientific, USA). The surface morphology was observed by scanning electron microscope (SEM, JSM 5400, Japan). The adsorption characteristics of the AHFs were determined by N2 adsorption isotherms at 77 K (Micromeritics, ASAP-2010). The surface area was calculated by the BET method. The pore volume, pore size distribution, and the average pore diameter were obtained by density function theory [3]. Methylene blue decolorization capacity was investigated by immersing 0.1 g of AHF in 100 ml aqueous solution containing 600 ppm methylene blue.
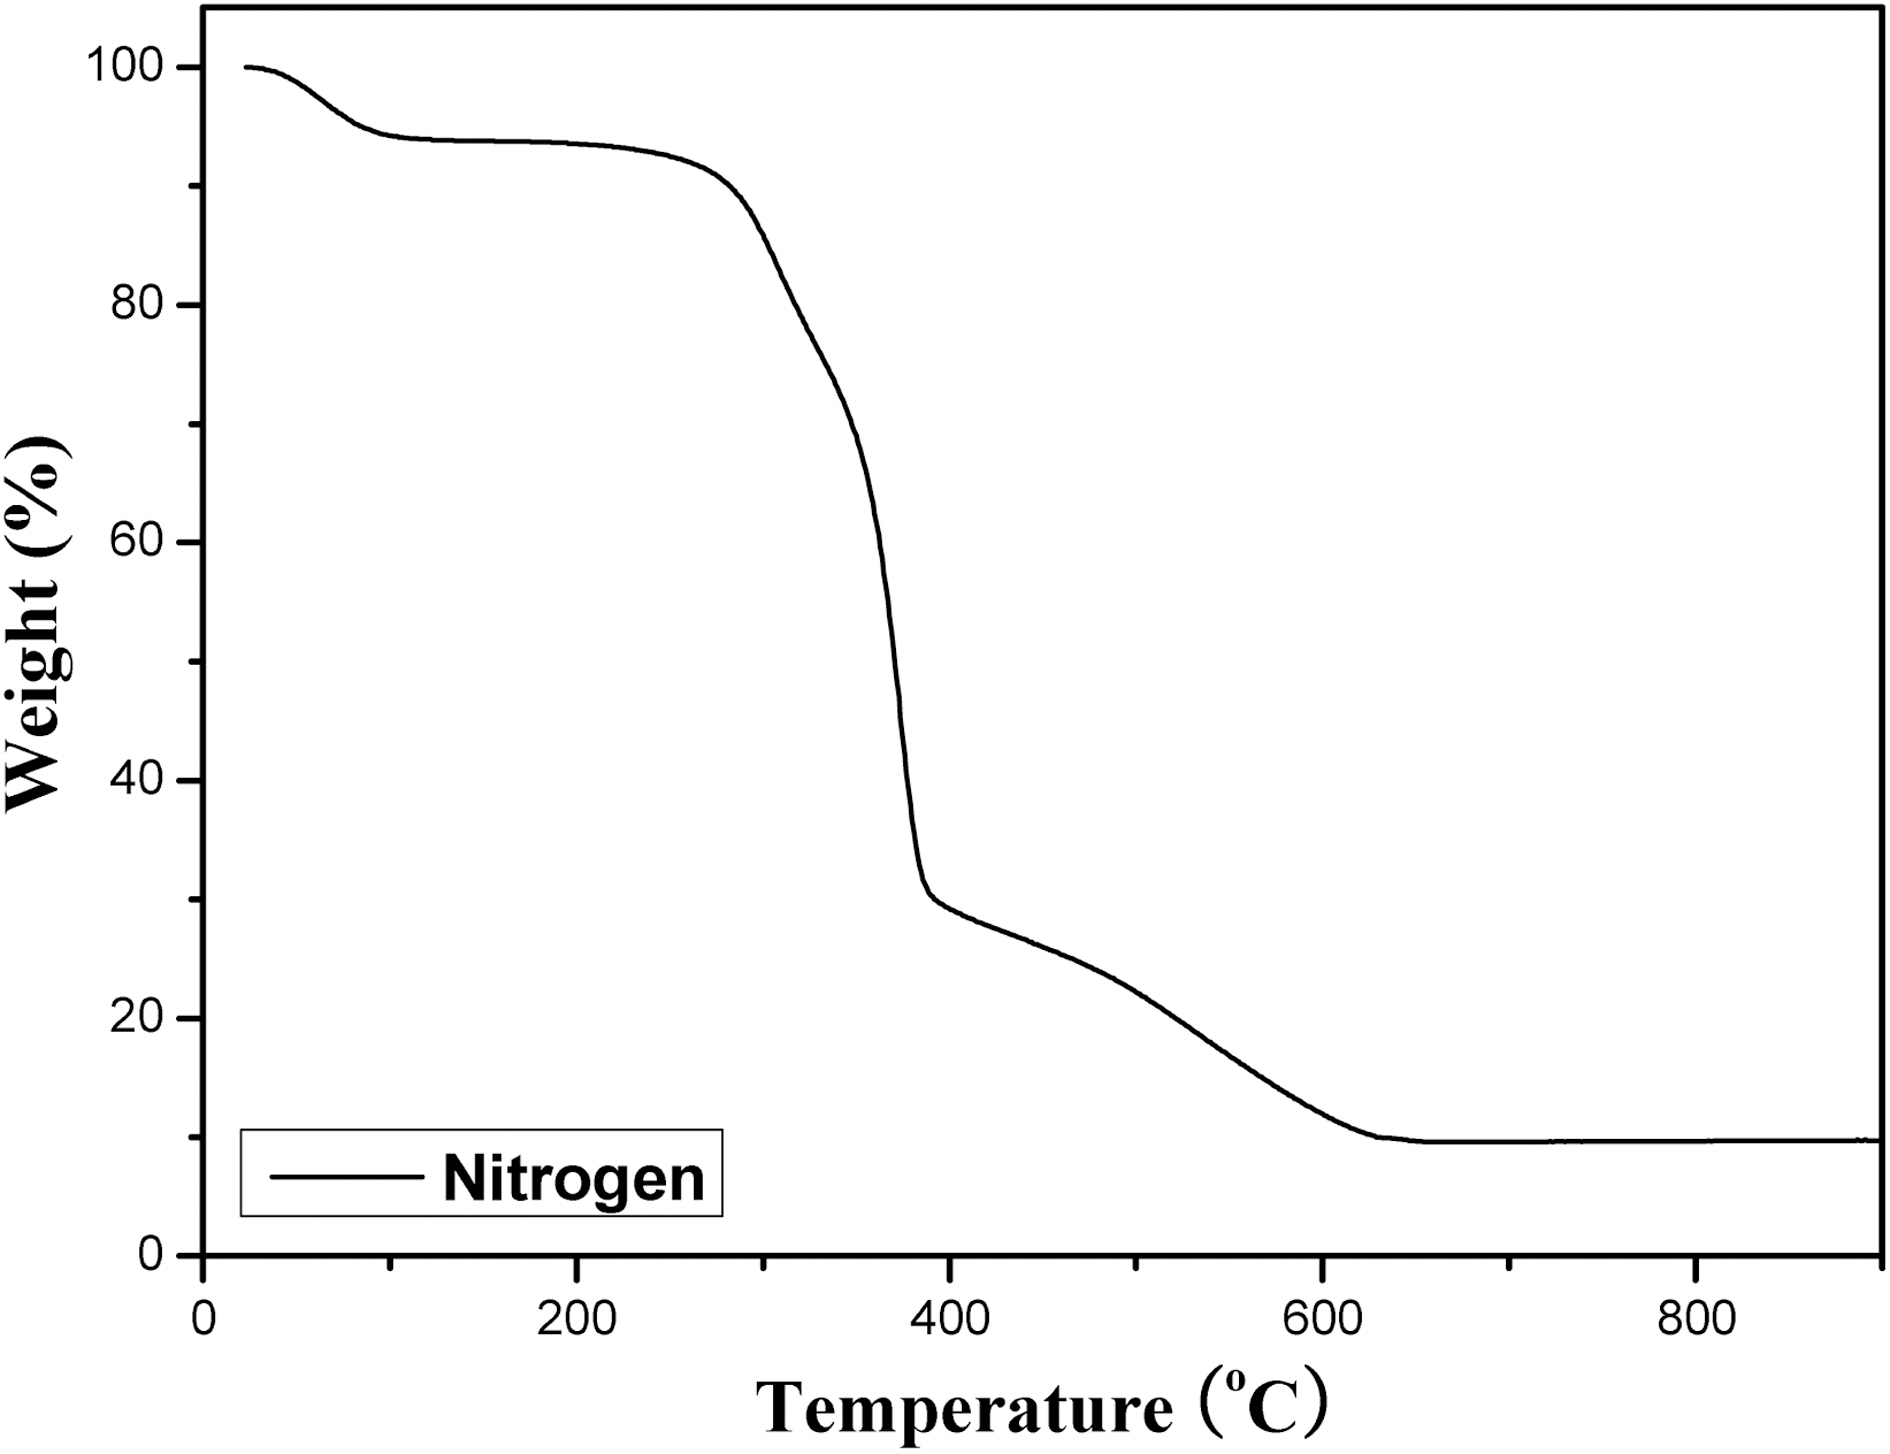
Fig. 1 shows the TGA curve of the as-received henequen fiber in nitrogen conditon. About 5% weight loss under 100℃ was due to the evaporation of water, and thermal degradation was rapidly progressed above 300℃. Detailed mechanism for the complete conversion of as-received henequen fiber was first presented by Bacon and Tang [4]. They reported the major thermal decomposition took place between 210 and 320℃ with an ultimate weight loss of about 90%. However, the weight loss varied with 70~90%, depending on the raw materials and the rate of heating. The major part of the thermal degradation resulted from thermal cleavages of C-O and C-C linkages above 240℃ and those cleavages leads to formation of large amounts of tar, H2O, CO, and CO2 until the temperature reached to 400℃. Nam and Netravali reported that the degradation of hemicellulose occurred between 220 and 280℃, and lignin degrades between 280 and 300℃ [5]. For henequen,the major weight loss was about 70% at 400℃ and more loss
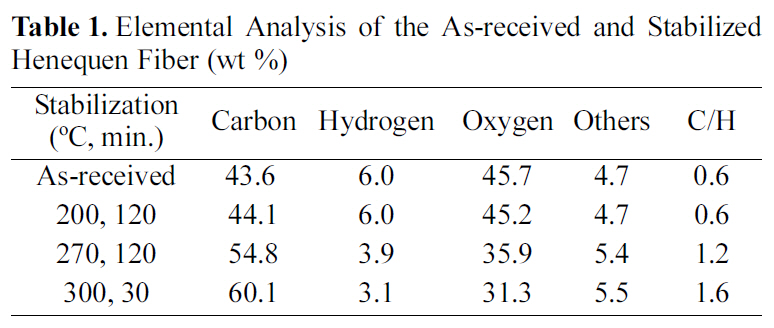
[Table 1.] Elemental Analysis of the As-received and Stabilized Henequen Fiber (wt %)

Elemental Analysis of the As-received and Stabilized Henequen Fiber (wt %)
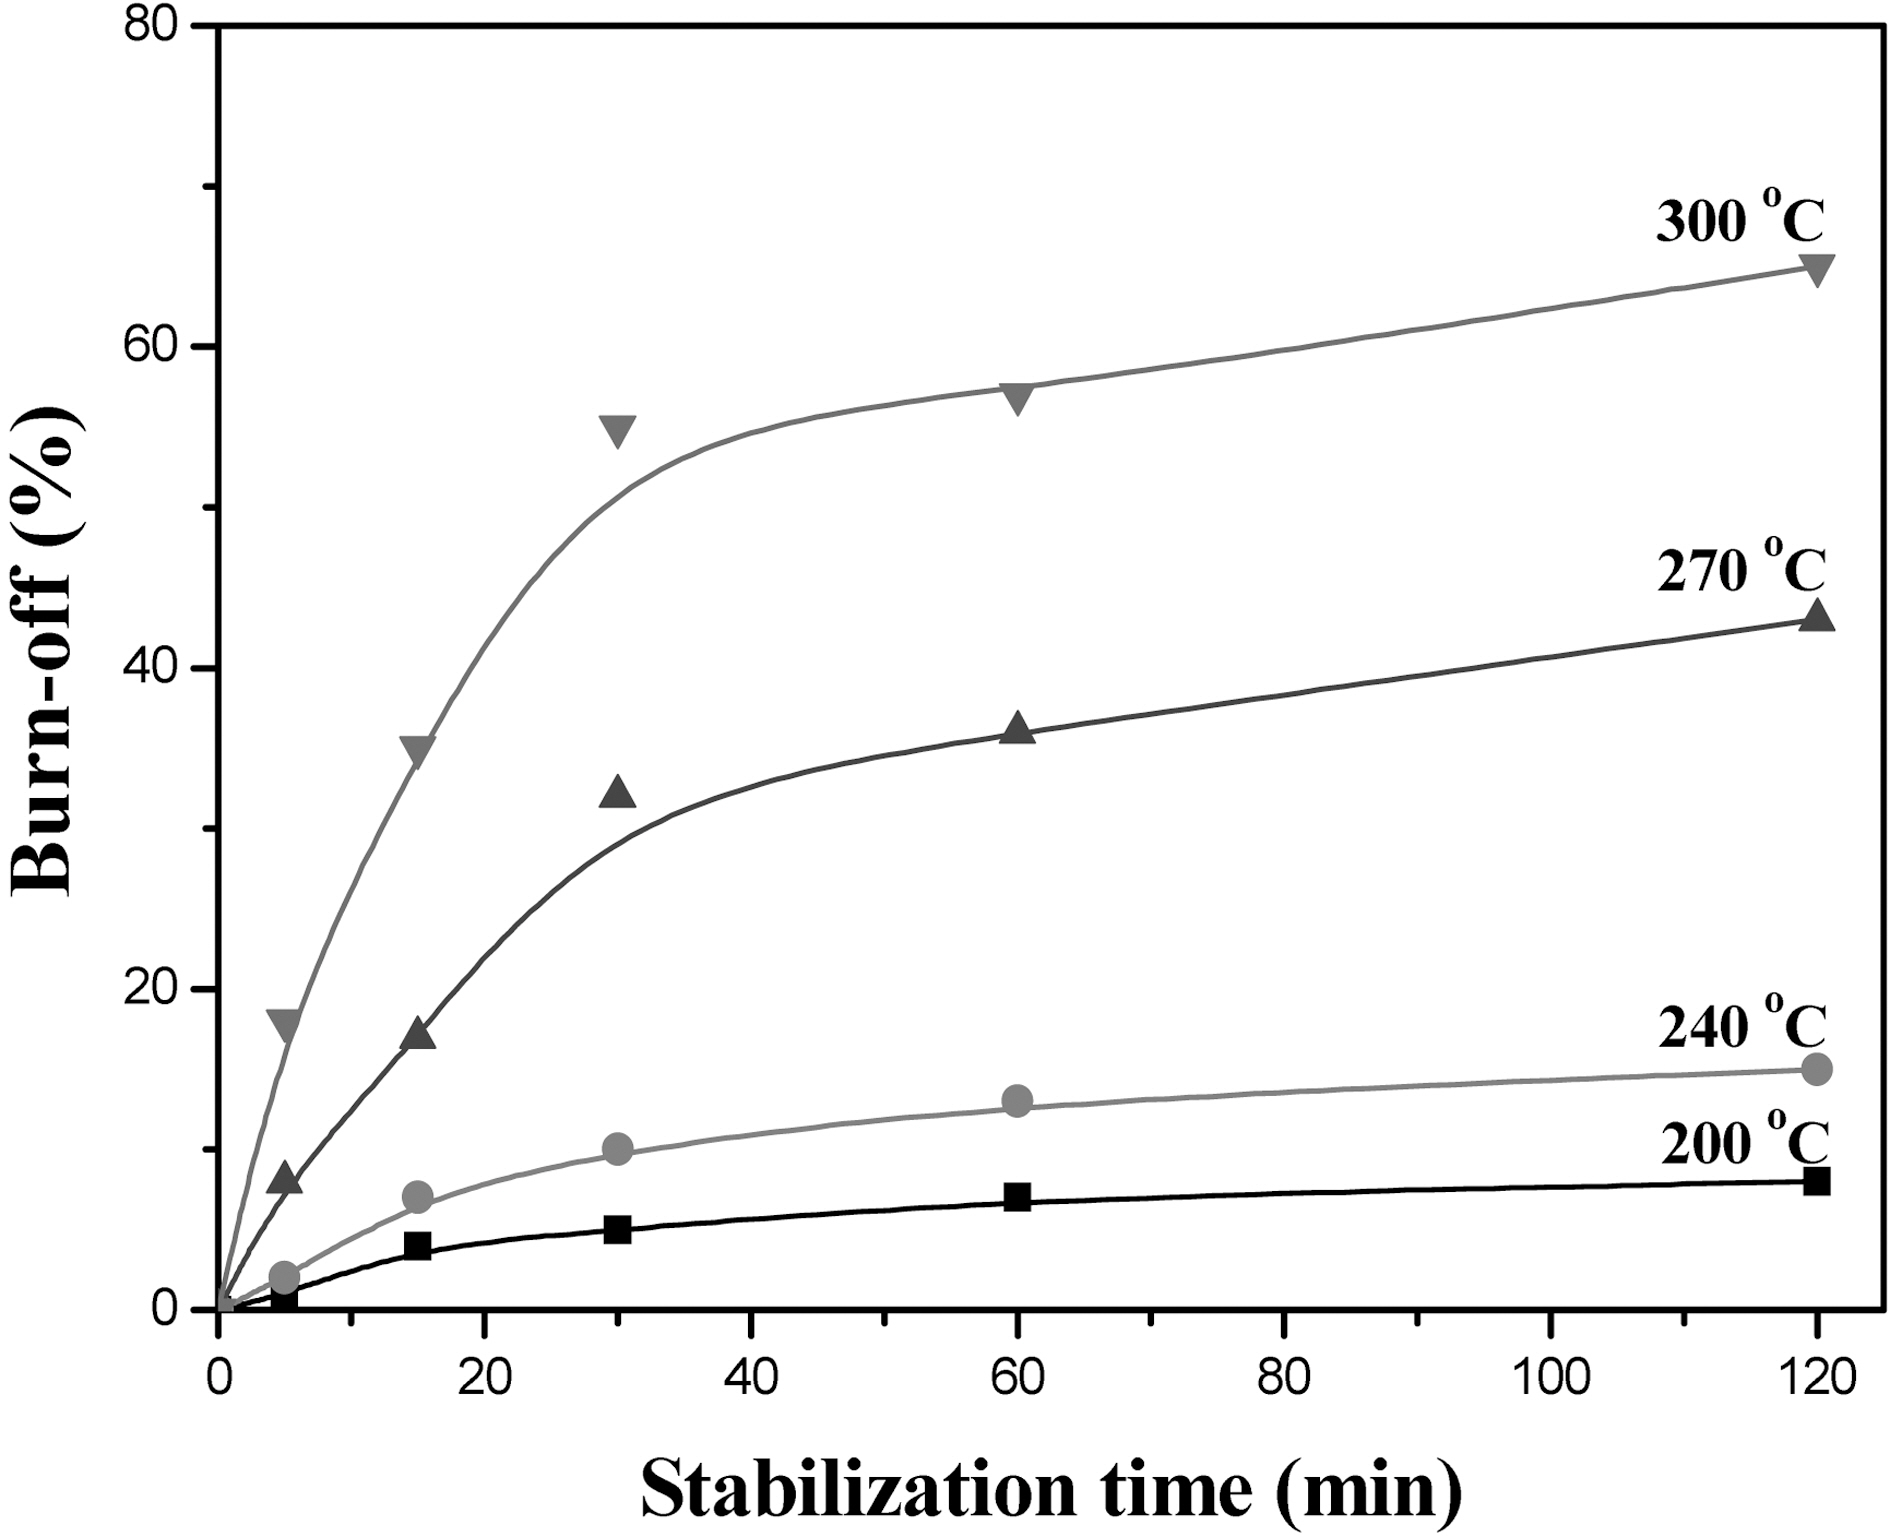
was carried out until 600℃, due to the evacuation of tar and gases. To obtain a C-C linked fiber, henequen fiber was airstabilized at various stabilization temperatures and time. Fig. 2 shows the weight loss of henequen fiber as a function of stabilization temperature and time.
The weight loss was under 15% at 240℃ for 2 hr. On the other hand, the weight loss was very fast in the beginning of 270℃ stabilization and became slow afterward. The weight loss became faster as increasing the stabilization temperature. With these results, the optimum stabilization condition can be selected depending on weight loss. In this study, 270℃ for 2 hr and 300℃ for 20 min. were selected (40% weight loss) as a stabilization condition and elemental analysis, and SEM observation were carried out to investigate surface chemical constitution and morphology of the air-stabilized fiber.
Table 1 shows the elemental analysis of the as-received and stabilized henequen fibers. Carbon content gradually increased as increasing the stabilization temperature from 43.6% of the as received fiber to 60.1% of stabilized fiber at 300℃, resulting in the increase of C/H from 0.6 to 1.6, while hydrogen and oxygen content distinctly decreased due to the thermal cleavage of C-O to C-C linkage. Yue et al. [6]reported that the C/H molar ratio was 0.14 when they
stabilized henequen fiber at 270℃ for 2 hr, which was far less than that of the results reported in this study. The difference might be come from different treatment of raw material and heating rate. In general, the weight of synthetic fibers such as polyacrylonitrile (PAN) increased due to the development of oxygen functional groups during the air stabilization [7].
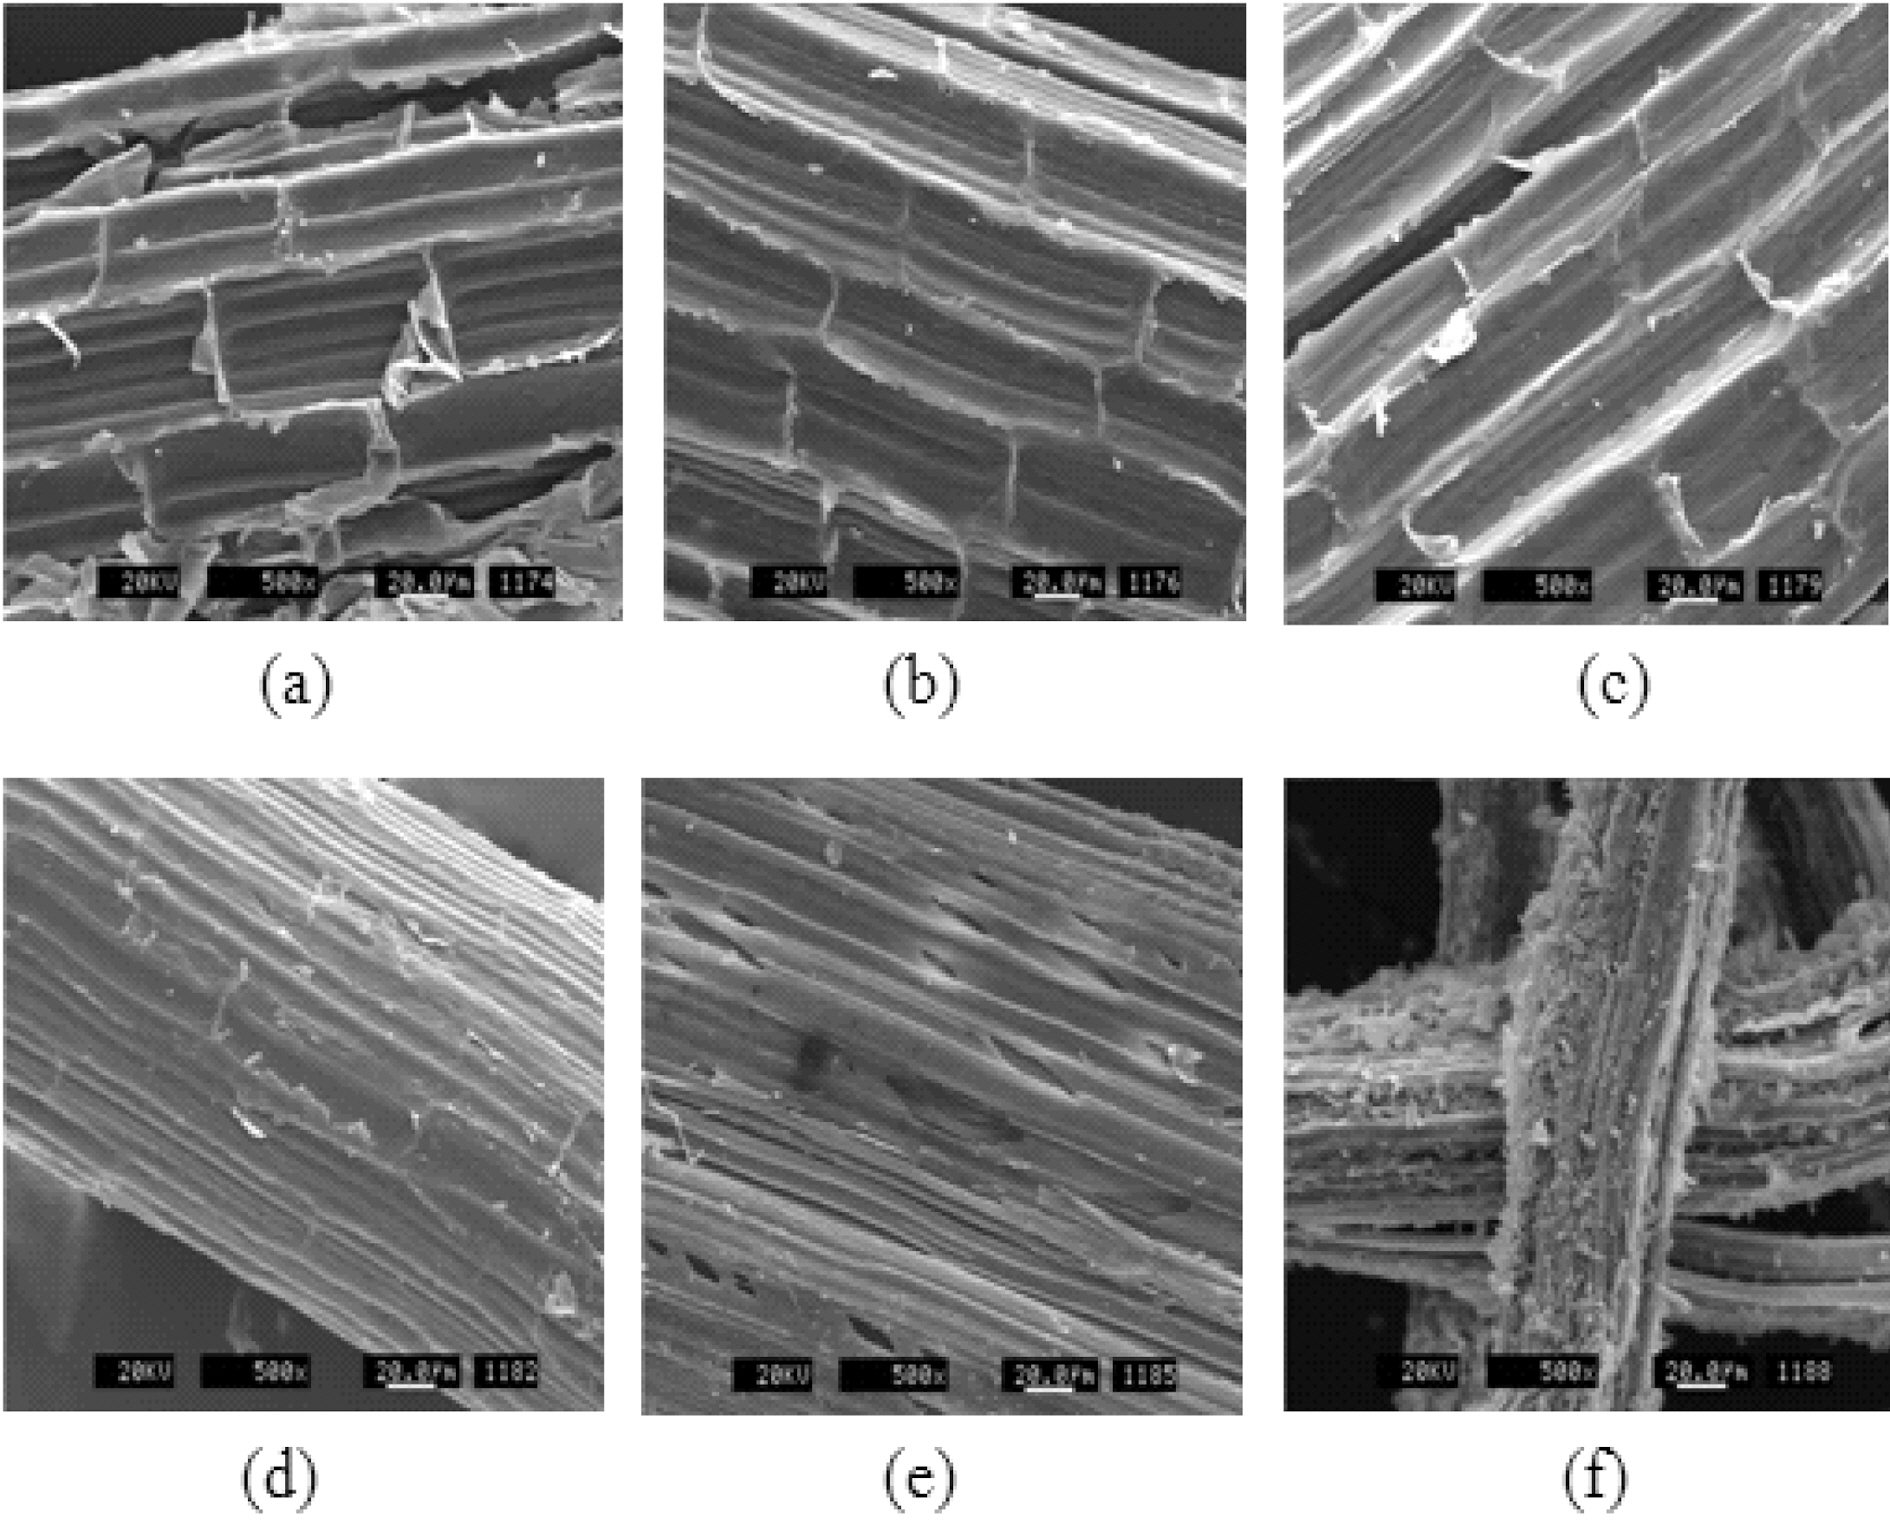
Fig. 3 shows SEM images of henequen fibers. The fibrillar nature of the fibers is clearly shown. It was difficult to distinguish the surface change of fiber between the asreceived fiber and stabilized fiber at 300℃, but the surface morphology of the stabilized fiber at 400℃ was quite different from those of the others, due to the degradation of cell structure. These results indicated that air-stabilization should be performed lower than 300℃ to maintain the fiber structure. Moreover, the treatment produces a number of small voids on the surface of the fiber that promote mechanical interlocking between the fiber and the matrix [8].
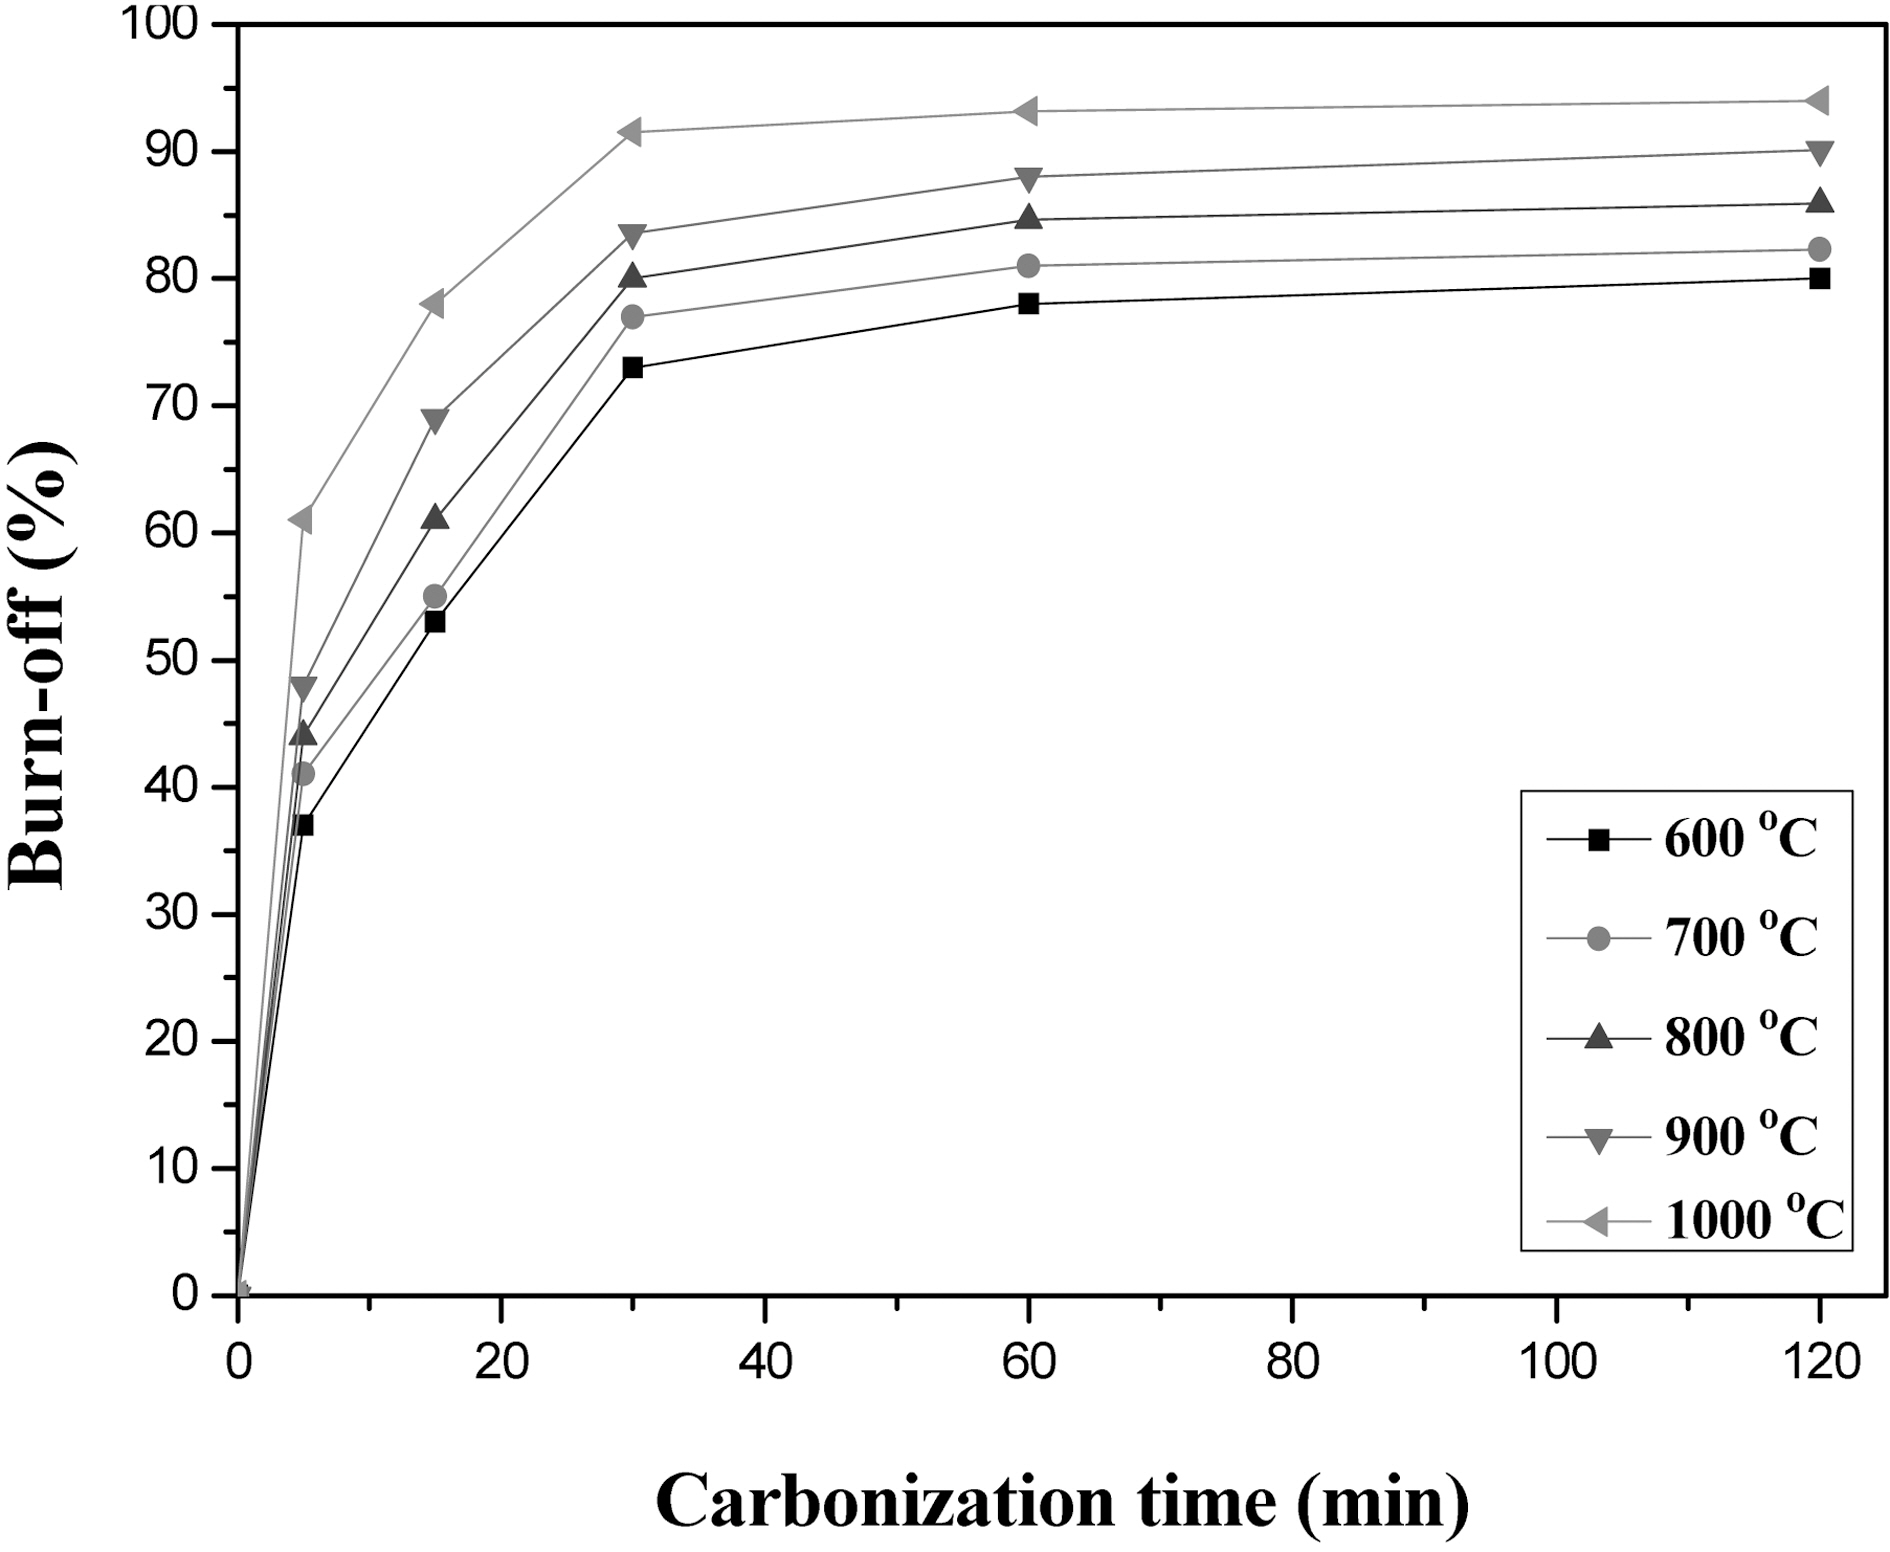
Fig. 5 shows burn-offs of stabilized henequen fiber (270℃, 2 hr) as a function of carbonization time and temperature in nitrogen condition. The burn-off levels rapidly increased at the beginning of carbonization up to 30 min for all the temperatures, and then slowly increased for further carbonization, resulting in the production of CO2 and CO. It is known that CO2 is mainly produced in the range of 300~700℃ and CO is mainly produced in the range of 500~700℃, followed almost all CO over 1000℃ [9]. The rapid weight loss was due to the rapid pyrolysis of cellulose fiber, because the fiber was stabilized at 270℃ and put suddenly into such high carbonization temperatures. Bacon and Tang [4] reported that each cellulose unit breaks down into a residues containing four carbon atoms in this stage,
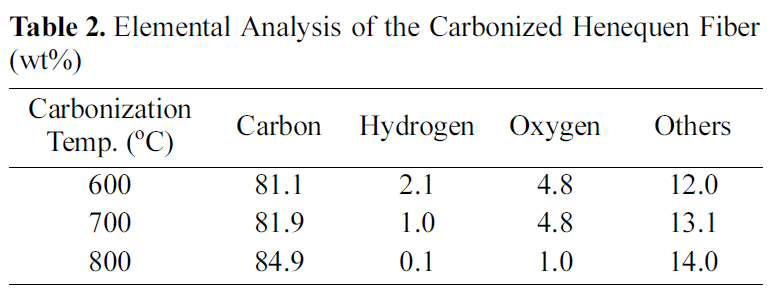
[Table 2.] Elemental Analysis of the Carbonized Henequen Fiber (wt%)

Elemental Analysis of the Carbonized Henequen Fiber (wt%)
which then repolymerize into a carbon polymer, ultimately producing a graphite-like structure above 600℃ by condensation reactions involving the removal of hydrogen.
Table 2 shows elemental analysis of the carbonized henequen fiber. As expected, the carbon content gradually increased as a function of carbonization temperature. The oxygen content of the fiber carbonized at 800℃ is
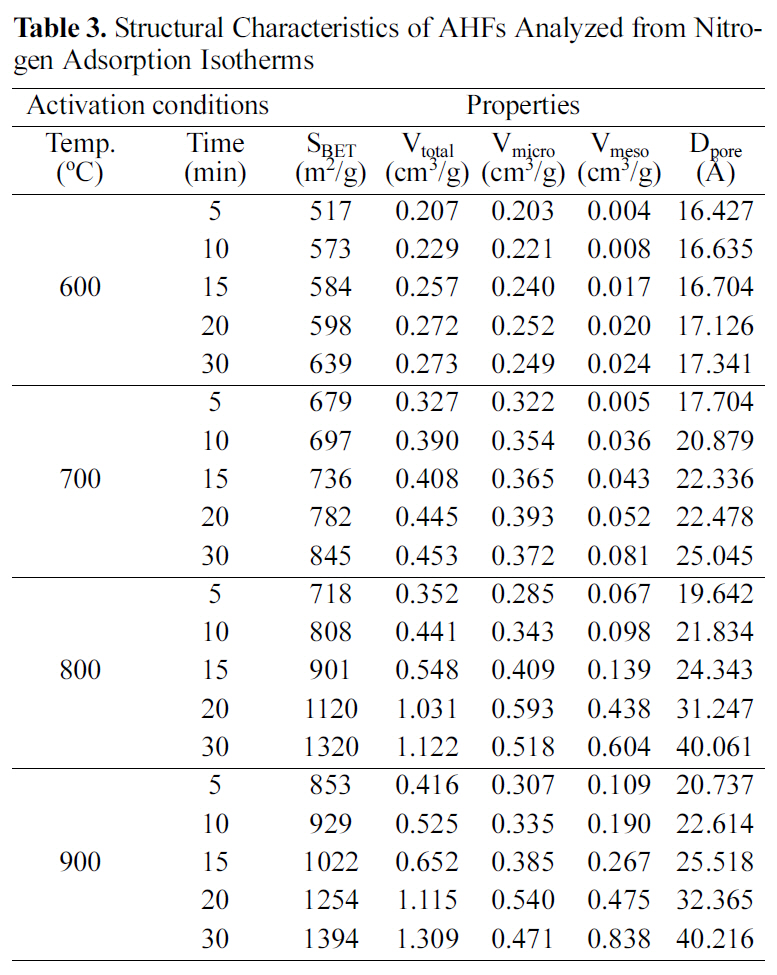
[Table 3.] Structural Characteristics of AHFs Analyzed from Nitrogen Adsorption Isotherms

Structural Characteristics of AHFs Analyzed from Nitrogen Adsorption Isotherms
significantly smaller than that of the other fibers carbonized at lower temperatures, while Prauchner et al [10] reported that aromatic rings start to undergo condensation above 700℃ resulting in the formation of micropores during carbonization.
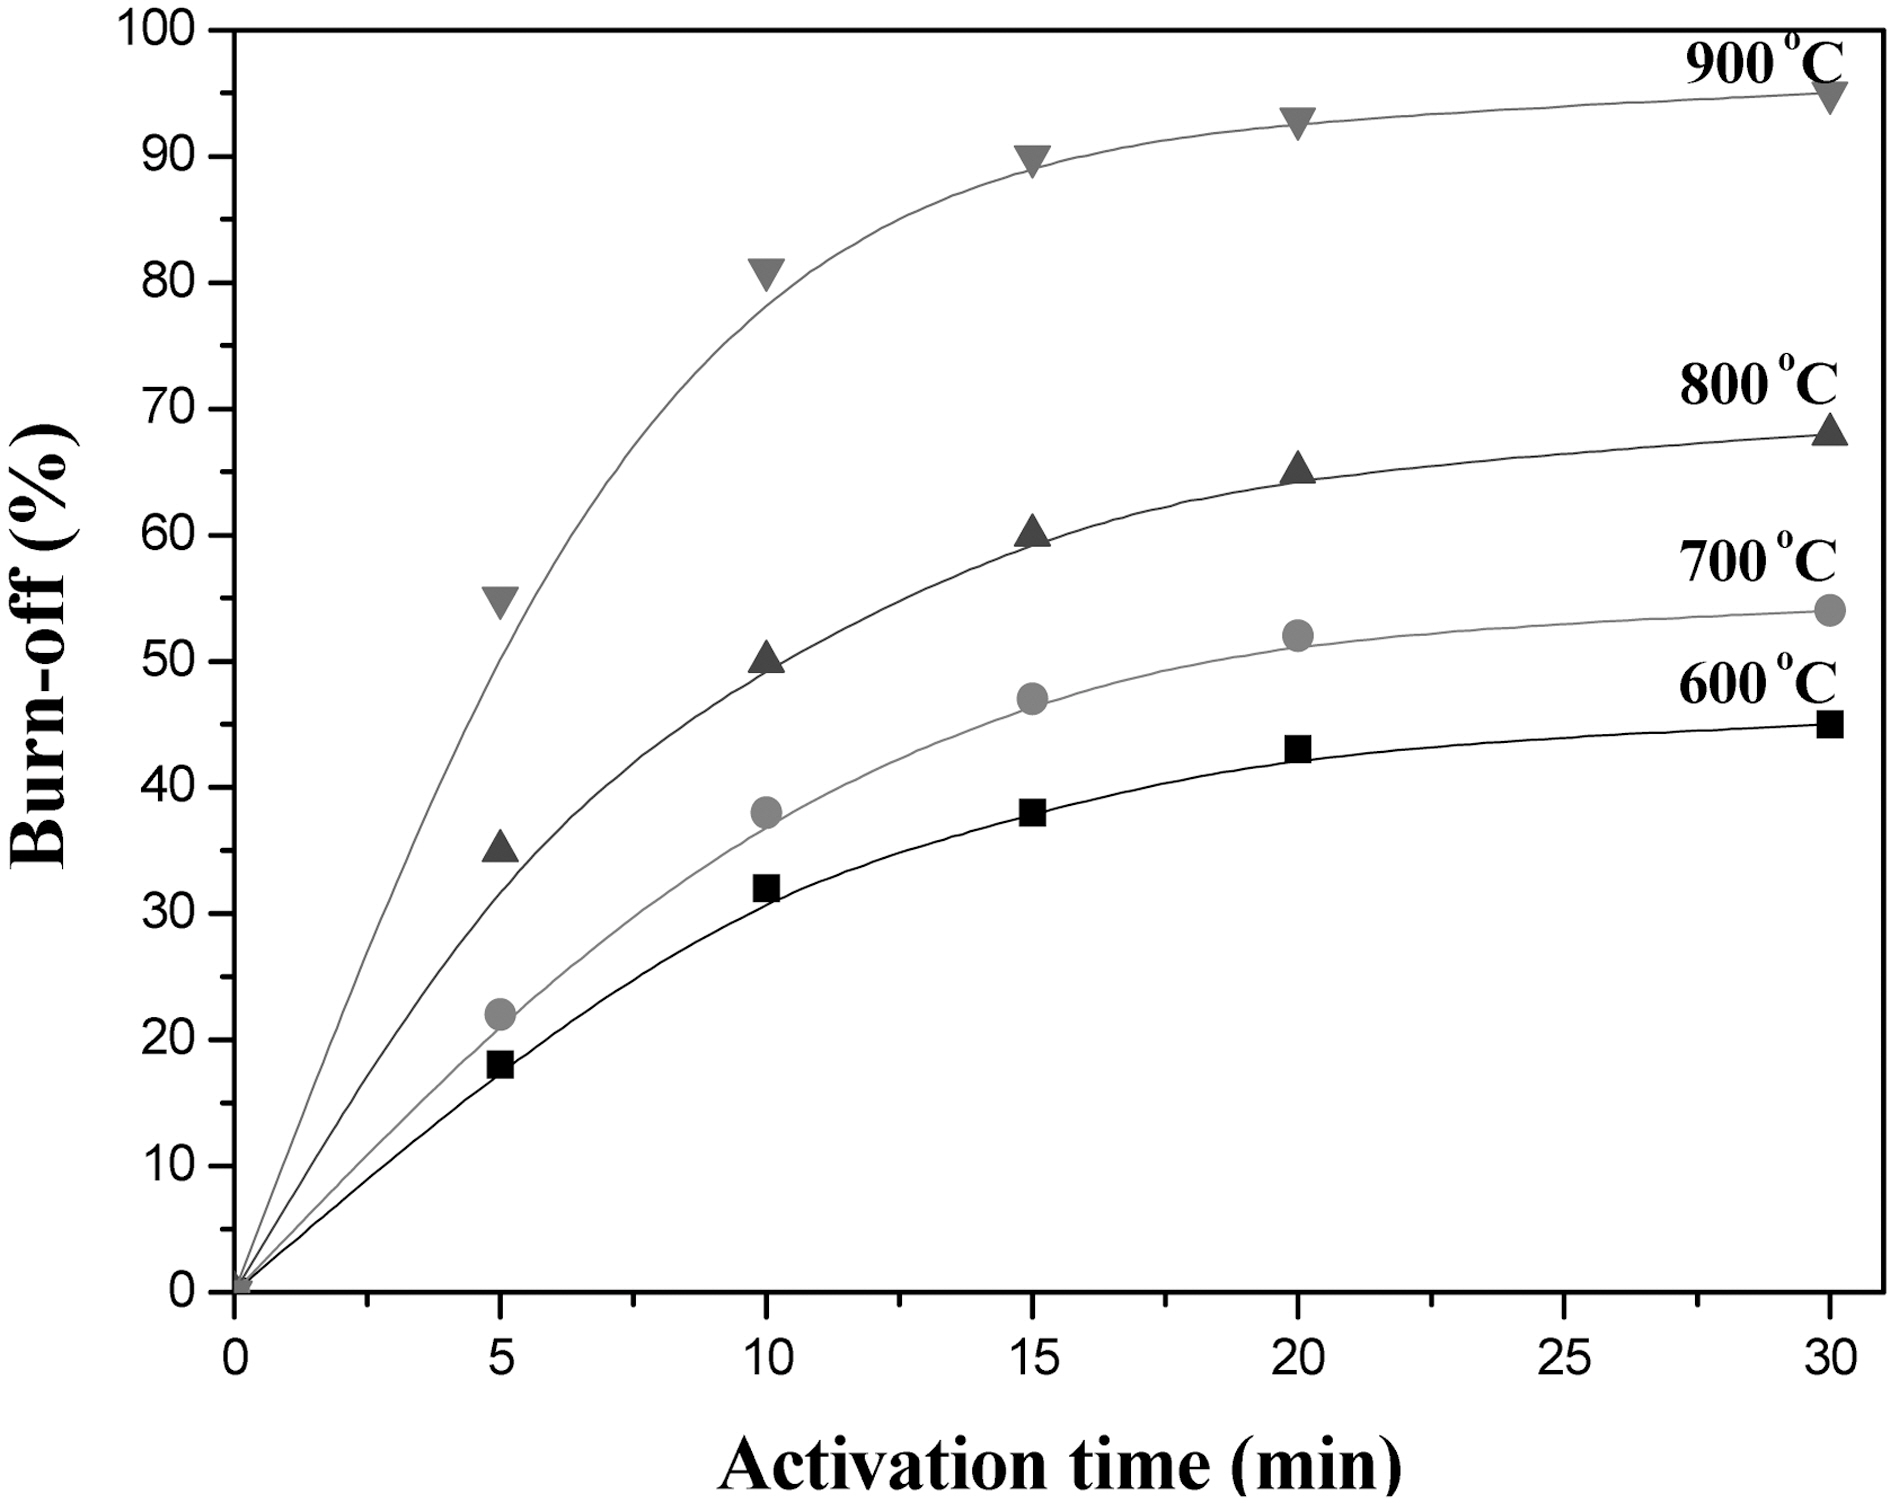
Fig. 6 shows burn-offs of carbonized henequen fibers (800℃, 1 hr) as a function of activation temperature at 600,700, 800 and 900℃ in the stream of 0.45 H2O/N2 (v/v). The burn-offs gradually increased with the increase of activation temperature, and that of the fiber carbonized at 900℃ was significantly increased due to the higher activation temperature than carbonization temperature. Therefore, proper AHF can be chosen from the measurements of adsorption isotherms, specific surface area, and pore size distribution.
Table 3 shows structural characteristics of AHFs analyzed from nitrogen adsorption isotherms. The BET specific surface area, pore volume, and pore diameter increased as activation temperature and time increased. Especially micropore volume gradually increased up to 20 min, which resulted in the increase of specific surface area. On the other hand, micropore volumes decreased, while mesopore volumes continuously increased with more than 20 min activation.
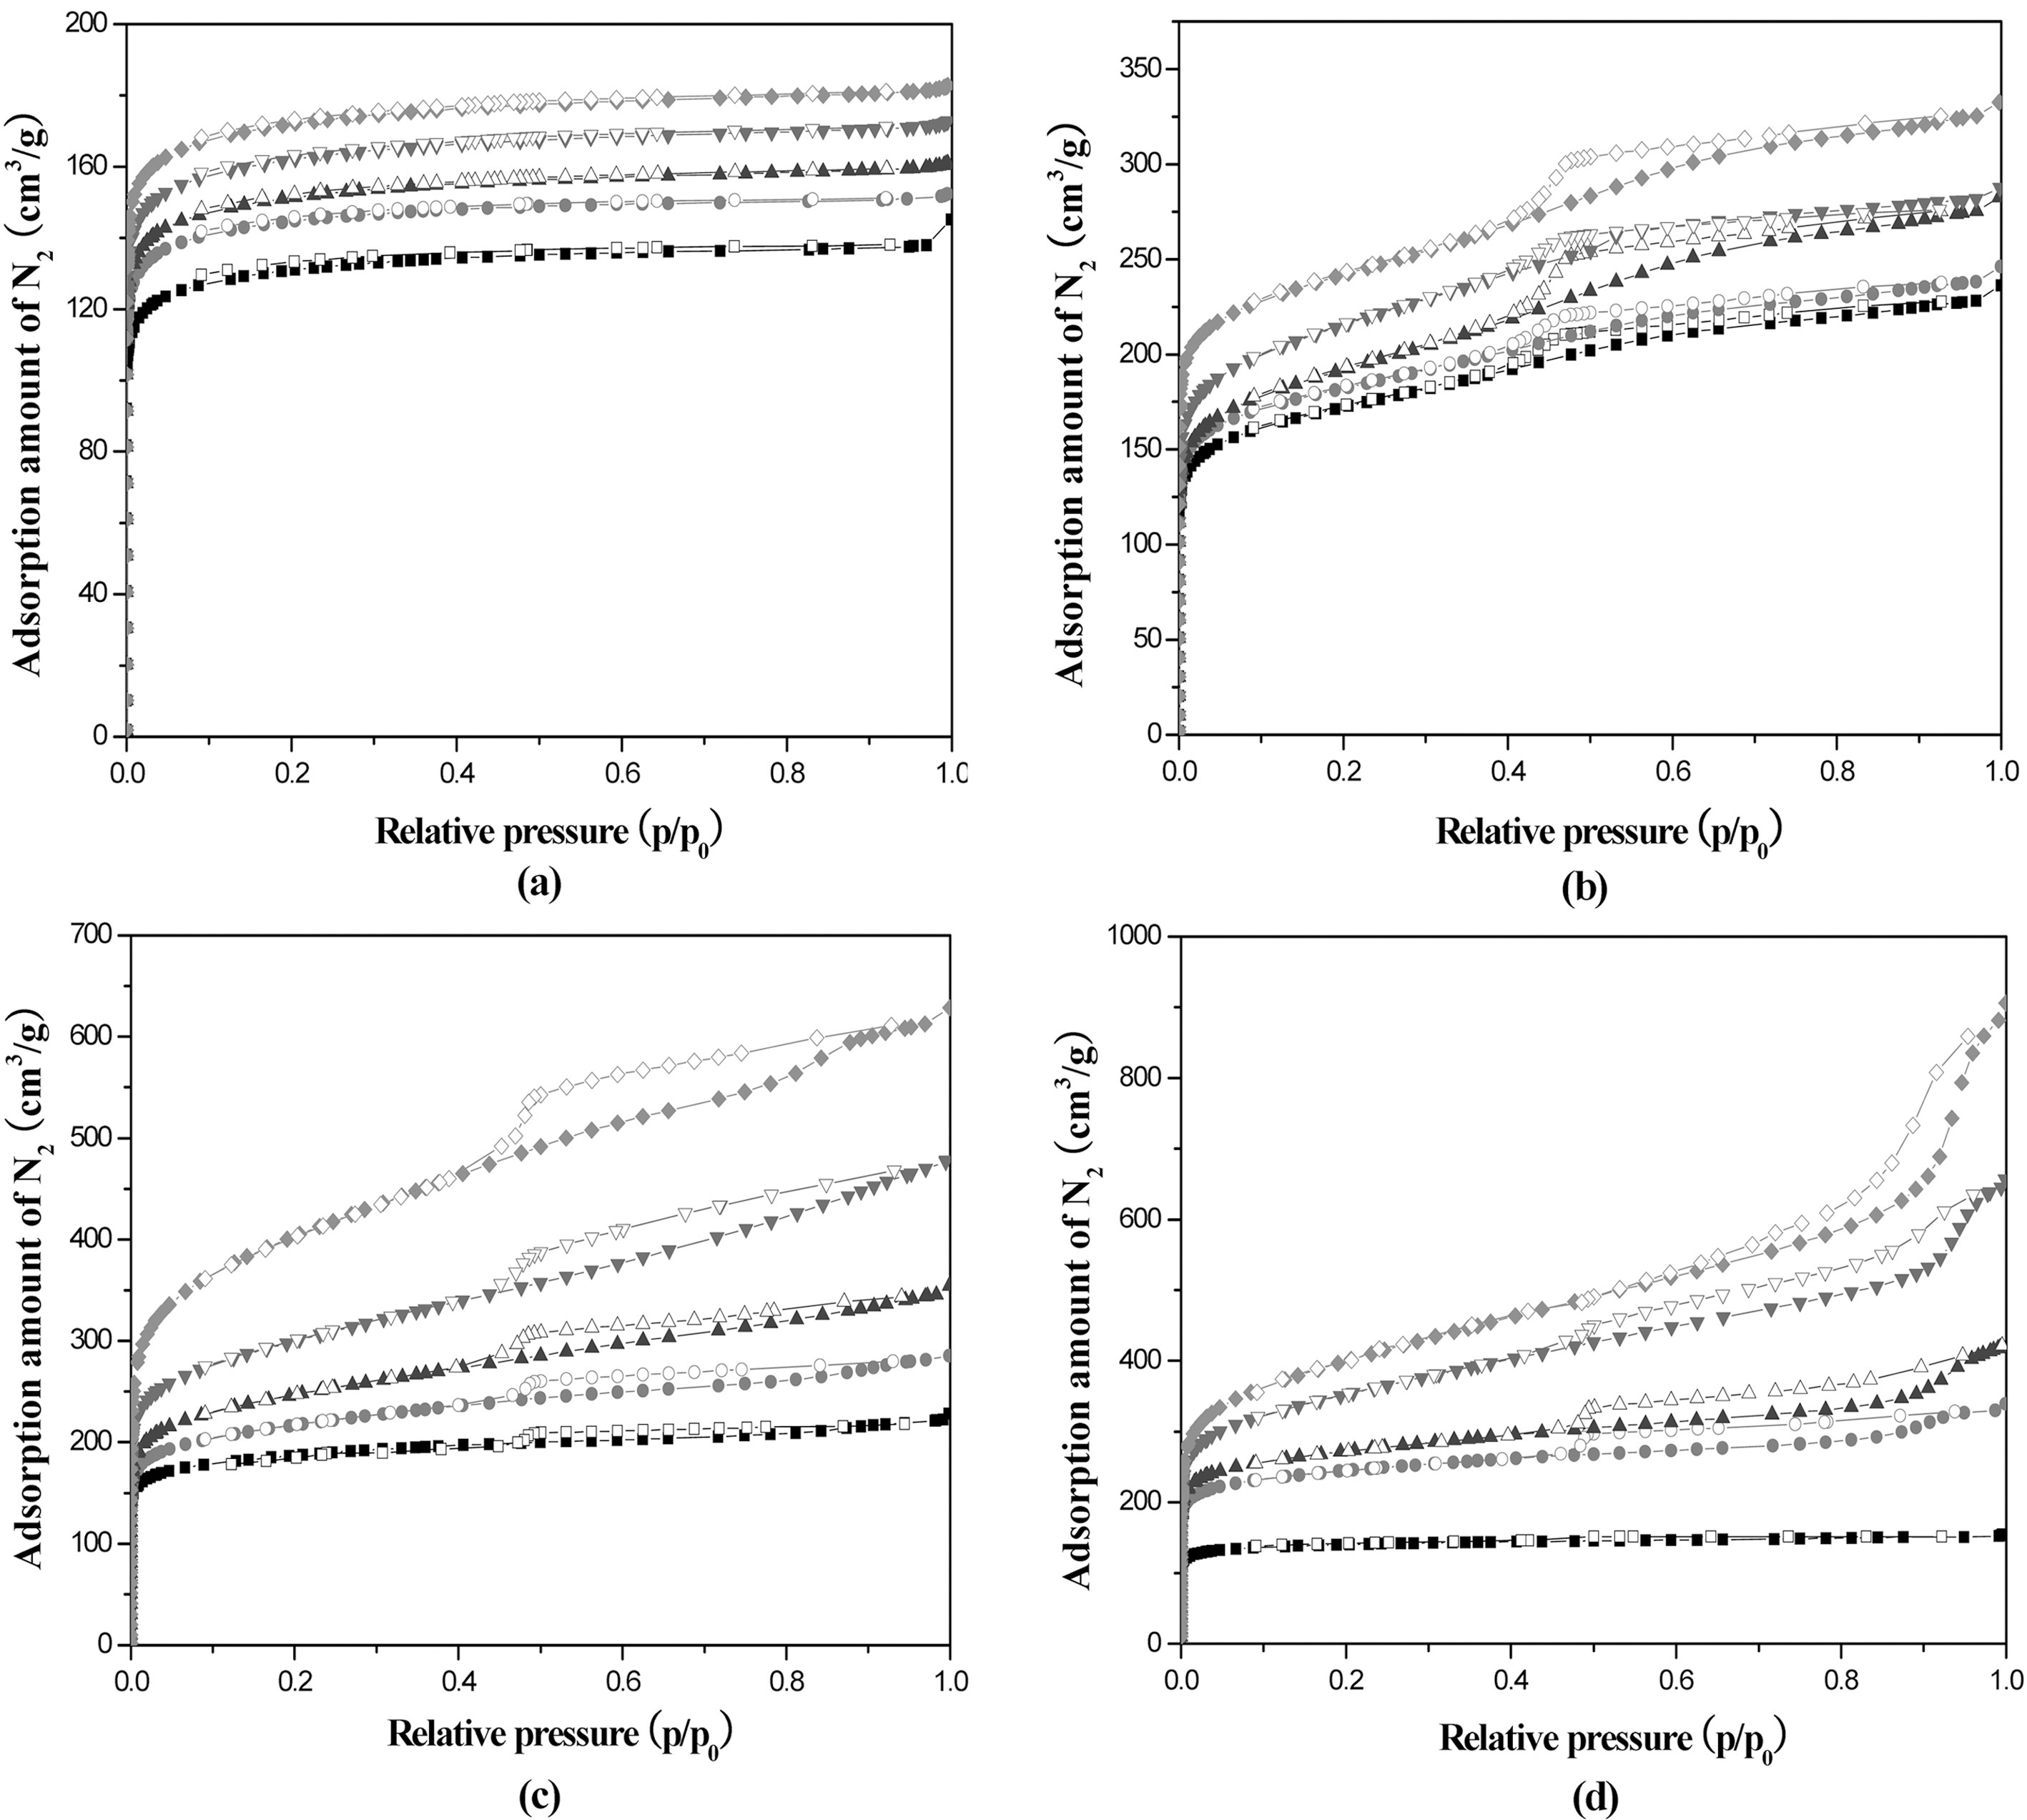
Fig. 7 shows nitrogen adsorption and desorption isotherms
at 77 K. The isotherms of AHF prepared at 600℃ show type I indicating the development of micropores. However, the isotherms prepared over 700℃ show hysteresis loops which indicates the Type IV isotherm and lots of micopores were changed to mesopores by increasing the activation temperature. Also, the increased adsorption amount indicates the increase of total pore volume by increasing the activation temperature over 700℃.
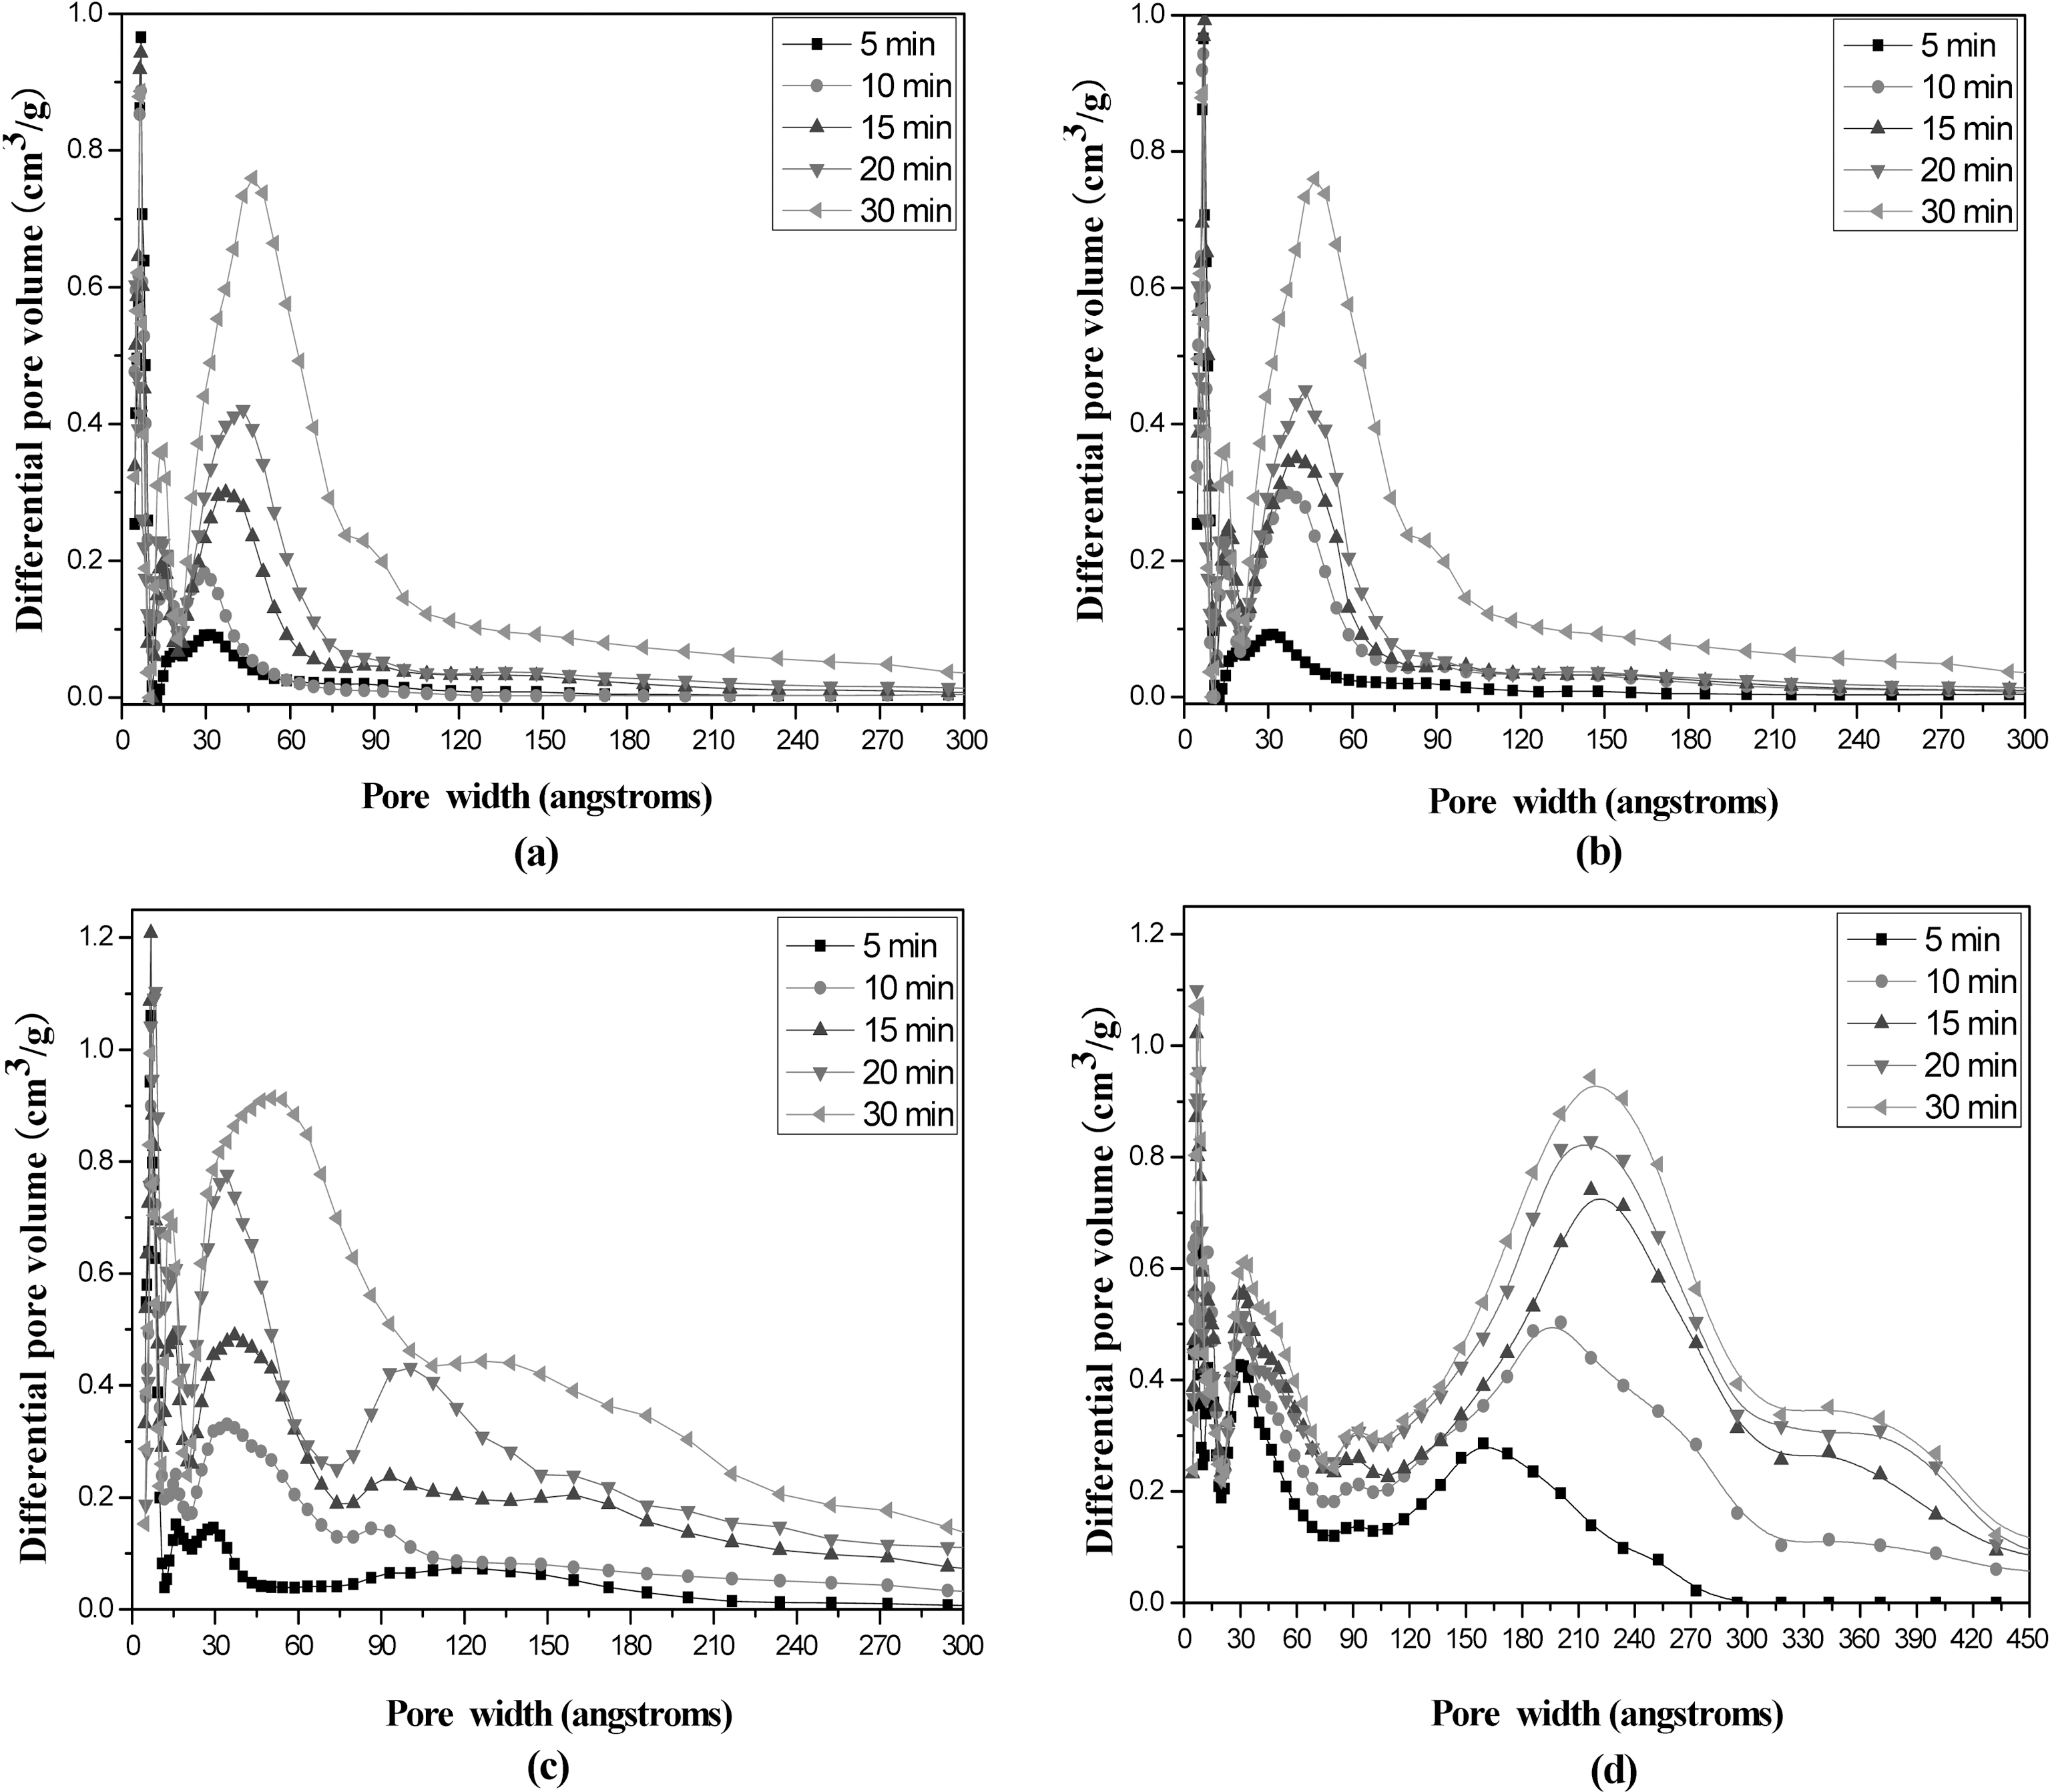
Fig. 8 shows the pore size distributions of AHF with different activation times and temperatures. The respective pore volumes calculated on the basis of nitrogen isotherm in (a), (b), (c), and (d) in Table 3 were compared each other. From the figures, the pore size distribution was distinctly moved to larger pore width as increasing the activation temperature and bimodal distribution was appeared above 800℃. Also, it appears that the difference in the heating rate during carbonization has influenced the formation of microand mesopores significantly during subsequent steam activation. The increased heating rate during carbonization leads to the increase mesopore volume in the AHF.
3.4. Methylene blue decolorization of AHF
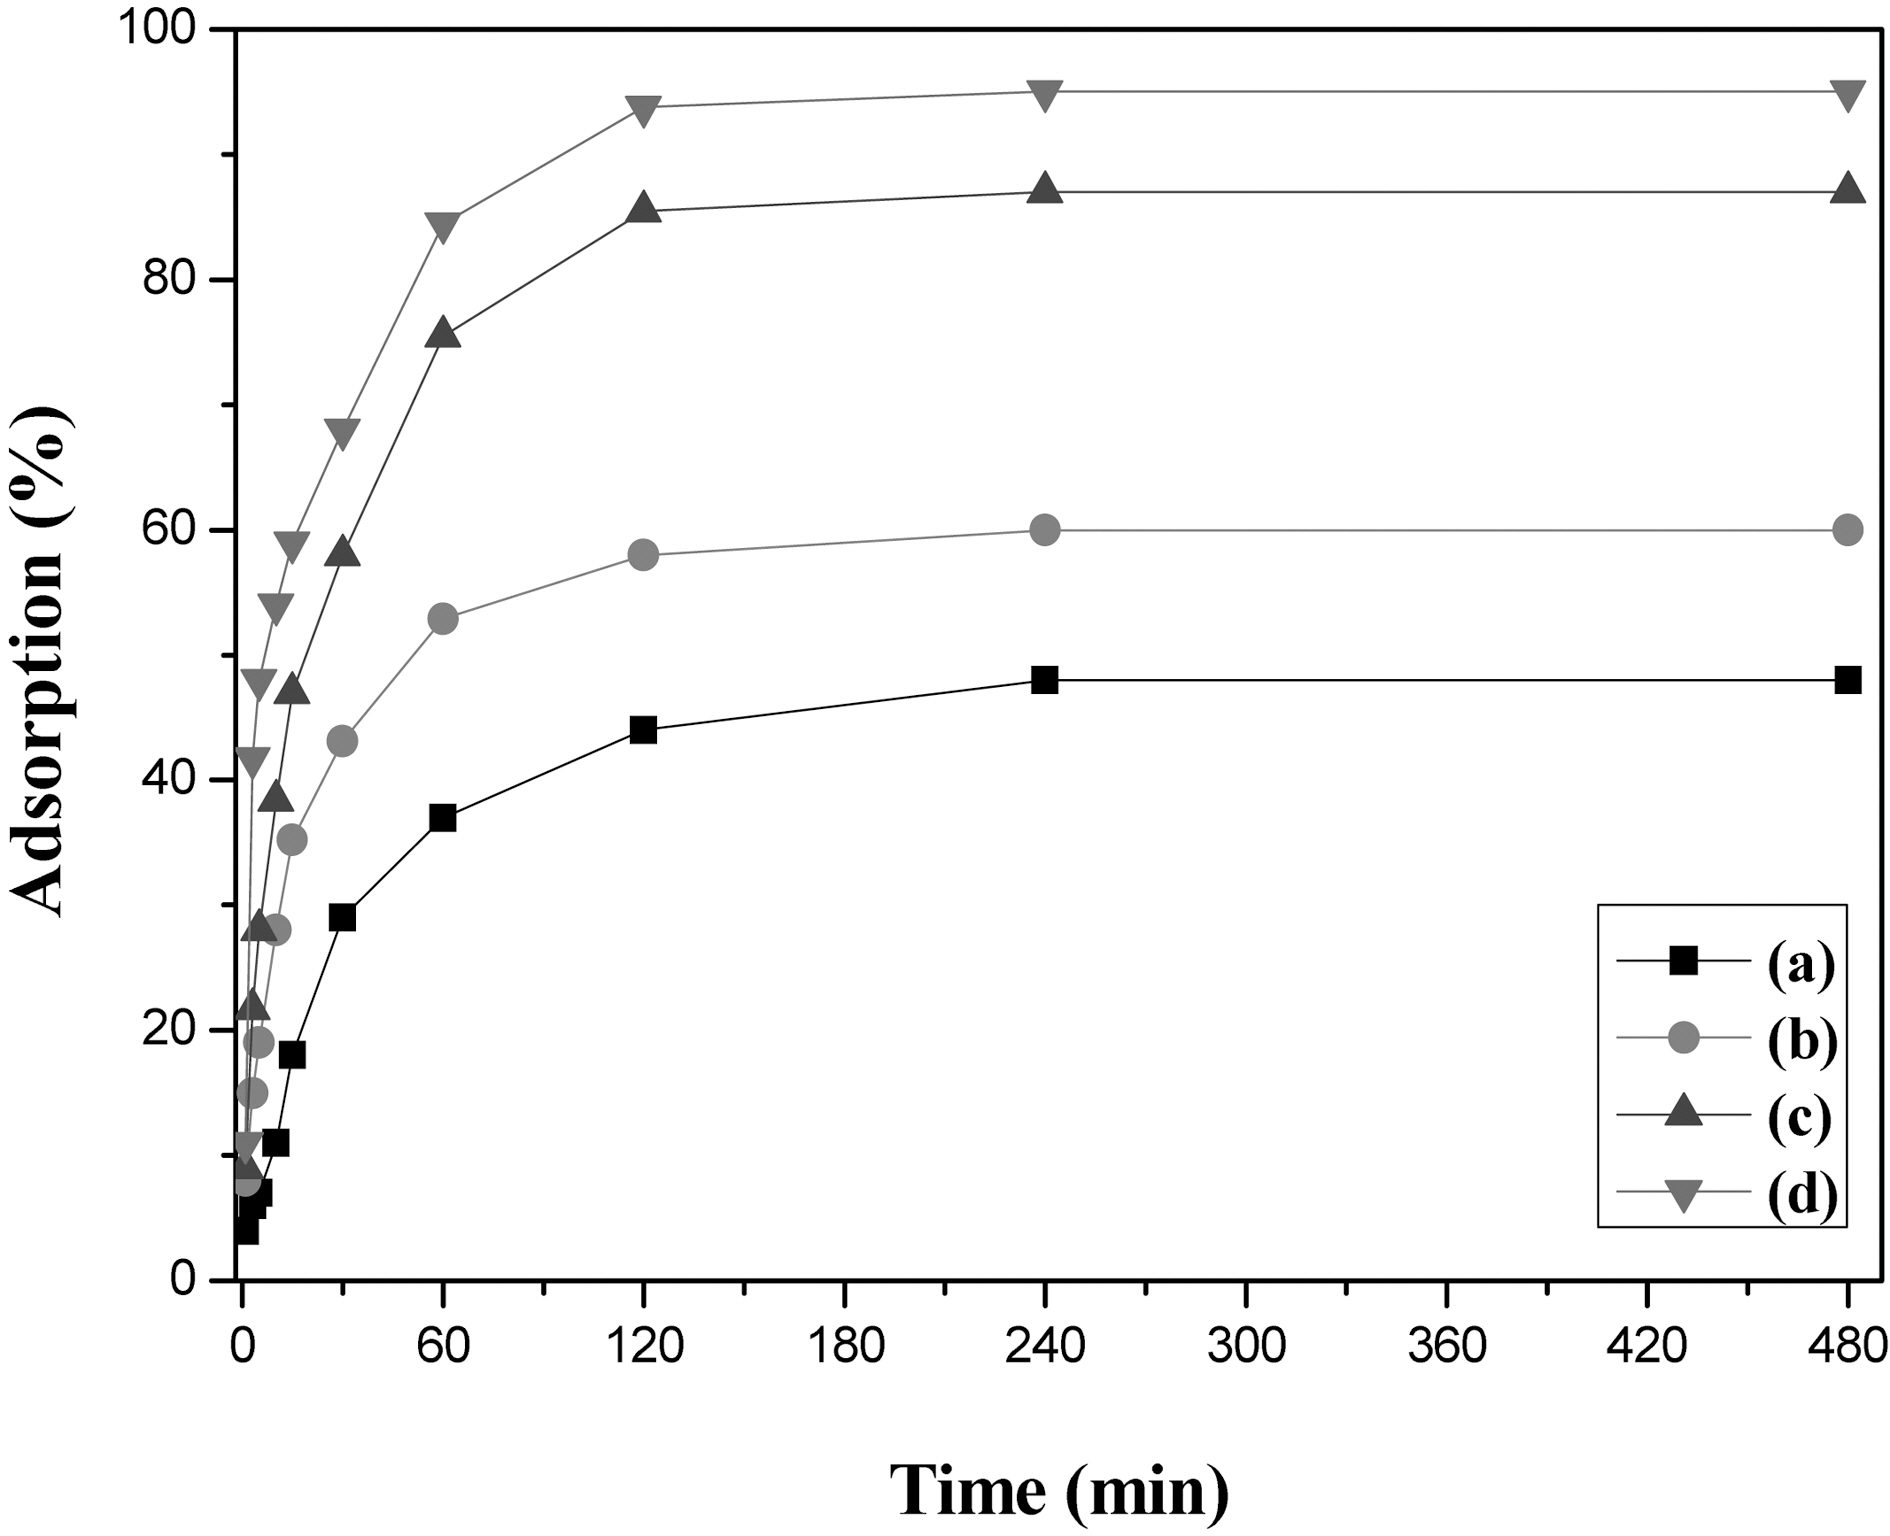
Fig. 9 shows methylene blue decolorization capacity of
AHF prepared at 600, 700, 800, and 900℃ for 30 min. without agitation. The decolorization of methylene blue was rapidly increased, especially in the beginning stage on AHF and the capacity of was proportional to the increase of activated temperature, which means the increase of specific surface area or total pore volume. In this experiment, the AHF prepared at 900℃ for 30 min adsorbed the methylene blue about 570 mg/g-AHF for 2 hr. In view of the adsorption rate and amount of fibrous adsorbents were rapidly enhanced by agitation, the decolorization capacity of AHF can be enhanced by agitation. With these results, promisable natural cellulose based fibrous adsorbent, AHF, can be obtained by proper stabilization, carbonization, and steam activation.
Natural cellulose based fibrous adsorbents having more than 1300 m2/g specific surface area and 1.1 cm3/g pore volume can be prepared from henequen by stabilization, carbonization, and steam activation. The optimum conditions of each stage can be selected in consideration of yield. Structural characteristics were significantly influenced by the activation temperature and time. Only micropores developed AHF can be obtained from carbonized henequen fiber within 10 min. activation time between 600~1000℃, however as increasing the activation time over 10 min, lots of micropores developed were changed to mesopores showing a bimodal pore size distribution. The prepared AHF shows good methylene blue decolorization capacity.