Potassium hydroxide activated carbons were prepared from Egyptian petroleum cokes with different KOH/coke ratios and at different activation temperatures and times. The textural properties were determined by adsorption of nitrogen at -196℃. The adsorption of iodine and methylene blue was also investigated at 30℃. The surface area and the non-micropore volume increased whereas the micropore volume decreased with the increase of the ratio KOH/coke. Also the surface area and porosity increased with the rise of activation temperature from 500 to 800℃. Textural parameter considerably increased with the increase of activation time from 1 to 3 h. Further increasing of activation time from 3 to 4 h was associated with a less pronounced increase in textural parameters. The adsorption of iodine shows the same trend of surface area and porosity change exhibited by nitrogen adsorption, with KOH/coke ratio and temperature of activation. Adsorption of methylene blue follows pseudo-first-order kinetics and its equilibrium adsorption follows Langmuir and D-R models.
Activated carbons with expanded surface area and large pore volume are widely used as versatile adsorbents for the adsorption of gaseous and liquid phases. Activated carbons can be produced from a variety of raw materials of these, agricultural wastes, coal, petroleum cokes are the most commonly used precursors.
Cokes are byproducts of the petroleum industry. With their use as activated carbon, a high added value can be obtained. Petroleum coke is a good precursor for preparing high surface area active carbons [1-7].
Basically, the methods for preparation of active carbons can be grouped into two types, physical activation method and the chemical activation methods [2]. In the case of the chemical method, the commonly used activating agents include KOH, ZnCl2, H3PO4, H2SO4, etc. Ahmadpour and Do [8] reported that the most important parameter in chemical activation with KOH is the extent of alkali impregnation and that chemical activation is more flexible in producing more varieties of activated carbons with desirable pore size distributions [9]. No general mechanism for chemical activation has been adopted [10]. However, it is now well established that the nature of the raw material, the type and amount of activating agent, the process of activation involved and the operative parameters in this process play important roles in determining the textural properties and consequently the adsorption capacity of activated carbon obtained [11-18].
The textural properties of adsorbents are conventionally determined from nitrogen adsorption at -196℃. However, more information could be obtained by determining the adsorption isotherms from the liquid phase, e.g. by comparing the adsorption of fairly large molecules of methyl blue or iodine.
The present investigation is devoted to prepare chemically activated carbons from a cheap and abundant precursor. Petroleum coke from El-Nasr Company (Suez- Egypt) is a byproduct and its accumulation represents a problem to the company. Potassium hydroxide was selected as an activating agent that can be regenerated for further activation cycles [19]. The determination of the textural properties of the activated carbons prepared via nitrogen adsorption is one of the objects of this investigation. The adsorption of iodine from aqueous potassium iodide at different temperature and also the adsorption of methylene blue dye from aqueous solution have been investigated and the results were discussed to show the role of some textural parameters and conditions of activation in determining the sorption capacity of the activated carbons prepared.
A typical Egyptian petroleum coke from El-Nasr Co.
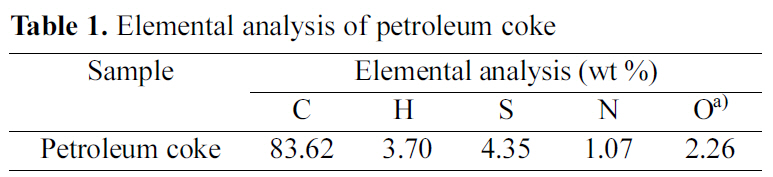
[Table 1.] Elemental analysis of petroleum coke

Elemental analysis of petroleum coke
(Suez-Egypt) was used as a precursor for the preparation of activated carbons. It was ground, sieved and the grain size in the range 125~210 ㎛ was selected. The sample was dried at 110℃ till constant weight. The elemental analysis of the raw material was made using Vario El-Elementar instrument at National Research Centre. The data of elemental analysis is listed in Table 1.
2.2. Preparation of activated carbons
Chemical activation with KOH was carried out using the impregnation method. Thus 10 g of coke were mixed by stirring with 50 ml of aqueous solutions containing, different weights of KOH according to the KOH/coke ratio required. The mixture was equilibrated at room temperature for 3 days, dried at 120℃ before carbonization in nitrogen atmosphere. The rate of heating was 10℃/min and the sample was soaked at the maximum temperature required for 1~4 h. Details of preparation and activation are given elsewhere [19]. The activated carbons were designated as follows: the letter prefers to carbons impregnated with 10, 20 and 40 g, respectively. The letters a, b, c and d following the Arabic number, indicate the activation time 1, 2, 3 and 4 h, respectively. The last Arabic number in each designation gives when multiplied by 100, the activation temperature. Thus for example, the designation P2c7 stands for the activation carbon prepared by impregnating the coke with KOH at a ratio of KOH/coke =2 and carbonized for 3h at 700℃ whereas for P4a8, KOH/coke ratio =4, the time of activation was 1 h and the activation temperature was 800℃.
2.3. Characterization of activated carbons
The activated carbons were characterized via measurements of the Brunauer-Emmett-Teller (BET) surface area, iodine number and methylene blue dye adsorption. The BET surface area was determined by nitrogen adsorption at -196℃ using a conventional volumetric apparatus. Prior to any adsorption measurement, the carbon sample was degassed at 200℃ for 6 h under a reduced pressure at 10-5 torr. For the determination of iodine number, aqueous I/KI solutions with an I2 concentration of 0.05 mol/L were used in adsorption experiments. Activated carbon (0.25 g) was added in 50 ml of this solution and shaken at 30℃ for 24 h in the dark colored bottles. The residual concentration of I2 was determined by titration against Na2S2O3 using the starch as indicator. The amount of I2 adsorbed was calculated from the difference between the amount of I2 in the initial solution and in the supernatant. Finally, the iodine number was calculated as the number of mg iodine adsorbed per g activated carbon.
Kinetics and equilibrium adsorption of methylene blue (MB) was investigated at 30℃. For kinetic measurement, the initial concentration of MB was (100 mg/l) used and equilibrium time of 10~1500 min was allowed. The equilibrium adsorption of MB was performed using different initial concentration of MB and an equilibrium time of 24 h was allowed. The residual concentrations of MB were measured using UV-visible spectrophotometer at λmax=626 nm. All the experiments were carried out in duplicate and the average values were considered.
The textural properties of an adsorbent determine its adsorption capacity and adsorption selectivity. These textural properties are conventionally determined from the data of nitrogen adsorption of the adsorbent at -196℃. For all the activated carbons prepared in this investigation, the adsorption-desorption isotherms were made at -196℃. The adsorption was followed until near saturation, i.e, at a relative vapor pressure approaching unity (p/po-1.0) and the desorption branch was followed until the closure of the hysteresis loop was observed.
The nitrogen adsorption data were carefully analyzed using the conventional BET method [20] for the determination of the specific surface area SBET (m2/g), the total pore volume VT (ml/g) and the mean pore radiusr(nm). The α-method [21] was also used to determine two other important textural parameters, namely the micropore volume vam(ml/g) and the non-micropore volume vam(ml/g).
The most important factors contributing to the textural properties of chemically activated carbons are: the type of precursor [6,22] and the type of activating agent [21,23]. However, many other operational conditions affect the textural characteristics. These conditions include: pretreatment of the precursor before activation [24], procedure of activation [1], atmosphere of carbonization and/or activation, rate of heating during carbonization and /or activation, activation temperature [3,12] activation time [1,22] and the activating agent/precursor weight ratio [22-25]. The last three operational conditions were selected in the present investigation.
3.1. Effect of activating agent/ precursor weight ratio
Three samples with activating agent/ precursor ratios of 1, 2 and 4 (P1c7, P2Xc7, and P4c7) were prepared according to the procedure given in details in the experiment part of this paper.
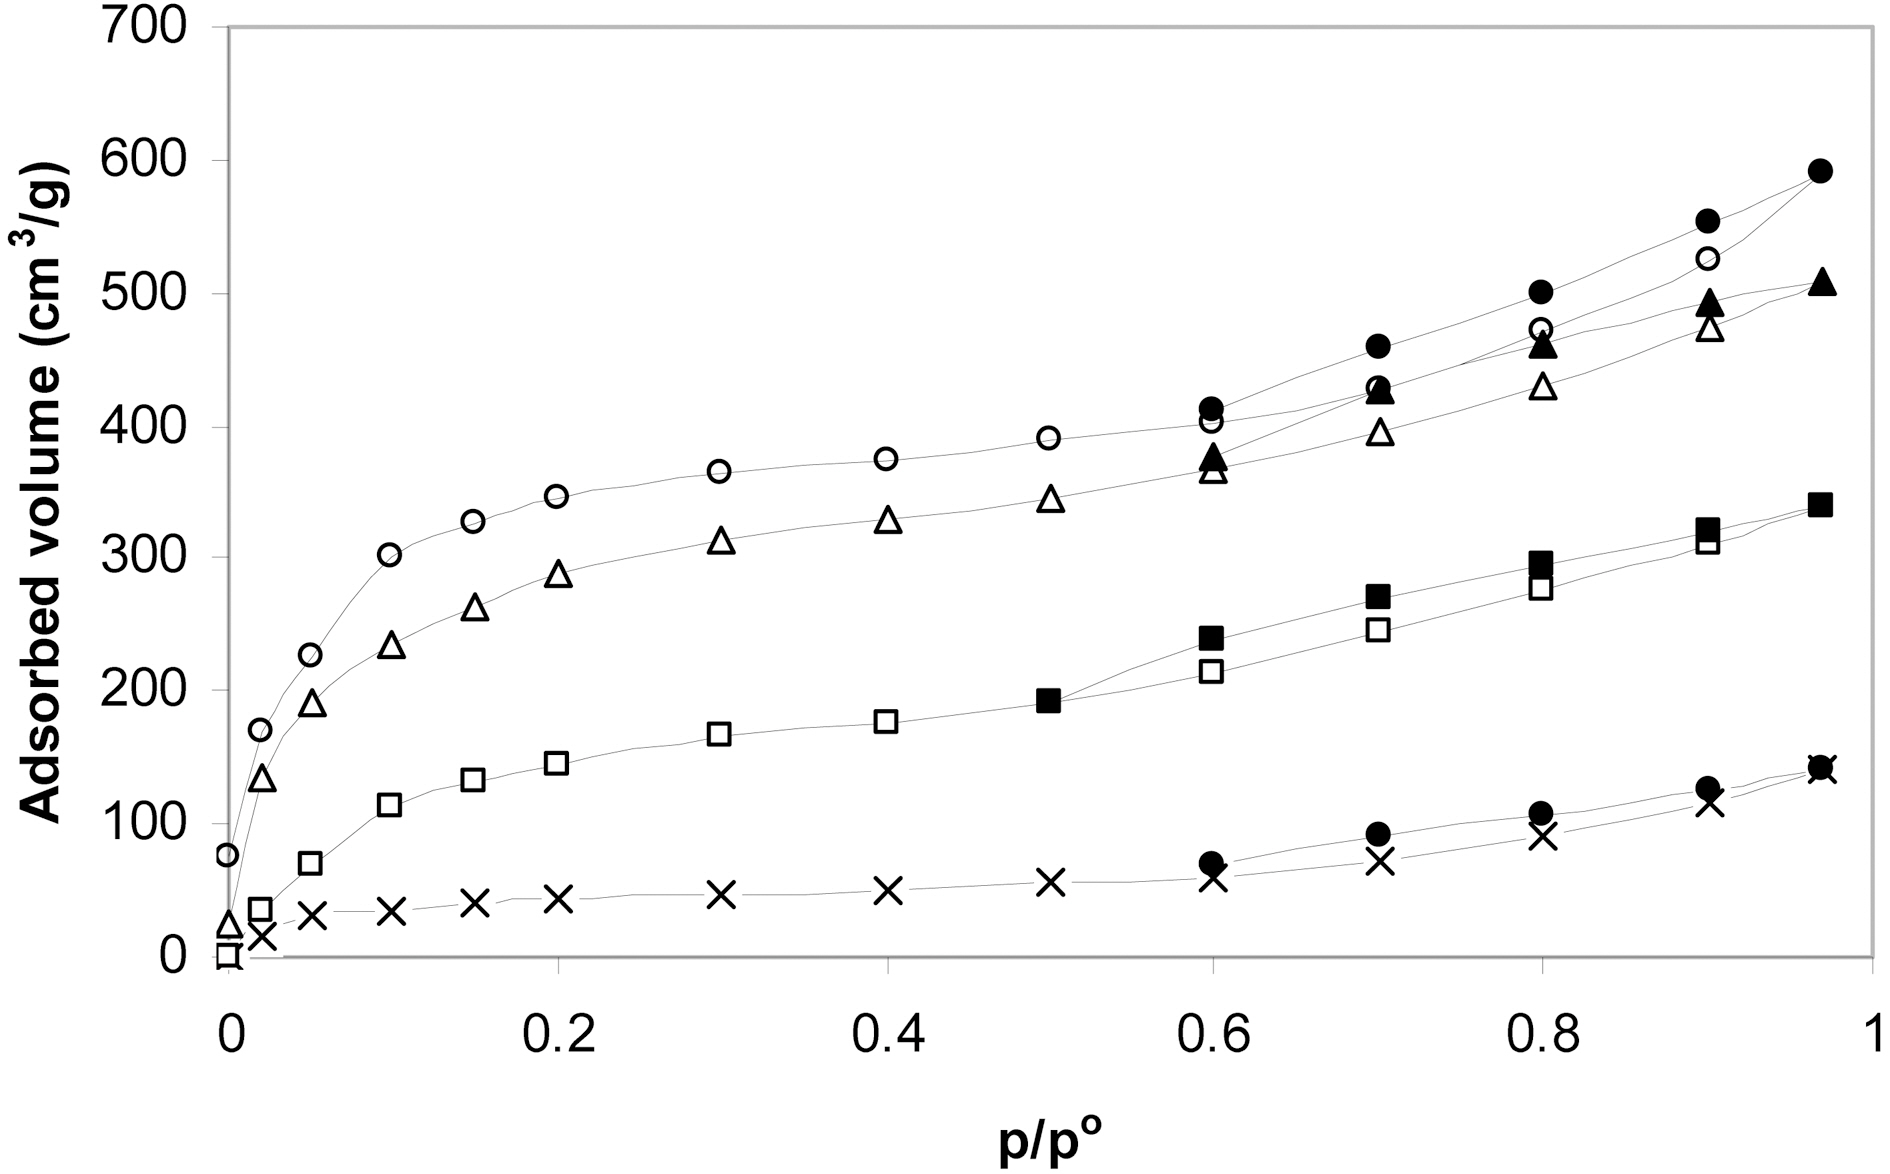
The nitrogen adsorption isotherms of these carbons are shown in Fig. 1. It is depicted that the isotherms of P1c7 and
P2c7 are typical type I characteristic of adsorption in micropores [26]. The nitrogen adsorption isotherm of P4c7 is quite different than those of the other two carbons. Thus, although it is mostly of type I, it shows upward deviation above P/Po=0.5 and also exhibits closed hysteresis loop. This upward deviation together with the existence of hysteresis loop indicates the tendency of the adsorption isotherm to show some characteristics of type IV.
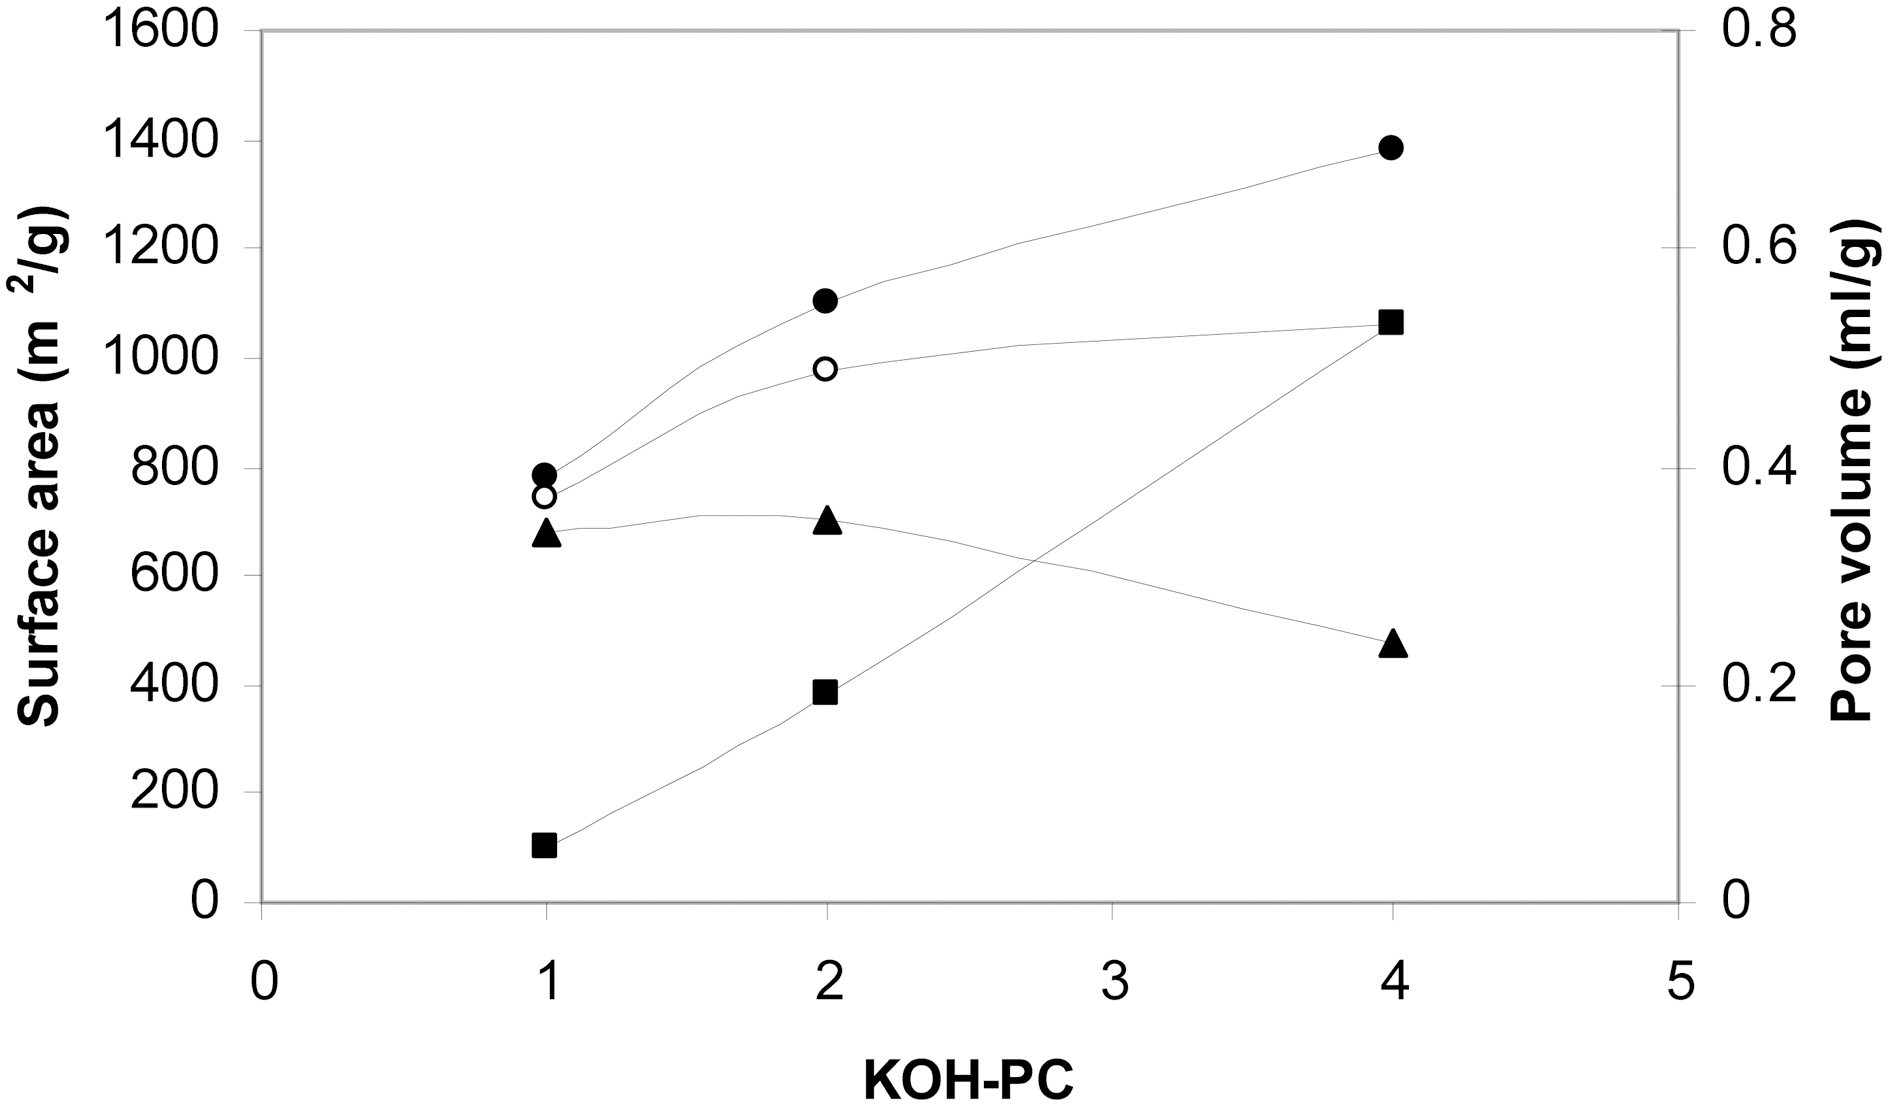
The effect of activating agent/ precursor weight ratio could be clearly observed in Fig. 2. Fig. 2 depicts that SBET increased with the increase of the ratio. However, the increase of SBET is more pronounced with the increase of the ratio from 1 to 2. This may at least be partially attributed to the associated changes in the pore dimensions. The change of pore dimensions with the change of the activating agent/precursor ratio is also shown in Fig. 2. Thus, the micropore volume continuously decreased whereas the non-micropore volume increased with the increase of the ratio from 1 to 4. During chemical activation with KOH, the mechanism of pore formation may involve (i) creation of micropores due to
the evolution of gaseous products such as H2, CH4, CO and CO2. (ii) removal of the corresponding metal salts from the internal volume of the carbon during the washing step. (iii) with the increase of KOH/coke ratio, the amounts of CO2 and water vapor increase. These oxidizing gases cause errosion of pore walls leading thus to pore widening.
3.2. Effect of the activation temperature
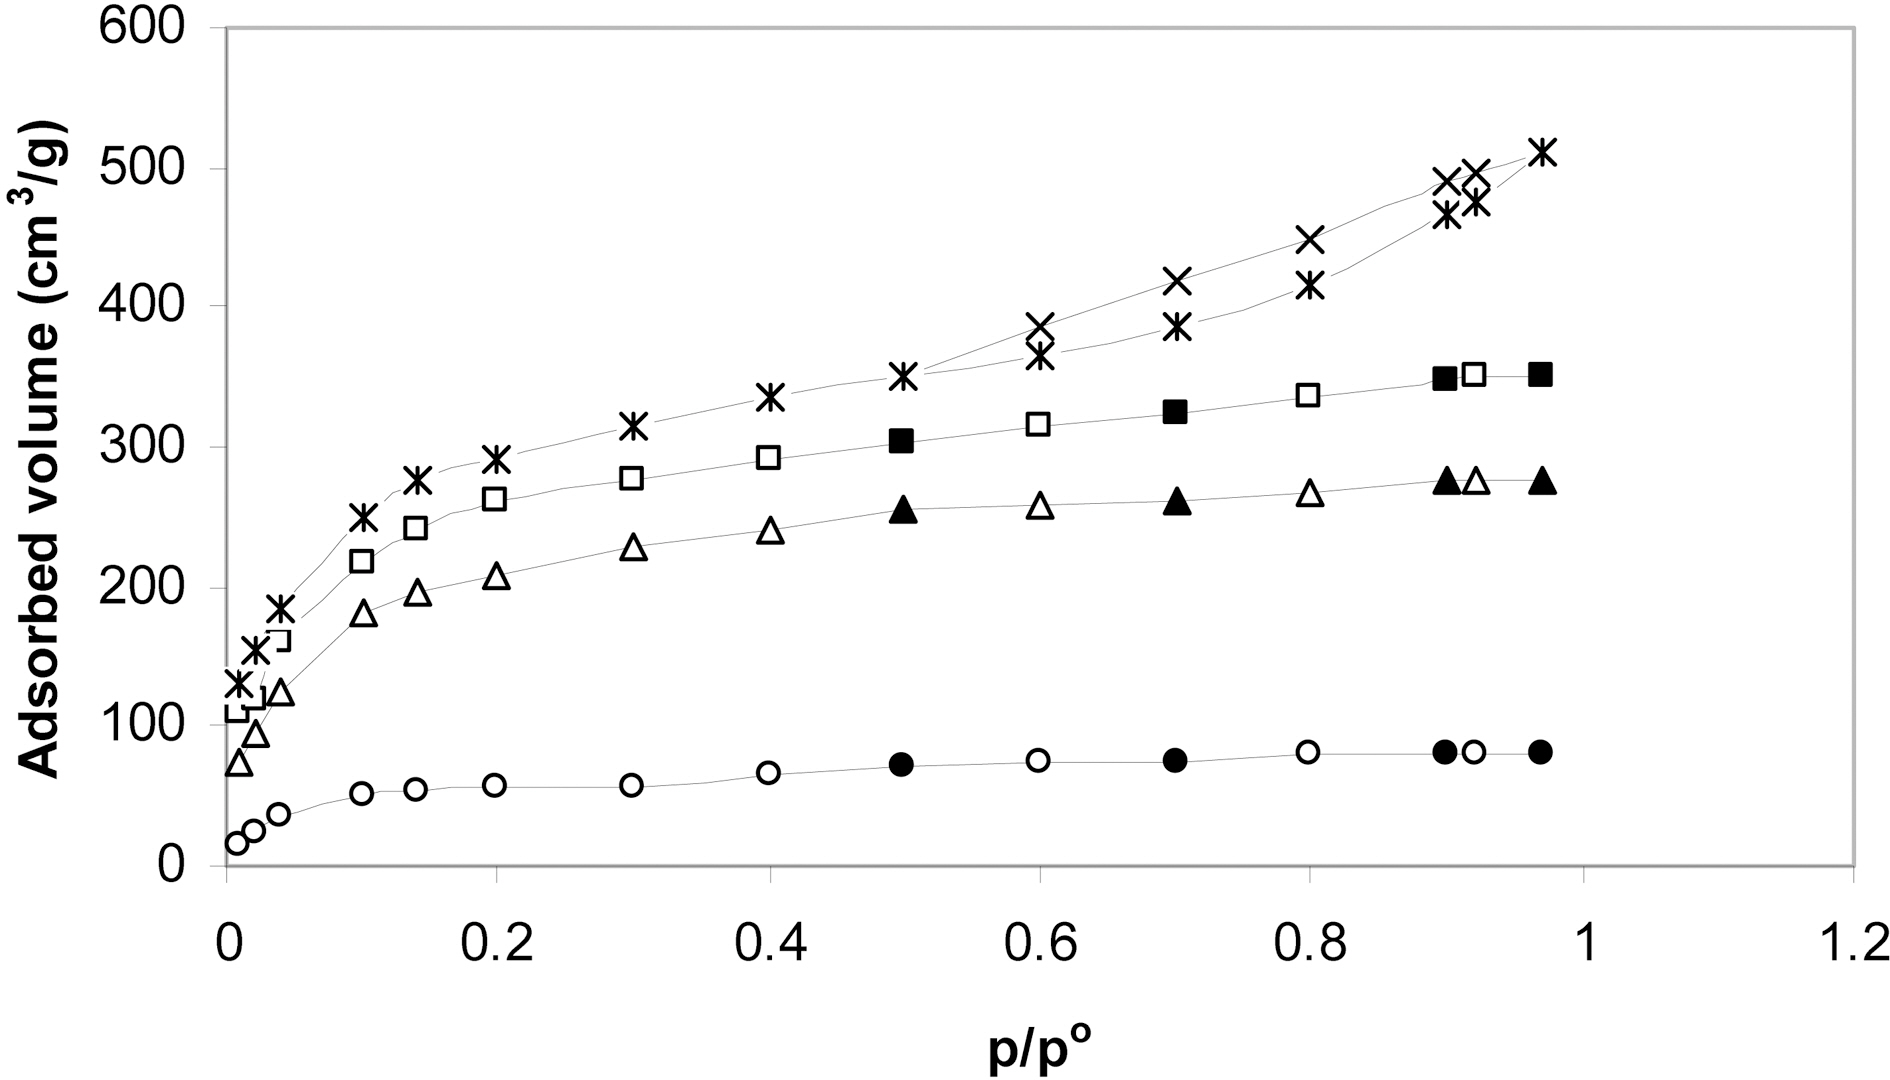
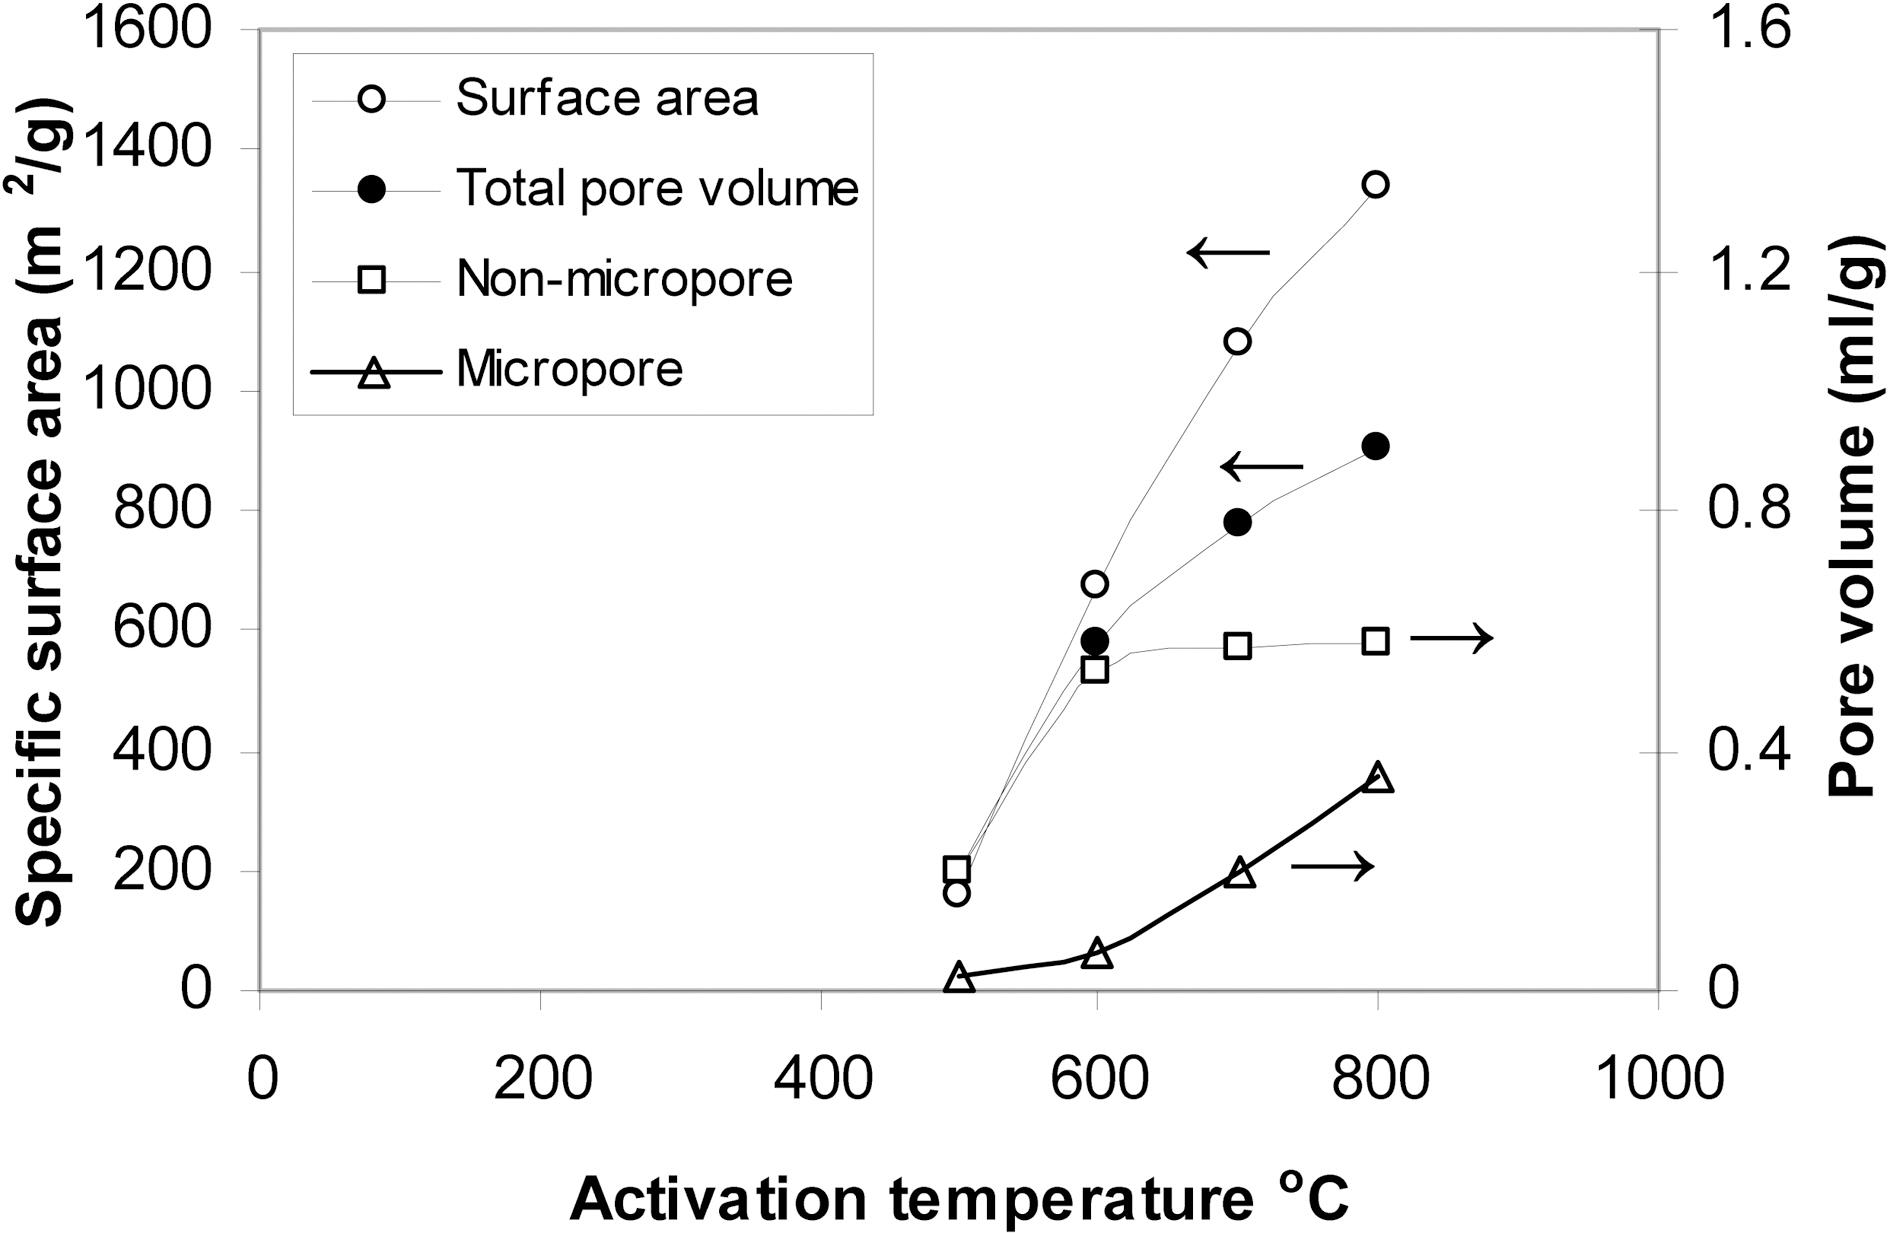
Four KOH-activated carbons containing the same amount of the activating agent were prepared by carbonization at 500, 600, 700 and 800℃. The activated carbons thus obtained were designated P4c5, P4c6, P4c7 and P4c8. Fig. 3 shows the nitrogen adsorption-desorption isotherms. They are all of almost type I isotherms but with a tendency to show characteristics of type IV at p/po ≥ 0.5. Also the isotherms show hysteresis loop above this relative pressure with the area of the hysteresis loop increasing with the rise of the activation temperature. The changes in the textural properties with the change of activation with KOH are
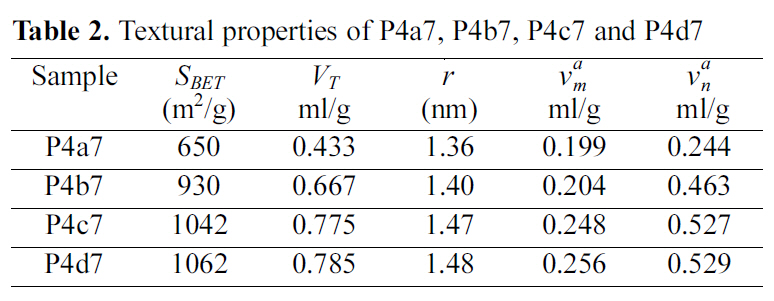
[Table 2.] Textural properties of P4a7 P4b7 P4c7 and P4d7

Textural properties of P4a7 P4b7 P4c7 and P4d7
depicted in Fig. 4. It is shown that SBET increases linearly with the increase of the activation temperature. This means that KOH activation is recommended at temperature as high as 800℃. This is in a good agreement with previously reported data [3]. The micropore volume of P4c5 represents only about 11% of the total pore volume of the sample. For P4C6, vam equal about 14% of VT. The contribution of micropores to the total pore volume is more pronounced for 700℃ and further at 800℃. Thus for P4c7, vam/VT=31% and for P4c8, vam/VT=38%.
At 500℃, some evolved lower hydrocarbons may be trapped within the micropores and may condense during cooling closing thus a fraction of these micropores. The rise of the activation temperature enhances the evolution and diffusion of gaseous carbonaceous products leaving behind well developed microporous structure.
3.3. Effect of activation time
Chemical activation involves carbonization of impregnating the raw carbonaceous material with the activating agent at a certain carbonization temperature. In the course of carbonization the impregnated raw material is heated from room temperature at a heating rate usually 10℃/min to reach the carbonization at which the material is soaked for a certain time known as the activation time.
In the present investigation samples of KOH / Petroleum coke weight ratio=4 were soaked at 700℃ for 1, 2, 3 and 4 h to give samples P4a7, P4b7, P4c7, and P4d7 respectively.
The textural properties of these samples as determined from their nitrogen adsorption data are listed in Table 2.
Table 2 reveals that increasing the activation time from one hour to four hours is always associated by an increase in all the textural parameters, i.e increase in the SBET, VT, vam, van, and r. However, the increase in the textural parameters is more pronounced upon increasing the activation time from 1 to 2 h, the increase in the textural parameter with the further increase of activation time from 2 to 3 h is less pronounced. Negligible increase in all textural parameter is noticed when the activation time increases from 3 to 4 h. For example an increase of SBET of about 43% with the increase of activation time from 1 to 2 h, the increase of SBET with the increase of activation time from 2 to 3 h amounts only to about 12%. Only an increase of 1.9% was determined upon increasing the activation time from 3 to 4 h. The increase of the values of the other textural parameters seems to be less pronounced. This indicates that activation for 3 h is quite sufficient to remove completely the volatile matter and the removal of the corresponding salts from the internal volume of the activated carbon.
Based on these results one can suggest that soaking the KOH- impregnated carbonaceous precursor at 700~800℃ for 3 h is quite sufficient to produce highly activated carbons with expanded surface area and well developed pore structure.
3.4. Adsorption of iodine from aqueous KI solution
The maximum sorption capacity of activated carbons from solutions is very important because it determines its practical applications in many industrial and environmental sectors. The adsorption of iodine from aqueous solution by an activated carbon may be considered as criterion to its potential for the adsorption from solution.
In the present investigation, the adsorption of iodine at 30℃ was followed on P4c5, P4c6, P4c7 to determine the effect of activation temperature and on P1c7, P2c7, and P4c7
to determine the effect of the amount of the activating agent.
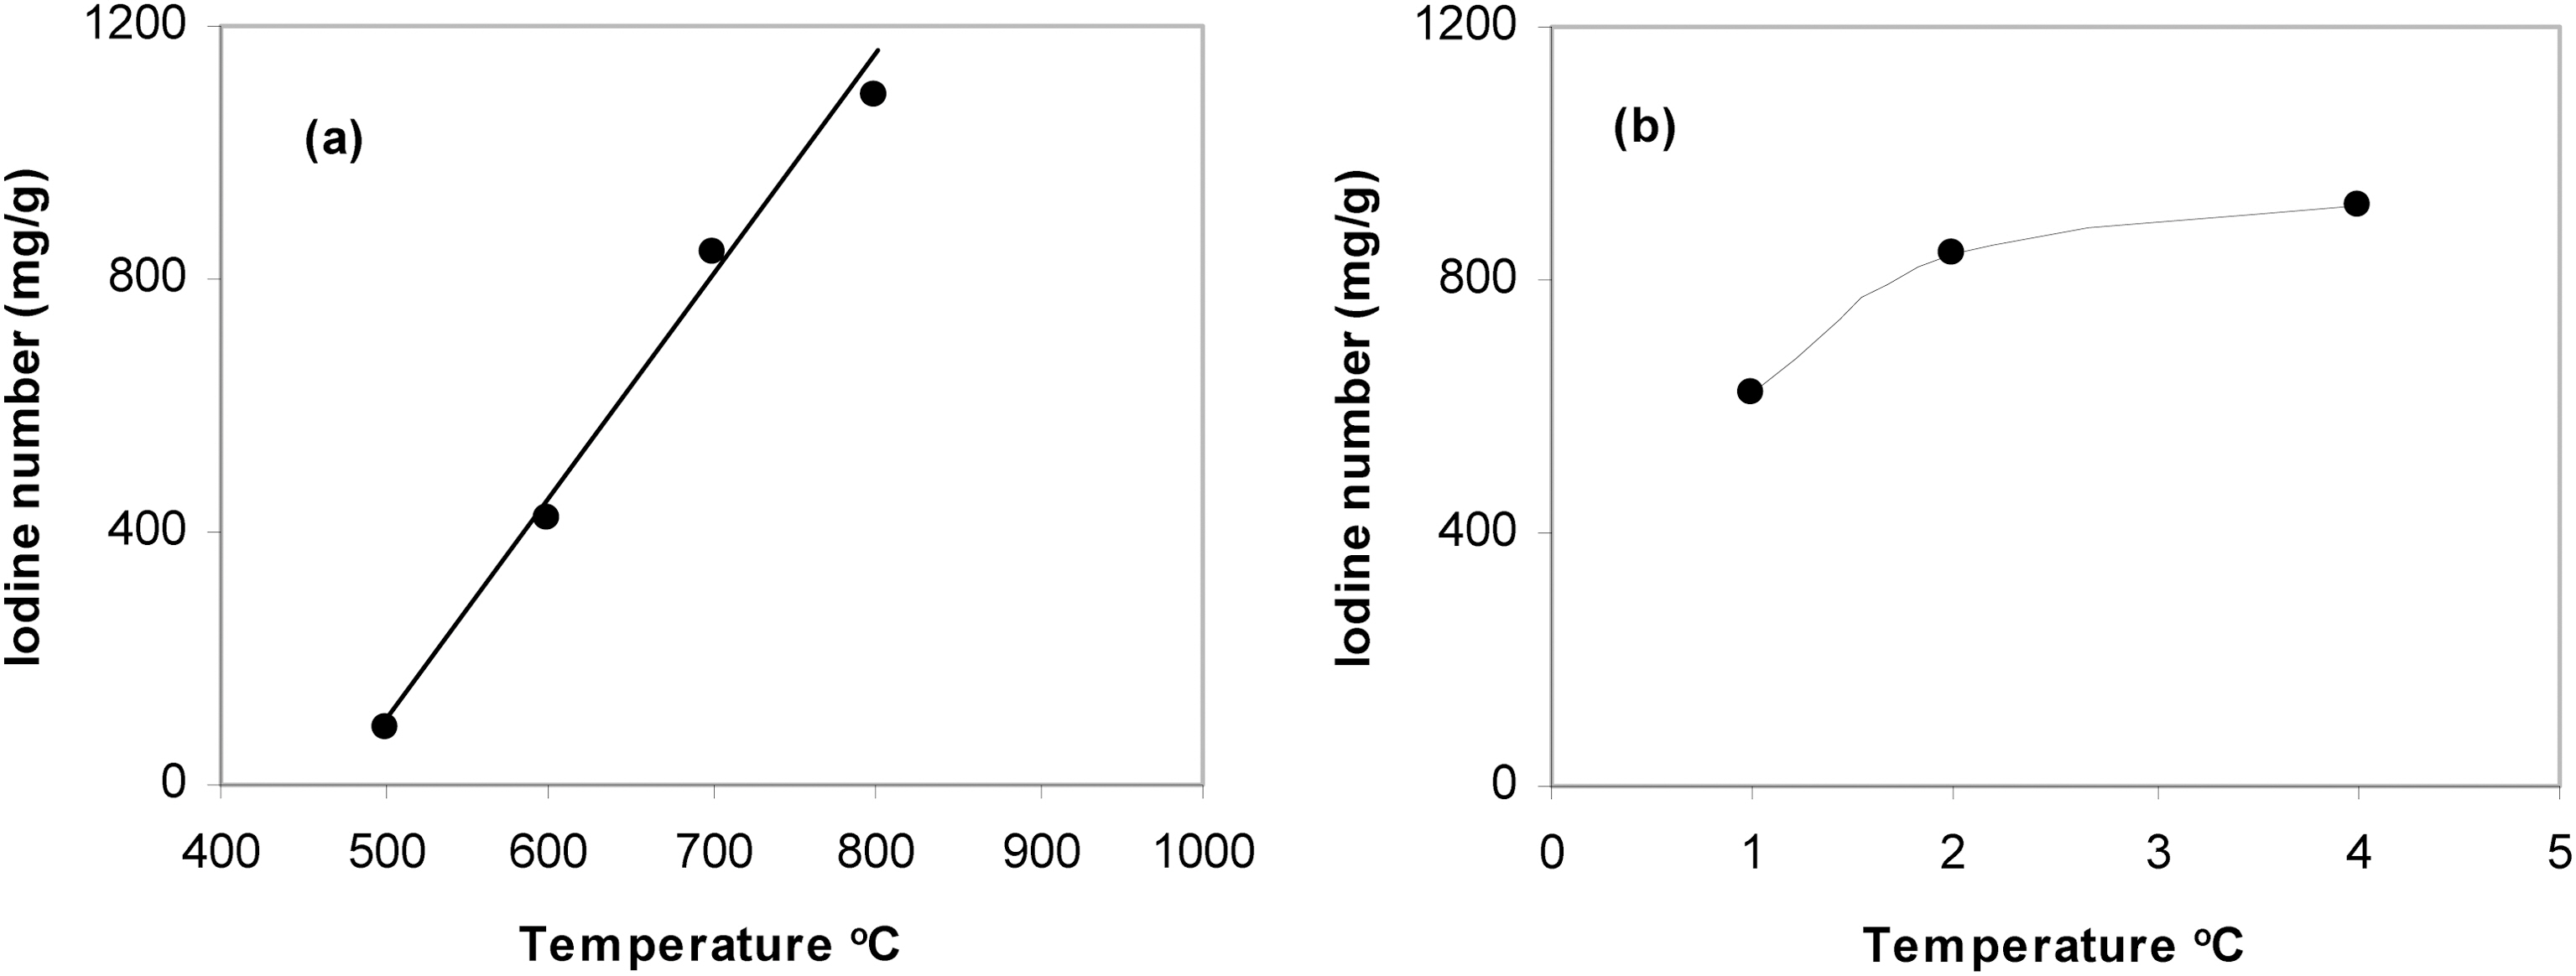
Fig. 5a shows the effect of activation temperature on iodine sorption capacity expressed as iodine number (mg/g) and Fig. 5b shows the effect of KOH/ petroleum coke weight ratio. Fig. 5a shows a satisfactory linear relationship between the iodine number and the activation temperature. It has been previously mentioned in this paper that the rise of the activation temperature from 500 to 800℃ is always associated with a continuous increase in all the textural properties. This may indicate that the changes in the textural properties in general and surface area in particular of activated carbons could be followed from the changes of their capacity towards iodine adsorption. Fig. 5b shows also that the iodine adsorption capacity increases with the increase of KOH/coke ratio, i.e. the same trend observed with the change in SBET values measured by nitrogen adsorption. To summarize one can suggest that iodine sorption besides measuring the capacity of activated carbons for sorption from solution; it can also be used as a criterion for textural characterization of these carbons.
3.5. Methylene blue adsorption
The adsorption from solution depends to great extent on the time of equilibration between the solid sorbent and the solution. For this reason the determination of the equilibrium time for the adsorption from solution is of prime importance. The kinetics of adsorption allows the construction of a kinetic curve which shows the variation of the amount of the adsorbate uptake with time. The equilibrium time is expected to be at or after the plateau exhibited by the kinetic curve.
3.5.1. Kinetics of methylene blue adsorption
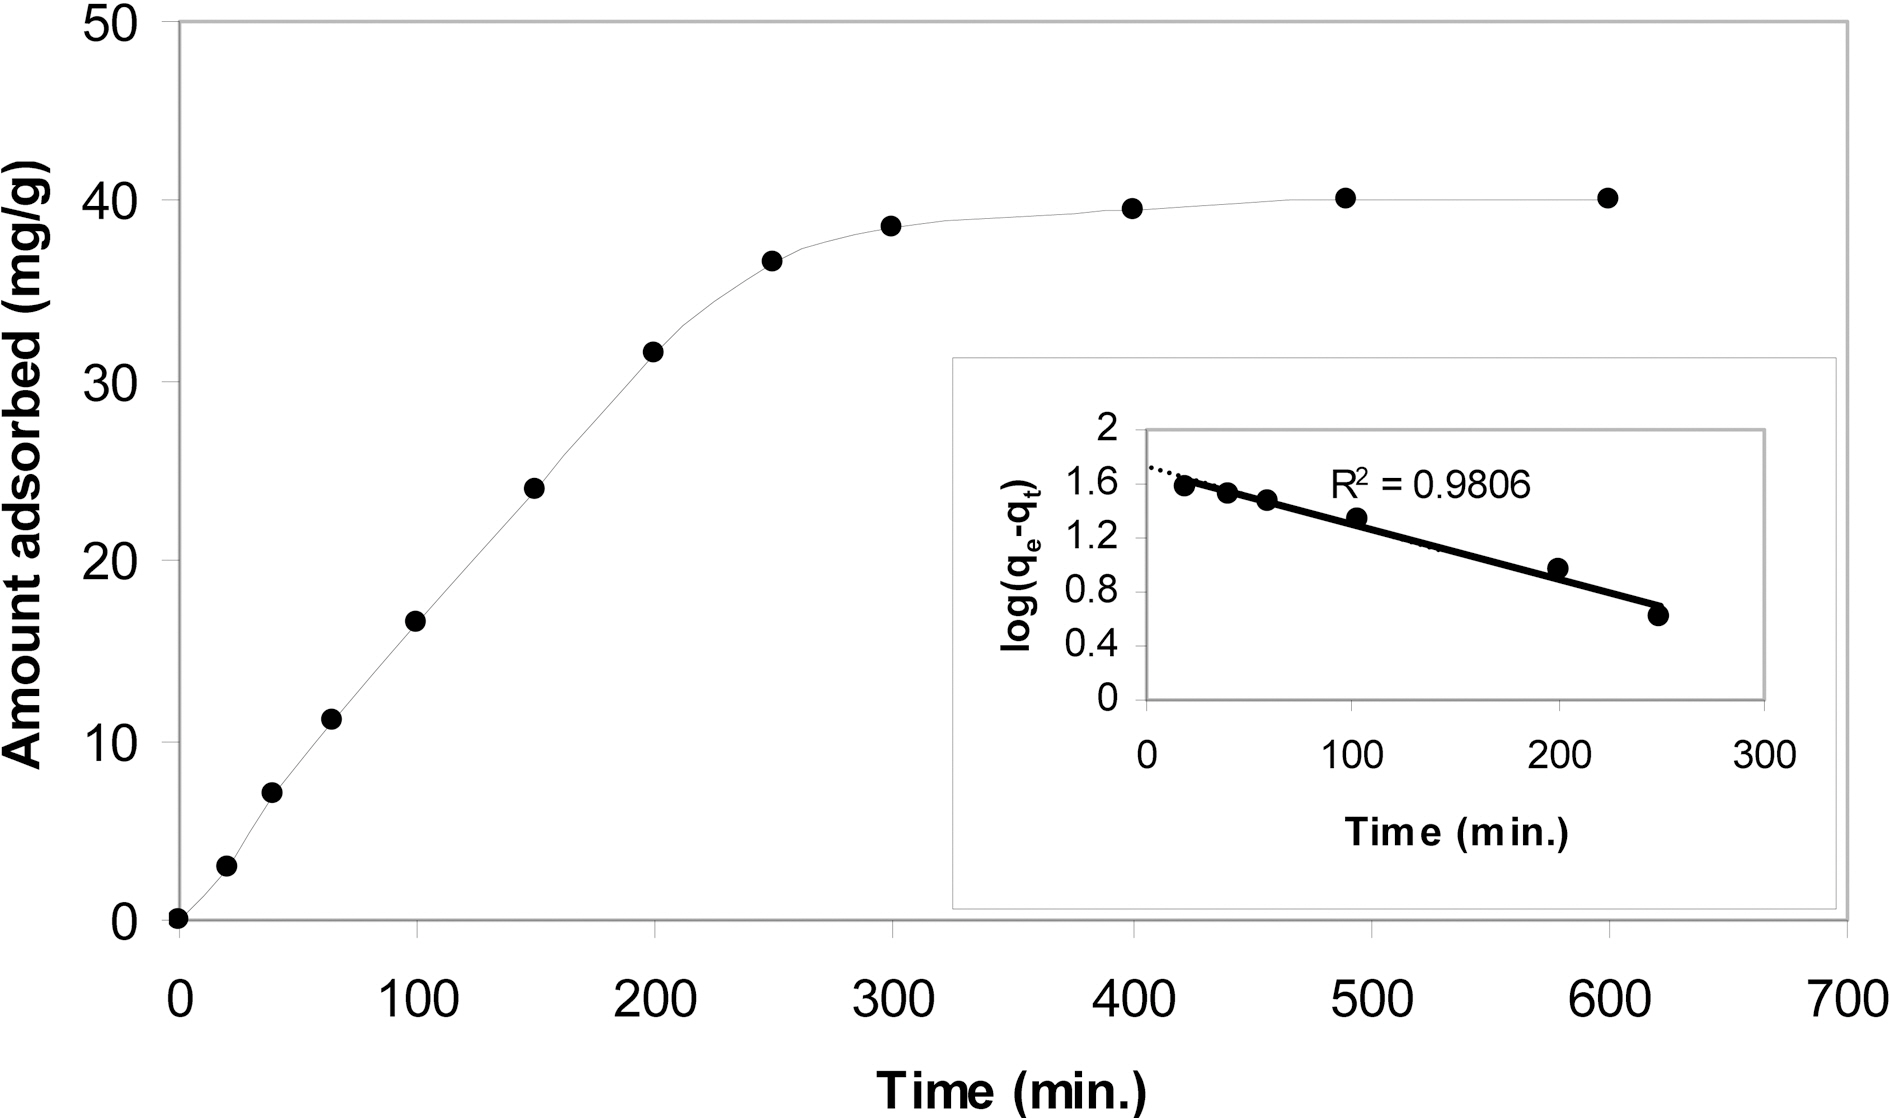
Fig. 6 shows the kinetic isotherm of methylene blue onto P4c7. In the initial stages, i.e. up to an equilibration time ≤ 250 min., a straight line passing through the origin is shown indicating thus that sorption of MB follows pseudo-
pseudofirst-order kinetics. Beyond equilibration time of 250 min, a tendency to a plateau with a very small slope is exhibited. This plateau indicates that equilibrium adsorption of MB requires more than 4 h to be attained. However, in order to have equilibrium adsorption isotherms an equilibrium time of say 12 h should be allowed to ensure equilibrium conditions. The pseudo-first order kinetic equation:
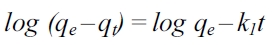
Where qe is the equilibrium adsorption capacity and qt is the amount adsorbed at time t and K1 is the adsorption rate constant (min-1). Evidently, the value of qe read from the intercept to be 43.65 mg/g and the value of K1 as determined from the slope of the straight line was calculated to be 2.5 ×10⁻³ min-1.
3.5.2. Equilibrium adsorption of methylene blue
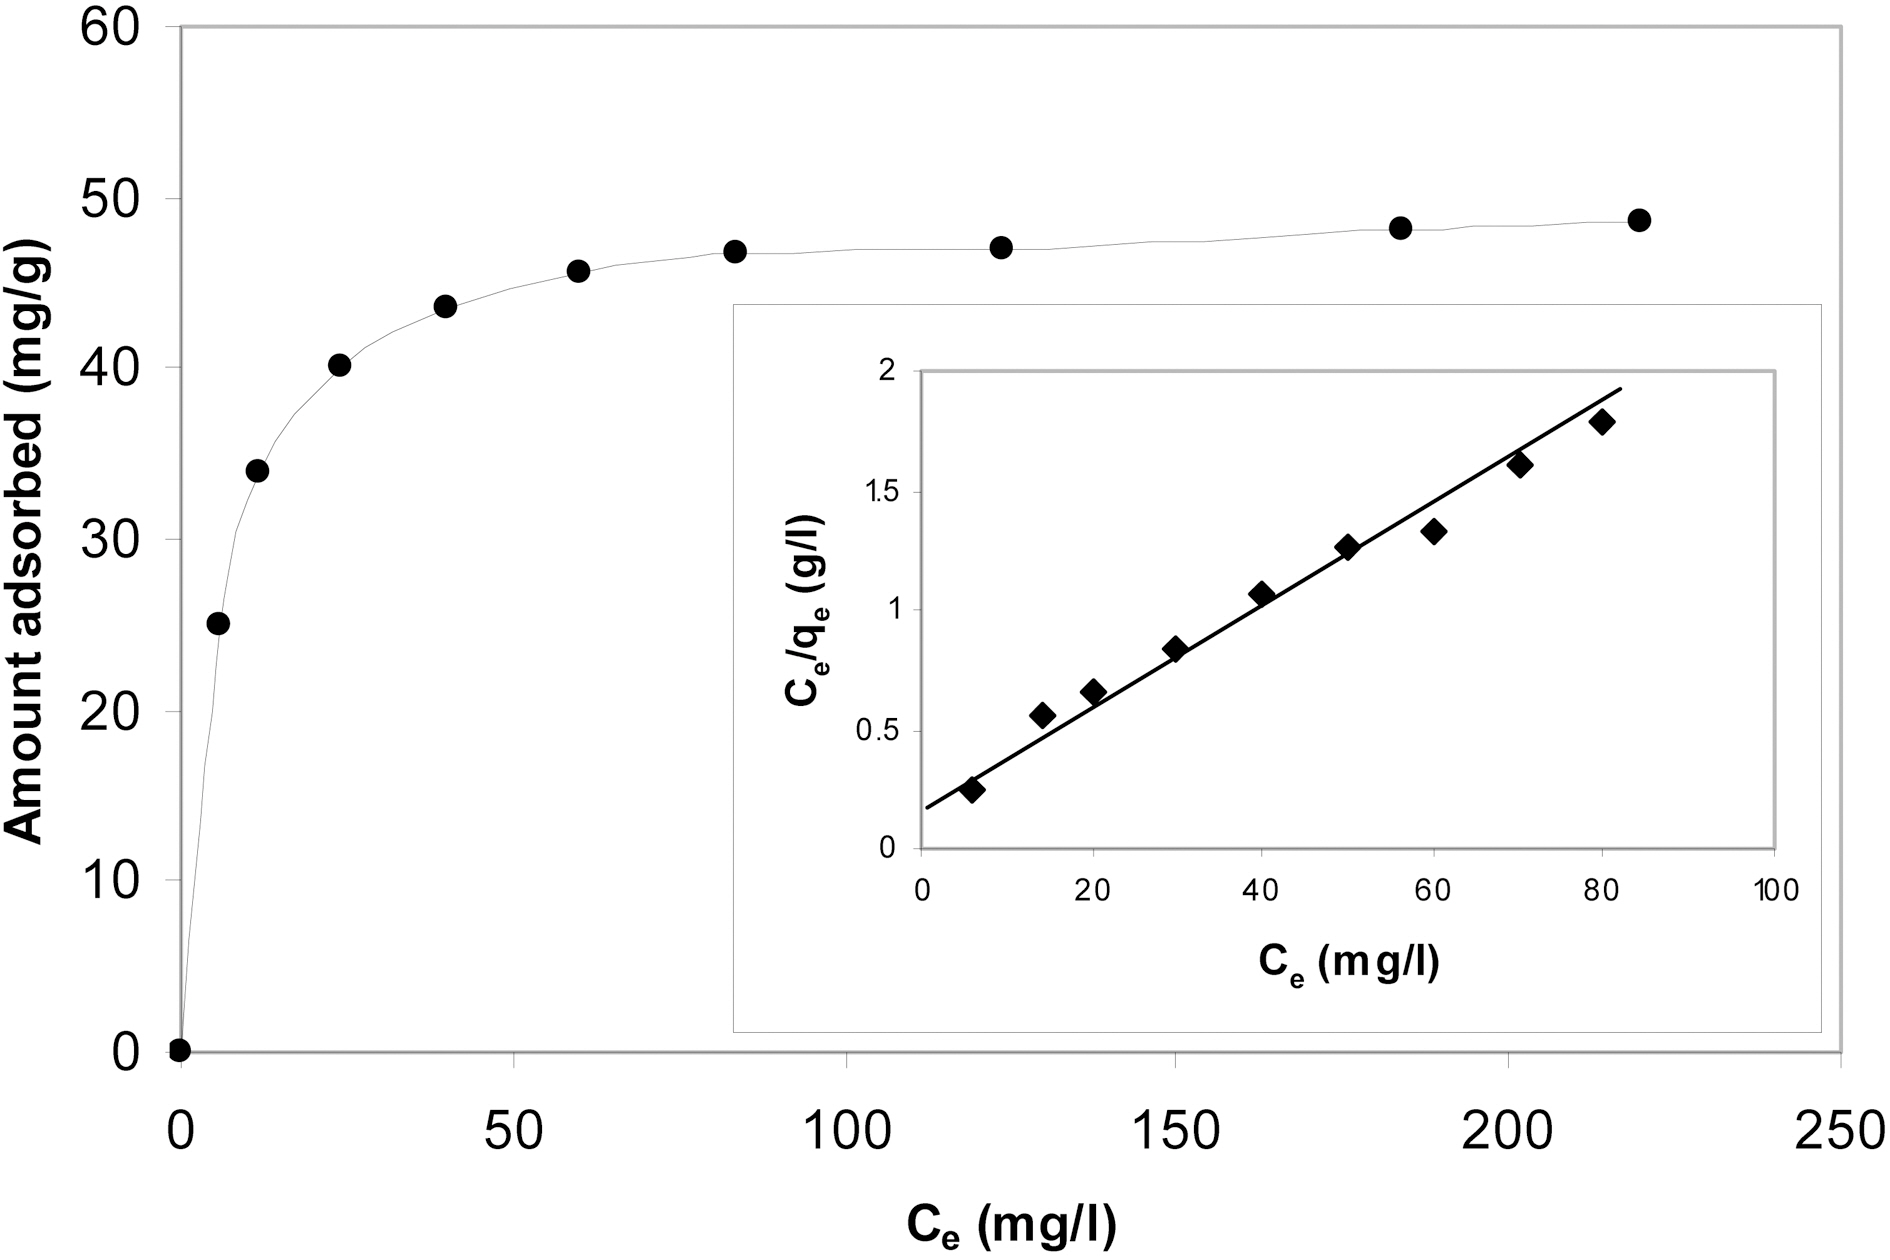
The equilibrium adsorption isotherm of methylene blue at 30℃ onto P4c7 is shown in Fig. 7. A contact time of 12 h was allowed to ensure equilibrium condition. The isotherm exhibits very initial steep portion followed by a plateau covering a wide range of equilibrium concentration. The Langmuir equation was applied to analyze the equilibrium adsorption data of MB onto P4c7. The inset of Fig. 7 shows the linear Langmuir plot of the isotherm. The data gave a good straight line with R2 =0.98. The maximum adsorption capacity qmax was calculated to be 53.03 mg/g and Langmuir constant B was determined to be 0.067(l/mg).
Another independent model was also applied to the equilibrium adsorption data of MB onto P4c7. This model adopted by Dubinin and Radushkevich (D-R) model [26] assumes that only a small fraction of the surface is uniform in structure and energetically homogeneous.
The D-R equation is given as
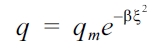
where q is the amount adsorbed at the equilibrium concentration Ce, qm, is the maximum amount adsorbed and can be called the adsorption capacity, β is a constant related to the energy and ξ, the potential energy of the surface which equals RT ln(1+1/Ce), where R is the gas constant (kJ/mol K), T is the absolute temperature. The D-R equation can be written as
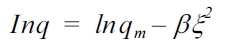
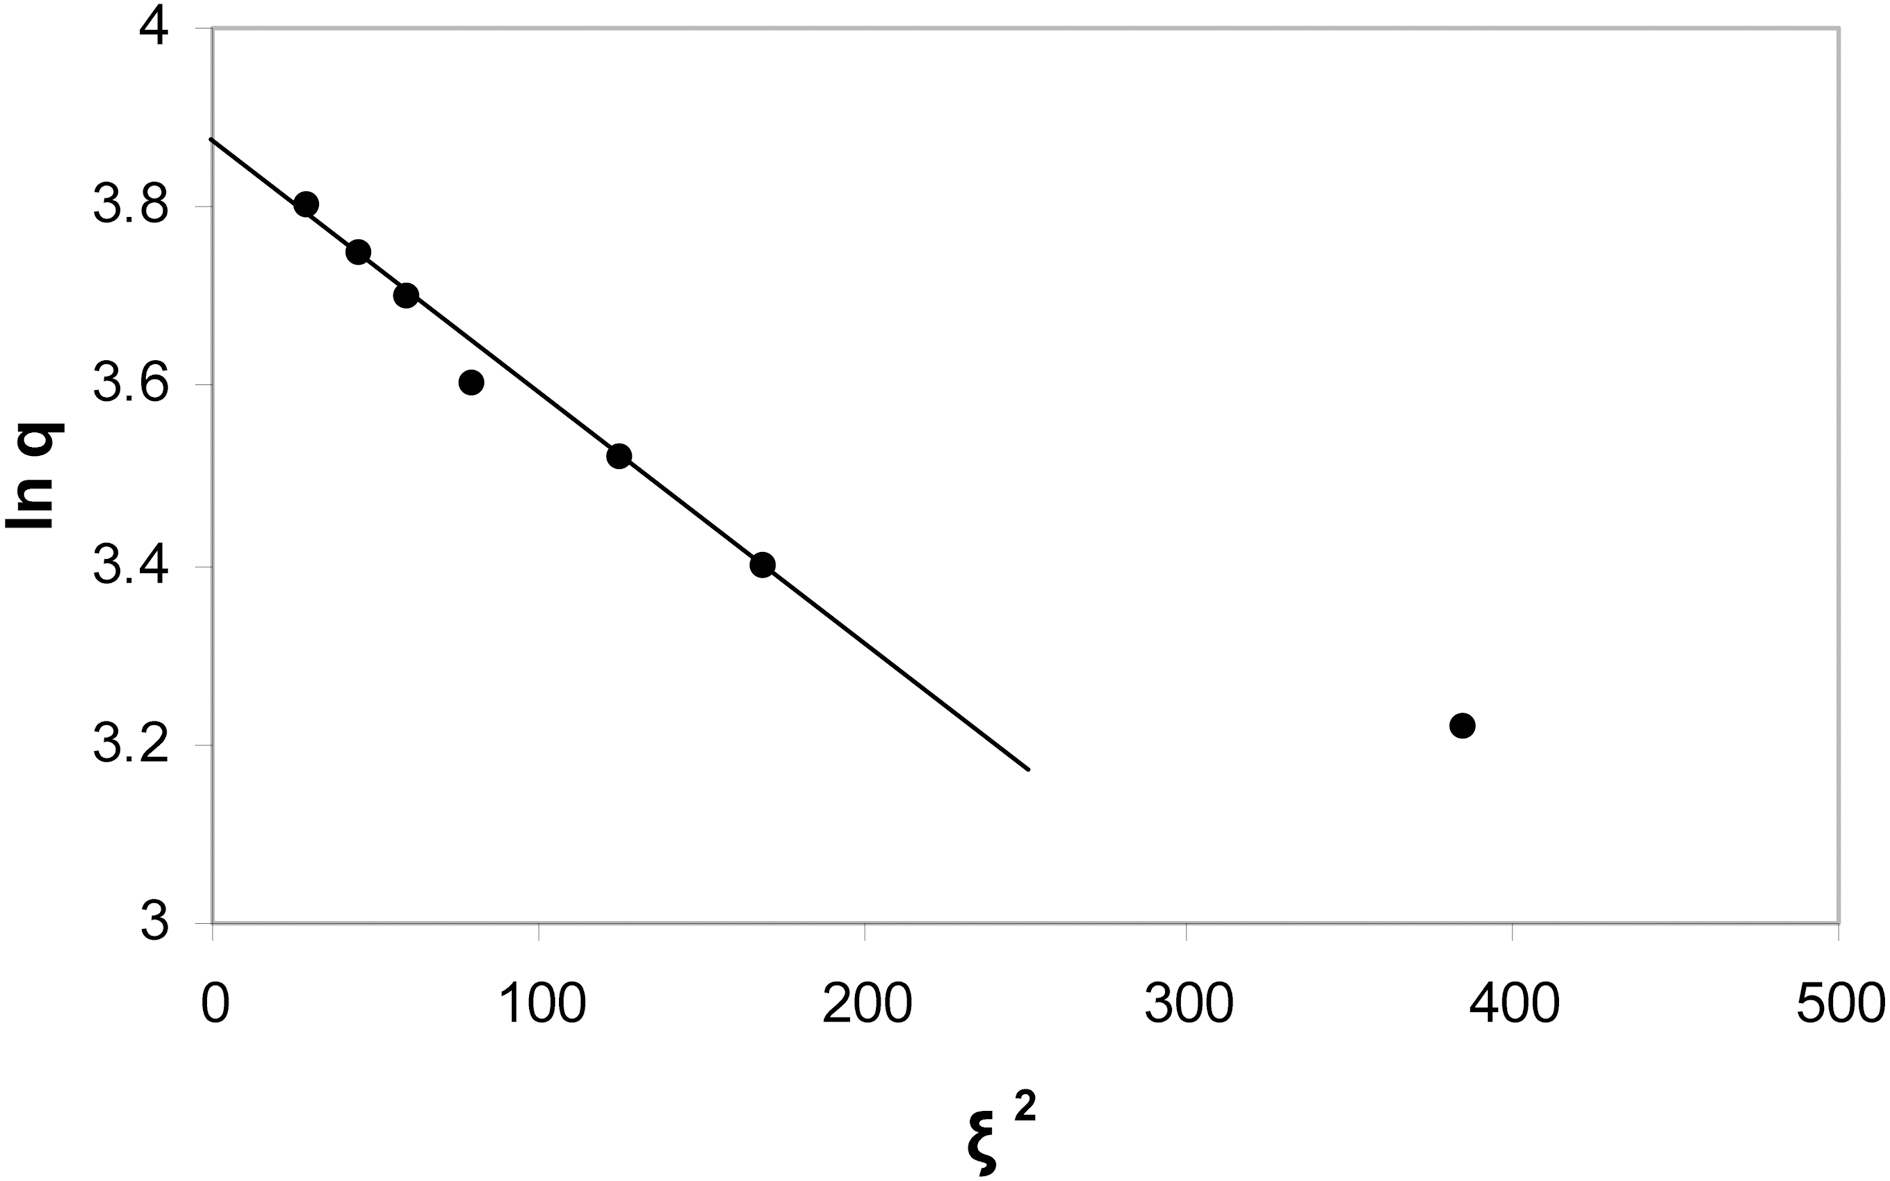
A plot of lnq versus ξ2 gave a straight line as shown in Fig. 8. The values of qm and β were obtained from the intercept and slope of the straight line to be 50.6 mg/g and 0.0025(mol2/kJ2), respectively. The sorption energy Ea (kJ/mol) can be obtained from the relationship
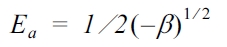
The calculated value of Ea was 2.98 kJ mol-1. The qm value as determined from the D-R model is about 5% lower than that calculated from the Langmuir model. The qm determined from Langmuir model is always located at some point beyond the whole range of the adsorption isotherm, for this reason it is better called the maximum adsorption capacity qm from the Langmuir model may be considered as the monolayer capacity when the plateau of the isotherm does not exhibit any rising with the increase of the equilibrium concentration, the D-R model on the other hand,consider only sorption point of the isotherm preceding the plateau of the isotherm and therefore the qm determined from D-R model is of more significance [27]. The value of Ea indicates that the adsorption of MB onto KOH- activated carbons is a physical type in which sorbent-sorbate interaction involves physical forces, i.e. dispersion or van der waal's forces.
I. The surface area and non-microporisty increased whereas the micropore volume decreased with the increased of KOH/coke ratio.
II. The increase of activation temperature increased the surface area and porosity. Activation for 3 h was quite sufficient to develop the texture of the KOH-activated carbon.
III. The adsorption for iodine at 30C changes with KOH/coke ratio and activation temperature in a manner similar to that exhibited by nitrogen adsorption.
IV. Methylene blue adsorption follows pseudo-first-order kinetics and its equilibrium adsorption isotherms fitted both Langmuir and D-R models. The latter model allowed the determination of the activation energy of the adsorption.