The removal from aquatic systems of color caused by the presence of synthetic dyes that usually contains azo-aromatic groups is extremely important from an environmental point of view because most of these dyes are toxic, mutagenic and carcinogenic [1,2]. Colored water is objectionable on aesthetic grounds for drinking purposes and other uses. Additionally, the presence of dye in natural water systems inhibits sunlight diffusion into the water, consequently reducing the photosynthesis process of aquatic plants [3]. Therefore, it is very important to develop new systems that can be used for removing dyes from water. The structure of these synthetic dyes provides them physico-chemical, thermal and optical stability [4,5]. Dyes and pigments represent problematic groups; they are emitted into wastewater from industrial branches, mainly from the dye manufacturing, textile finishing [6], cosmetics, paper and carpet industries. Congo red (CR) [1-naphthalene sulfonic acid, 3, 3?- 4, 4?-biphenylenebis (azo) bis (4-amino-) disodium salt] is a benzidine-based anionic disazo-dye. This dye is known to metabolize to benzidine, a known human carcinogen. CR dye is difficult to biodegrade. Some procedures can be used for treating water containing dyes, for instance, coagulation and flotation [7], ozonization [8,9], membrane separation[10] and adsorption by activated carbon [11]. Granular activated carbon is the most popular adsorbent and has been used with great success [12]. Among the available methods for removing these pollutants, adsorption is still one of the most preferred methods, especially for effluents with moderate to low pollutant concentrations [13]; also, adsorbent?grade activated carbon is cost-prohibitive and both regeneration and disposal of the used carbon are often very difficult. Consequently, many investigators have studied the feasibility of using low cost substances for the treatment of wastewater. Utilization of industrial solid wastes for the treatment of wastewater from another industry could be helpful not only for the environment in terms of solving the solid waste disposal problem, but also to the economy.
Bagasse ash is one of several biomass sources and valuable byproducts in sugar milling, which industry often uses bagasse as a primary fuel source to supply all the needs of energy to power the plants. It is well known that bagasse ash is an alternative source of energy with high silica content [14,15]. The sugar industry is one of the most important agricultural?based industries in Egypt. Bagasse fly ash (BFA), a waste generated by the sugar industry, causes a disposal problem as it accumulates in huge amounts. Currently this waste is being used as filler in building materials. Several studies have investigated BFA for potential applications such as producing silica gel as adsorbent, as a raw material for ceramics, cements, concrete additives, catalysts, cosmetics, paints, and coatings [14-16], and for the removal of organics [17], heavy metals [18] and dyes [19].
The presence of various functional groups on the carbon surface depends on the precursor type, activation technique employed in the manufacturing process and surface post-treatment. There are a variety of oxidative treatments designed to produce activated carbons with different distribution levels of oxygen containing groups. In the liquid phase, the most familiar oxidation media include nitric acid, perchloric acid, potassium permanganate, hydrogen peroxide, and potassium persulphate [20].
The main object of this work is to explore the possibility of utilizing BFA for the adsorptive removal of CR as acidic dye from aqueous solution. Two samples were prepared, one raw (BFA) and a second sample of BFA that was treated with 60% H2O2 (v/v) in order to modify and enhance the active sites on the surface of the precursor that affects the adsorption process. The effects of factors such as the initial pH of the dye solution (pHo), the adsorbent dose (m), the contact time (t) and the temperature (T) were investigated. Equilibrium isotherms for the adsorption of CR were analyzed by Langmuir, Freundlich and Temkin models using nonlinear regression technique. The kinetics of the CR dye adsorption onto BFA was analyzed by fitting various kinetic models. Error analysis was carried out to test the adequacy and the accuracy of the model equations. The thermodynamics of the adsorption process have been studied and the changes in Gibbs free energy, enthalpy and entropy of adsorption have also been determined.
BFA was collected as a by-product of incineration in the generation of steam in boilers at around 523 K. It was kindly supplied by the sugar and integrated industries from a local sugar company in the Kom?Umbo district (42 km to the north of the midaty of Aswan in Egypt). The samples were treated by the following methods. First, the raw sample (BFA) and the second sample were treated with excess hydrogen peroxide 60% (v/v)at 60℃ for 24 h until the evolution of bubbles stopped. This indicated the complete oxidation of the adhering organic matter. The resulting product was then washed with distilled water and dried at 100℃ for 24 h; product was denoted BFA-H2O2. Finally, the product was stored in a vacuum desiccator.
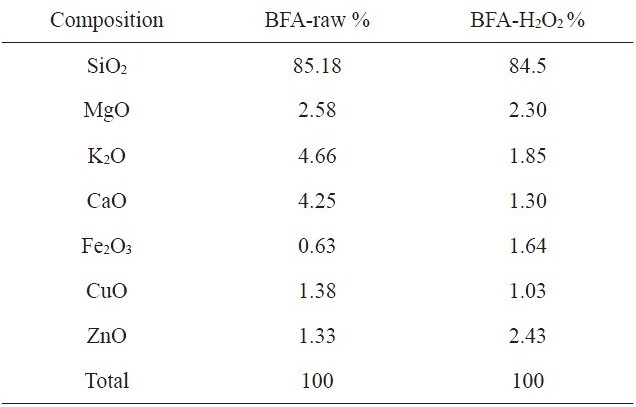
[Table 1.] Chemical composition of raw BFA and BFA-H2O2 from EDX analysis

Chemical composition of raw BFA and BFA-H2O2 from EDX analysis
[Table 2.] Physico-chemical characteristics of BFA and BFA-H2O2
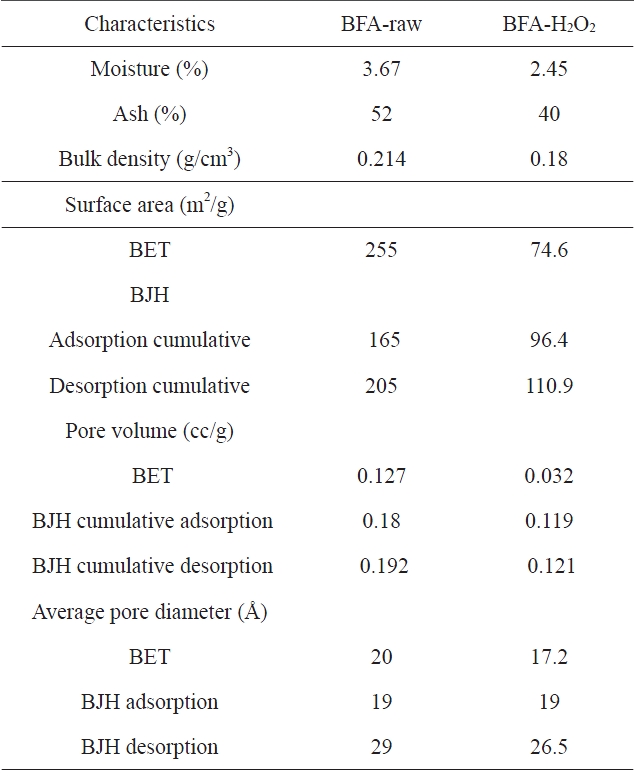
Physico-chemical characteristics of BFA and BFA-H2O2
2.2 Characterization of fly ashes
The Fourier-transform infrared spectrometer (FT-IR) spectra were obtained on a Perkin-Elmer Model 180 Spectrometer(USA), within the range of 4000-500 cm?1, using a 1.5 mg sample mixed with 200 mg of KBr. Samples were pressed into a thin transparent tablet. Energy-dispersive X-ray spectrophotometer analysis was performed using a JEOL-JSM 5410 ISIS (Oxford) to determine constituent elements in both adsorbents. The chemical compositions of these two samples of BFA and BFA-H2O2
are given in Table 1. The physico-chemical characteristics of the samples are given in Table 2. The specific surface area (BET) and the pore diameter of the samples were measured by Quantachrome Nova Automated N2 gas adsorption at 77 K.
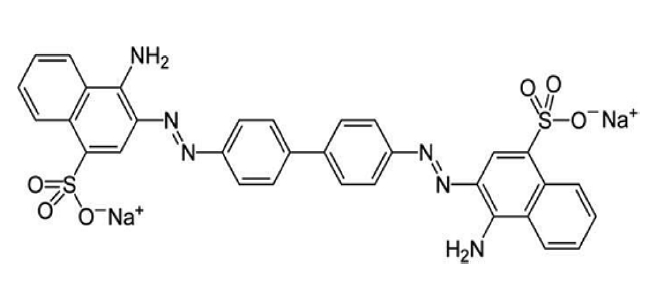
The adsorbate CR dye [C.I. = 22120, chemical formula =C32H22N6Na2O6S2, formula weight = 696.7, λmax = 496.5] was supplied by Sigma Chemical Company, USA. The chemical structure of CR dye is illustrated in Fig. 1 [21]. An accurately weighed quantity of the dye was dissolved in distilled water to prepare stock solution (500 mg/L). Initial concentrations of CR dye were determined by finding out the absorbance at the characteristic wavelength using a double beam UV/Vis spectrophotometer (Shimadzu Model PC-2401; Japan).
Batch studies were conducted at room temperature of 308 K to determine the equilibrium adsorption isotherms. In the adsorption experiment, the weighed quantity of adsorbent was taken in a standard-stoppered reagent bottle (250 mL) containing 100 mL of CR dye solution. The pH of the dye-adsorbent system was adjusted to the desired value and the mixture was shaken for a predetermined period using a horizontal shaker operated at 100 rpm. The kinetics of adsorption was determined by analyzing the adsorptive uptake of the dye color at different time intervals. Independent bottles containing 100 mL dye sample concentration (10-100 mg/L) with a known amount of adsorbent (0.5 g) were used during the batch studies to obtain accurate results for each point on the graph. After adsorption was over, the mixture was rapidly centrifuged in a laboratory centrifuge at 500 rpm for 30 min. To obtain the optimum amount of adsorbent per unit mass of the adsorbate, 100 ml of dye solution was put in contact with different amounts of BFA (0.1-2 g/100 mL) until equilibrium was reached. The effect of pH on the dye removal was studied by adjusting the pH of the dye solution to different values (3.0-12) and analyzing the residual color after the equilibrium contact time. The pH was adjusted by the addition of a dilute aqueous solution of HCl or NaOH (0.1 M). The effects of temperature on the sorption properties were investigated at different temperatures (308, 318 and 333 K) by fixing the pH, carbon dose and equilibrium time. The residual dye color in the reaction mixture was analyzed by centrifuging the reaction mixture and then measuring the absorbance of the supernatant at the wavelength that corresponded to the maximum absorbance of the sample. Dye concentrations in the reaction mixture were calculated from the calibration curve. The λmax values of the wastewater samples varied ±10 nm from the λmax values of pure dyes at fixed pH. The amount of dye adsorbed onto the adsorbents, qe (mg/g), was calculated by the following mass balance relationship:

where Co and Ce are the initial and equilibrium liquid-phase concentrations of the CR dye, respectively (mg/L), V is the volume of the solution (L), and m is the weight of the carbon used (g).
3.1 Characterization of the adsorbents
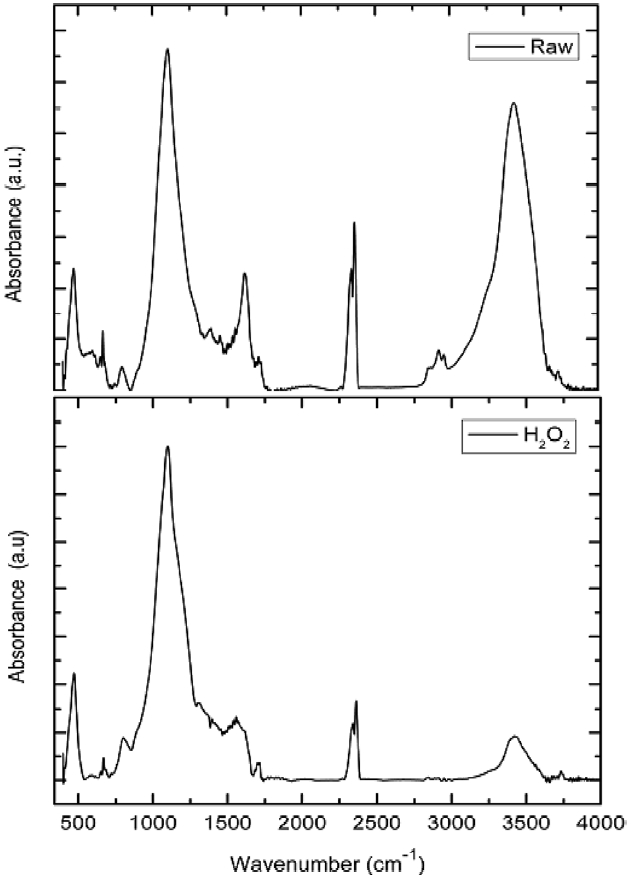
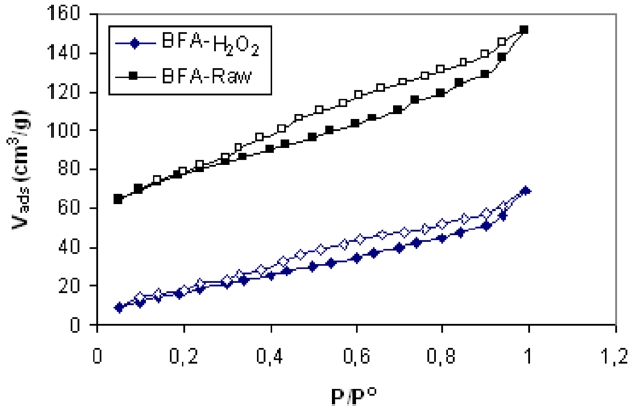
The chemical compositions of the investigated adsorbents are presented in Table 1. Inspection of Table 1 reveals that the most abundant chemical compound in BFA is silica, with some MgO, K2O and CaO, and with a variation between the percentage of CuO and ZnO. This may be ascribed to the wet oxidation of the BFA. The physico-chemical characteristics of the two samples are listed in Table 2. The results reveal that the treatment with H2O2 reduced the BET surface area and total pore volume by 70.5% and 74.8%, respectively; for this we postulate partial or complete blockage of the porous structure within BFA, caused by H2O2 oxidation. Another reason is that during wet oxidation treatment, some of the inorganic salts (mainly oxides or carbonate) are dissolved and diffused inside the available pores; consequently, this leads to a decrease in the total surface area and total pore volume. Meanwhile, the average pore diameter was not significantly affected [22,23]. Fig. 2 shows the N2-adsorption at 77 K isotherms for the BFA tested. The plot indicates the heterogeneous nature of the porosity. Fig. 3 shows the FT-IR spectrum in the range 4000-400 cm-1 for BFA-raw in comparison with BFA-H2O2. The very sharp absorption band is centered between 3440-3430 cm-1; this band is assigned to absorbed water bonding and Si-OH [24]. The peak at 471 cm-1 is assigned to Si-O bending [24]. On the other hand, the absorption bands at 1090-1103 cm-1 are due to vibration in symmetric and asymmetric ← OT→ ← O stretching
(T= Si) functional groups in tetrahedral arrangement [24]. The band centered in the range of 2300-2360 cm?1 is assigned to silicon hybrid (Si?H) stretching [25]. Weak absorption bands at 1729-1690 cm?1 are assigned to the C=O stretching vibrations of ketones, aldehydes or carboxyl groups. Finally, absorption bands ranging from 2900-2930 cm?1 are due to aliphatic symmetric and asymmetric stretching of ?CH, ?CH2, and ?CH3 bands [26]. It can be observed from Fig. 2 that the intensity of the peaks of Si?OH (3434 cm?1), Si-H (2360 cm?1) and C=O (1690 cm?1) decreased upon treatment by H2O2. Also, the weak aliphatic (2927 cm?1) absorption band disappeared completely through the wet oxidation treatment. This observation confirms that the major constituent in BFA is SiO2 and also confirms the decrease in the quartz form of SiO2 with wet oxidation. This influences the adsorption capacity of BFA toward hazardous materials (CR dye).
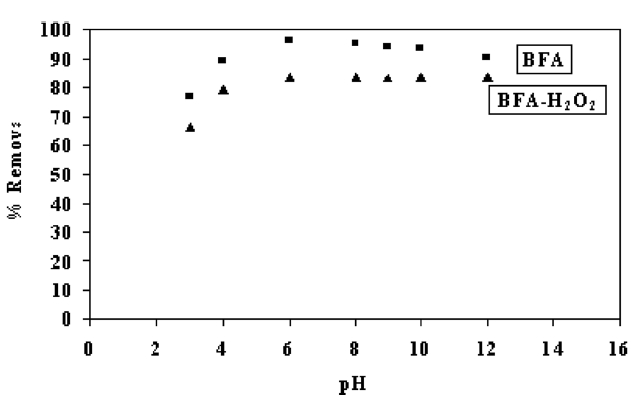
The pH of the dye solution influences the surface charge of the adsorbents as well as the degree of ionization and speciation of different pollutants [27]. Change in pH affects the adsorptive process through dissociation of functional groups on the adsorbent surface active sites. This subsequently leads to a shift in the reaction kinetics and equilibrium characteristics of the adsorption process. The adsorption of various anionic and cationic species on such adsorbents has been explained on the basis of the
competitive adsorption of H+ and OH? ions with the adsorbate [28]. It is a common observation that the surface adsorbs anions favorably at lower pH due to the presence of H+ ions, whereas the surface is active for the adsorption of cations at higher pH due adsorption of OH? ions [29]. Fig. 4 shows the effect of pH on the percent removal of CR by BFA. At pH ranging from 2 to 6, the percent removal of CR by BFA increased and then decreased with further increase in pH. However, for removal by BFA-H2O2, a similar trend was observed at pH ≤6 and attained constant removal at high pH values. Two possible mechanisms of adsorption of CR on BFA may be ascribed: (a) electrostatic interaction between protonated groups of carbon and acidic dye; (b) the chemical reaction between the adsorbate and the adsorbent. The negatively charged silica sites of the adsorbent are neutralized by H+ ions, thereby reducing the hindrance to diffusion of anionic dye ions. For levels of pH below 6, significantly high electrostatic attraction exists between the positively charged surface of the adsorbent and the anionic dye. As the pH of the system increases, the number of negatively charged sites increases while the number of positively charged sites decreases. The negatively charged surface site on the adsorbent does not favor the adsorption of dye anions due to electrostatic repulsion [29]. Also, at pH >6, the lower adsorption of CR is due to the presence of excess OH- ions competing with the dye anions for the adsorption sites [30].
3.3 Effect of adsorbent dosage
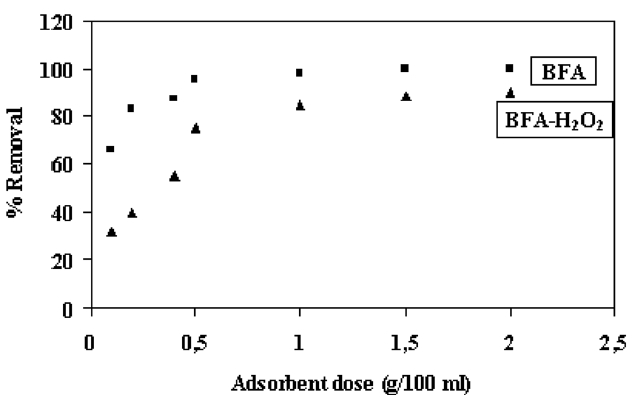
The effect of adsorbent dosage on the removal of CR is shown in Fig. 5. From this figure, it can be seen that the percentage removal increased up to a certain limit and then reached a constant value. The optimum adsorbent dosage from BFA-raw and BFAH2O2 for CR removal was found to be 0.5 g of BFA/100 mL solution. Thus, the increase in adsorption of dye with the adsorbent dosage can be attributed to the greater surface area and the availability of more adsorption sites.
The effect of contact time on the adsorption of CR by the adsorbents was studied for a period of 3 h. It can be demonstrated that a rapid adsorption of dye takes place in the first 20 min and that thereafter the adsorption rate decreases gradually to reach equilibrium in about 3 h. Aggregation of dye molecules with the increase of contact time makes it almost impossible for the dye molecules to diffuse more deeply into the adsorbent structure at the highest energy sites. The adsorption curves were single, smooth and continuous, leading to saturation; this indicates possible monolayer coverage on the surface of adsorbents by the dye molecules [30,31] (Figure not shown).
3.5.1 Pseudo-first-order model
The rate constant of adsorption is determined from the first order rate expression given by the Lagergren equation [29].

where qe and qt are the amounts of dye adsorbed at equilibrium (mg/g) and at time t (min), respectively, and k1 is the rate constant of the pseudo first ?order adsorption (min-1). Values of K1 were calculated from the plots of log (qe ? qt) vs. t (figures not shown) and are listed in Table 3. The results reveal that the correlation coefficients (R2) were low. This indicates that the adsorption of CR dye onto BFA does not follow first order kinetics [32].
[Table 3.] Kinetic parameters for the removal of congo red by BFA and BFA-H2O2
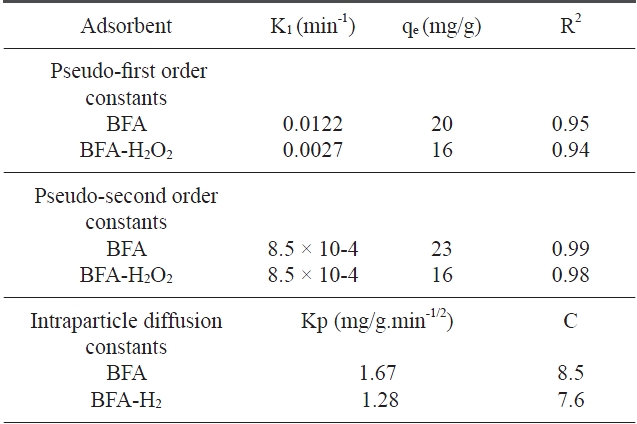
Kinetic parameters for the removal of congo red by BFA and BFA-H2O2
3.5.2 Pseudo-second-order model
The second order kinetic model [33] is expressed as:

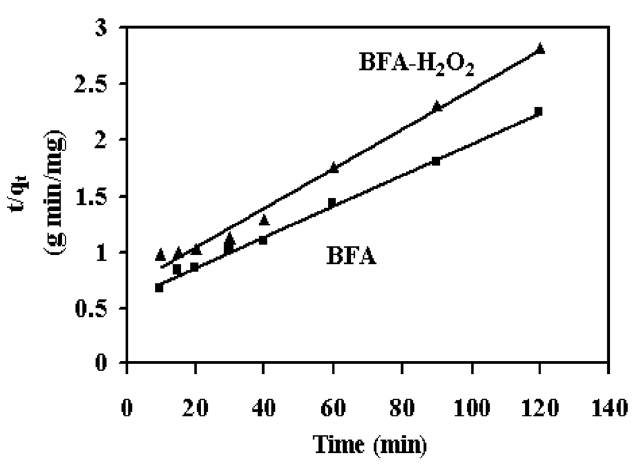
where K2 is the equilibrium rate constant of pseudo second?order adsorption (g/mg min). If a second-order kinetic is applicable, the plot of t / qt vs. t should give a linear relationship. There is no need to know any parameters beforehand and the equilibrium adsorption capacity qe can be calculated from Eq. (3). Also, it is easier to predict the behavior over the whole range of adsorption [33]. Values of K2 and qe can be calculated from the slope and intercept of t / qt vs. t plot (Fig. 6). The correlation coefficients for the second-order kinetic model are greater than 0.97 (Table 3). This indicates that the adsorption system belongs to the second order kinetic model [34].
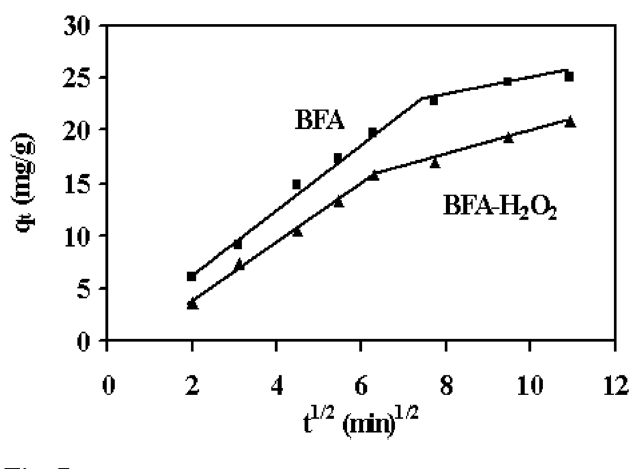
3.5.3 Intraparticle diffusion study
The adsorbate species are most probably transported from the bulk of the solution into the solid phase through an intraparticle diffusion process, which is often the rate limiting step in many adsorption processes. The possibility of intraparticle diffusion was explored by using the following model [35]

where qt is the amount of dye adsorbed at time t, and kidis the intraparticle diffusion (mg/g min0.5), which is calculated from the slope of a plot of qt versus t0.5 ; C is a constant and is evaluated from the intercept when the adsorption mechanism follows the intraparticle diffusion process. Values of the intercept give an idea about the thickness of the boundary layer, i.e., the larger the intercept, the greater is the boundary layer effect [36]. As can be seen in Fig. 7, the deviation of straight lines from the origin may be due to the difference in the rate of mass transfer in the initial and final stages of the adsorption [37]. Further such deviation of straight lines from the origin indicates that the pore diffusion is not the sole rate determin-
ing step. From Fig. 7, it can be seen that there are two separate regions: the first straight portion is attributed to macro diffusion due to the instantaneous utilization of the most readily available adsorbing sites on the adsorbent surface (phase I); the second linear portion is due to micropore diffusion, which is attributed to the very slow diffusion of the adsorbates from the surface film into the micropores, which are the least accessible sites of adsorption (phase II) [38]. The values of kidand C as obtained from the slope of the straight line are listed in Table 3.
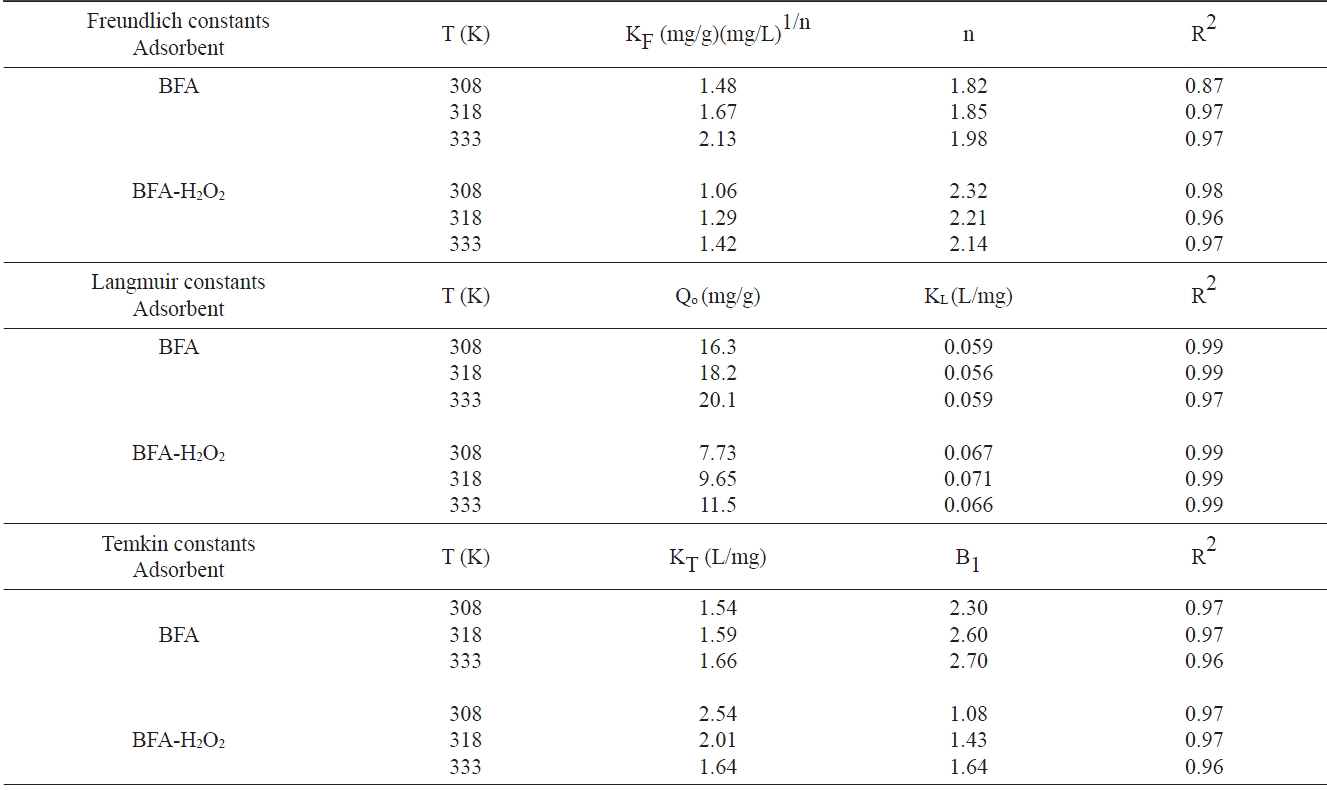
Isotherm parameters for removal of congo red by BFA and BFA-H2O2 at different temperatures
To optimize the design of an adsorption system for the adsorption of adsorbate, it is important to establish the most appropriate correlation for the equilibrium curves. Various isotherm equations have been used to describe the equilibrium nature of adsorption. These isotherm models are described below.
3.6.1 Langmuir isotherm
The Langmuir isotherm assumes uniform energies of adsorption onto the surface and no transmigration of adsorbate in the plane of the surface. The linear form of the Langmuir isotherm is given by the following equation [39]:
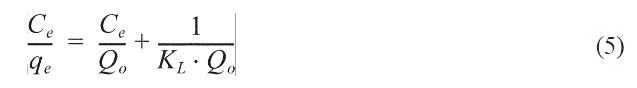
where KL is the Langmuir adsorption constant (L/mg) related to energy of adsorption, and Qo is the maximum adsorption capacity corresponding to complete monolayer coverage on the surface (mg/g).
3.6.2 Freundlich isotherm
This model describes a heterogeneous surface with a nonuniform distribution of heat of adsorption over the surface; it is expressed in linear form as:
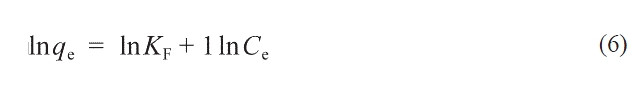
where KF is the Freundlich constant (L/mg) and 1/n is the het-
erogeneity factor. Also, n is an empirical parameter related to the intensity of adsorption, which varies with the heterogeneity of the adsorbent. When values of n are in the range 0 < n < 1, the adsorption is favorable [40]. Hence, the greater the value of n, the better the favorability of the adsorption process.
3.6.3 Temkin isotherm
The Temkin isotherm equation assumes that the heat of adsorption of all molecules in the layer decreases linearly with coverage due to adsorbent-adsorbate interactions. Also, the adsorption is characterized by a uniform distribution of the binding energies, up to some maximum binding energy [41]. The Temkin isotherm equation is given as:
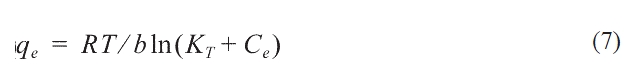
where equation (7) can be linearized as:
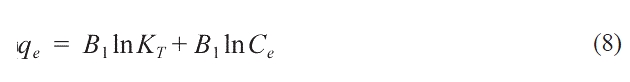
where B1 (RT/b) and KT are the constants. KT is the equilibrium binding constant (L/mol) corresponding to the maximum binding energy; constant B1 is related to the heat of adsorption.
The non-linear R2 values, based on the actual deviation between the experimental points and the theoretically predicted data points, provide a better correlation of experimental data and are shown in Table 4. It was observed that the Langmuir isotherm fits better to the experimental data than do the Freundlich and Temkin isotherms for the CR dye adsorption on the utilized adsorbents.
Due to the inherent bias resulting from linearization, two different error functions for non-linear regression basin were employed in this study to find out the best-fit isotherm model for the experimental data.
3.7.1 The sum of the squares of the errors (SSE)
This error function, SSE, is given as:
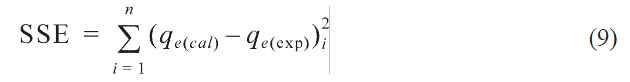
This error function has a major drawback in that it provides isotherm parameters showing a better fit at the higher end of the adsorbate concentration. This is because the magnitude of the error and hence the square of the error increases as the concentration of the adsorbate increases [42].
3.7.2 The sum of the absolute errors (SAE)
SAE function is given as:
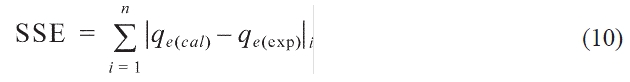
The isotherm parameters determined by this method provide a better fit as the magnitude of the errors increases, biasing the fit toward the high concentration data [30].
The values of error functions are presented in Table 5. By comparing the results of the values of the error functions, it was predicted that the Langmuir model would best fit the CR dye adsorp-
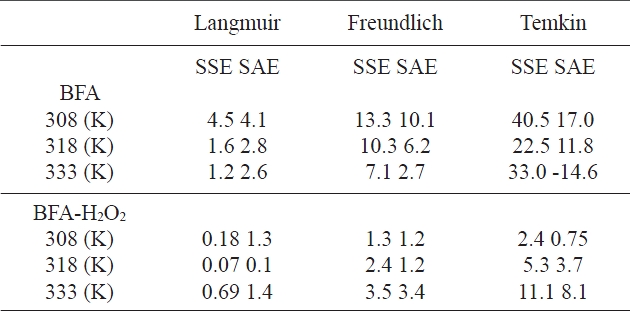
Values of two different error analyses of isotherm models for adsorption of congo red by BFA
tion isotherm data for the two adsorbents at all temperatures. This was confirmed by looking at the non-linear correlation coefficients (R2), which showed that the Langmuir model is the best model.
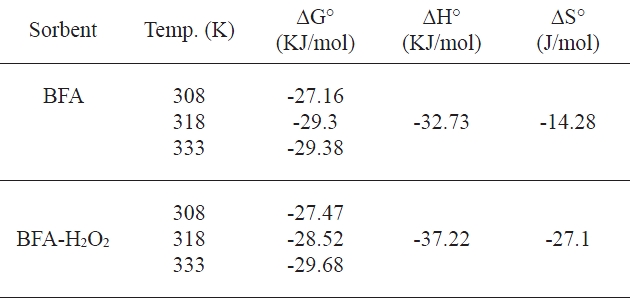
The temperature has two main effects on the adsorption process.An increase in temperature is known to increase the diffusion rate of the adsorbate molecules across the external boundary and within the pores. Furthermore, changing the temperature will modify the equilibrium capacity of the adsorbent for a particular adsorbate. The effect of temperature is investigated in the adsorption tests carried out at three constant temperatures: 303, 313 and 333 K. the amount of CR taken up by both the adsorbents rises with temperature, as can be seen in Table 5. The thermodynamic properties, enthalpy (ΔH°), free energy change(ΔG°) and entropy change (ΔS°) for the adsorption of CR dye, are calculated from the following set of equations:
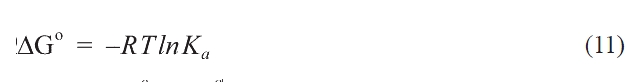
The equilibrium constant of the adsorption process, Ka, which is equal to the product Qob, is calculated first. The enthalpy change (ΔH°) is determined from the slope of the regression line after plotting in Ka against 1/T. The changes in ΔG° and ΔS° are determined from Eqs. (11) and (12). The negative values of the free energy change, as shown in Table 6, confirm the spontaneous nature of adsorption. The change of the free energy decreases with increasing temperatures regardless of the nature of the adsorbent. This indicates that a better adsorption is actually obtained at higher temperatures. Negative values of ΔH° and ΔS° show that the adsorption is exothermic. The higher removal of CR with increasing temperature was contradictory to the findings obtained from the Vant Hoff equation. This might be due to the chemical reactions taking place between the functional groups of the BFA and CR dye molecules [43]; also, it might be attributed to the enhanced rate of intraparticle diffusion of the bulky adsorbate, because diffusion is an endothermic process. Similar observations have also been reported by Mittal and Venkobachar [44] and Gupta et al. [45] during the study of the removal of rhodamine on sulfonated coal.
[Table 6.] Thermodynamic parameters for the uptake of congo red by BFA

Thermodynamic parameters for the uptake of congo red by BFA
BFA (as-received) proved to be an effective and low cost adsorbent for the removal of CR dye from aqueous solutions.Chemical treatment with H2O2 is not recommended because it reduced the adsorption capacity of BFA. A higher removal extent was achieved by optimizing parameters such as the contact time, pH, adsorbent dose and temperature. The data arising from the adsorption of CR onto BFA could be described by the Langmuir model, while the time-dependence of the data followed second-order kinetics. The thermodynamic parameters derived from such data led to the conclusion that physical adsorption occurred, with the negative value of the enthalpy demonstrating the exothermic nature of the process.