Thermal emissivity of commercial nuclear graphites (IG-110, PCEA, IG-430 and NBG-18) following changes in oxidation degrees were examined. Specimens were oxidized to 0%, 5%, and 10% in air flow of 5l/min at 600℃ using a furnace, and the thermal emissivities were measured using an infrared spectrum analyzer. The measuring temperatures for the thermal emissivity were 100℃, 200℃, 300℃, 400℃ and 500℃. Also density and porosity of the specimens were observed to compare with thermal emissivity. Results showed that emissivity increased with oxidation, and the 10% oxidized NBG-18 showed the highest emissivity (0.890) which value is larger for 24% than the value of as-received specimen. Investigation of factors affecting the emissivity revealed that increases in the surface roughness and porosity due to oxidation were responsible for the increase in emissivity after oxidation.
For producing hydrogen many countries including US, Japan, France, and Korea are making efforts exclusively to develop the safe and high temperature reactor, which is expected to play a important part in producing the electricity as well as the hydrogen in the future. Unlike the light water nuclear reactor that is heated up to 300℃, the very high temperature reactor (VHTR) is heated up to 900℃ or more [1,2]. The graphite that has the properties of small heat expansion, high thermal conductivity, and high neutron deceleration property could be used for the structure material, reflection material, and deceleration material within the VHTR reactor center. Since the VHTR is, however, operated at the high temperature of 900℃ or higher, nonactive gases, Ar or He is mostly used for the vapor flowing on the heat exchanger to prevent oxidation of the graphite [3]. Also these gases heat up the water in the heat exchanger at 900 and decompose water into the hydrogen and oxygen. Iodine and sulfur are added and continuously reused for decomposition of the water[2].
On the other hand, the non-active gases, Ar or He gas, have to be jetted and cooled down the reactor when the temperature of VHTR is increased with the any serious problem. However, existence of an extremely small volume of impure substance in the non-active gases may generate critical defects during jet, such as oxidation of the graphite[4-6].
The thermal emissivity of the graphite is very important for the drastic heat release. Up to date, however, there were very little studies done on the thermal emissivity of the nuclear graphite.
The thermal emissivity is a phenomenon appeared on the outside of an object having the thermal energy. The thermal emissivity is used variously in expressing the thermal properties of materials, such as metals, ceramics, plastics, and others. And there are many studies undertaken throughout the industries such as aerospace, fire safety, health and medicine, plastic process, fiber industry, electricity and electronic parts, and others[7-10]. These studies mention that the thermal emissivity is affected depending on the surface shape or tendency of roughness, however it is difficult to find quantitative data[8,9,11 and 12].
This study researched on the effects of changes in the density, porosity and surface structures of nuclear graphite following changes in oxidation degrees on the thermal emissivity of graphite.
2.1. Specimens and oxidation processes
Specimens used in this study are IG-110, PCEA, IG-430,
[Table 1.] Properties of IG-110 PCEA IG-430 and NBG-18 [2,13,14]
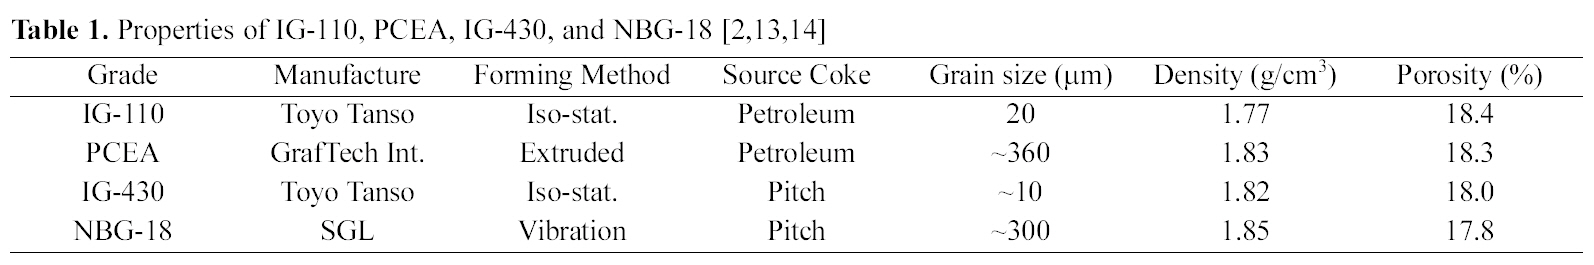
Properties of IG-110 PCEA IG-430 and NBG-18 [2,13,14]
and NBG-18, and their basic properties are shown in Table 1. According to the data, the IG-110 and IG-430 are manufactured by Toyo Tanso with the iso-static molding method, and the grain sizes are similar for 10~20 ㎛. The source cokes are petroleum for IG-110 and pitch for IG-430. NBG-18 is manufactured by SGL and molded in the vibration method with the grain size of 300 ㎛ that is larger than the IG group, and the pitch coke is used for source coke. PCEA is manufactured by GrafTech and molded in the extruded method with the grain size of 360 ㎛ that is the largest grain in this study, and the source coke is the petroleum.
The specimens were oxidized at 600℃ in the air flow of 5l/min using the tube furnace. The degrees of oxidation were set to 5% and 10% weight losses, because strength of the graphite above 10% weight loss is weakened to cause the structural problems, and the measurement of thermal emissivity is no longer meaningful.
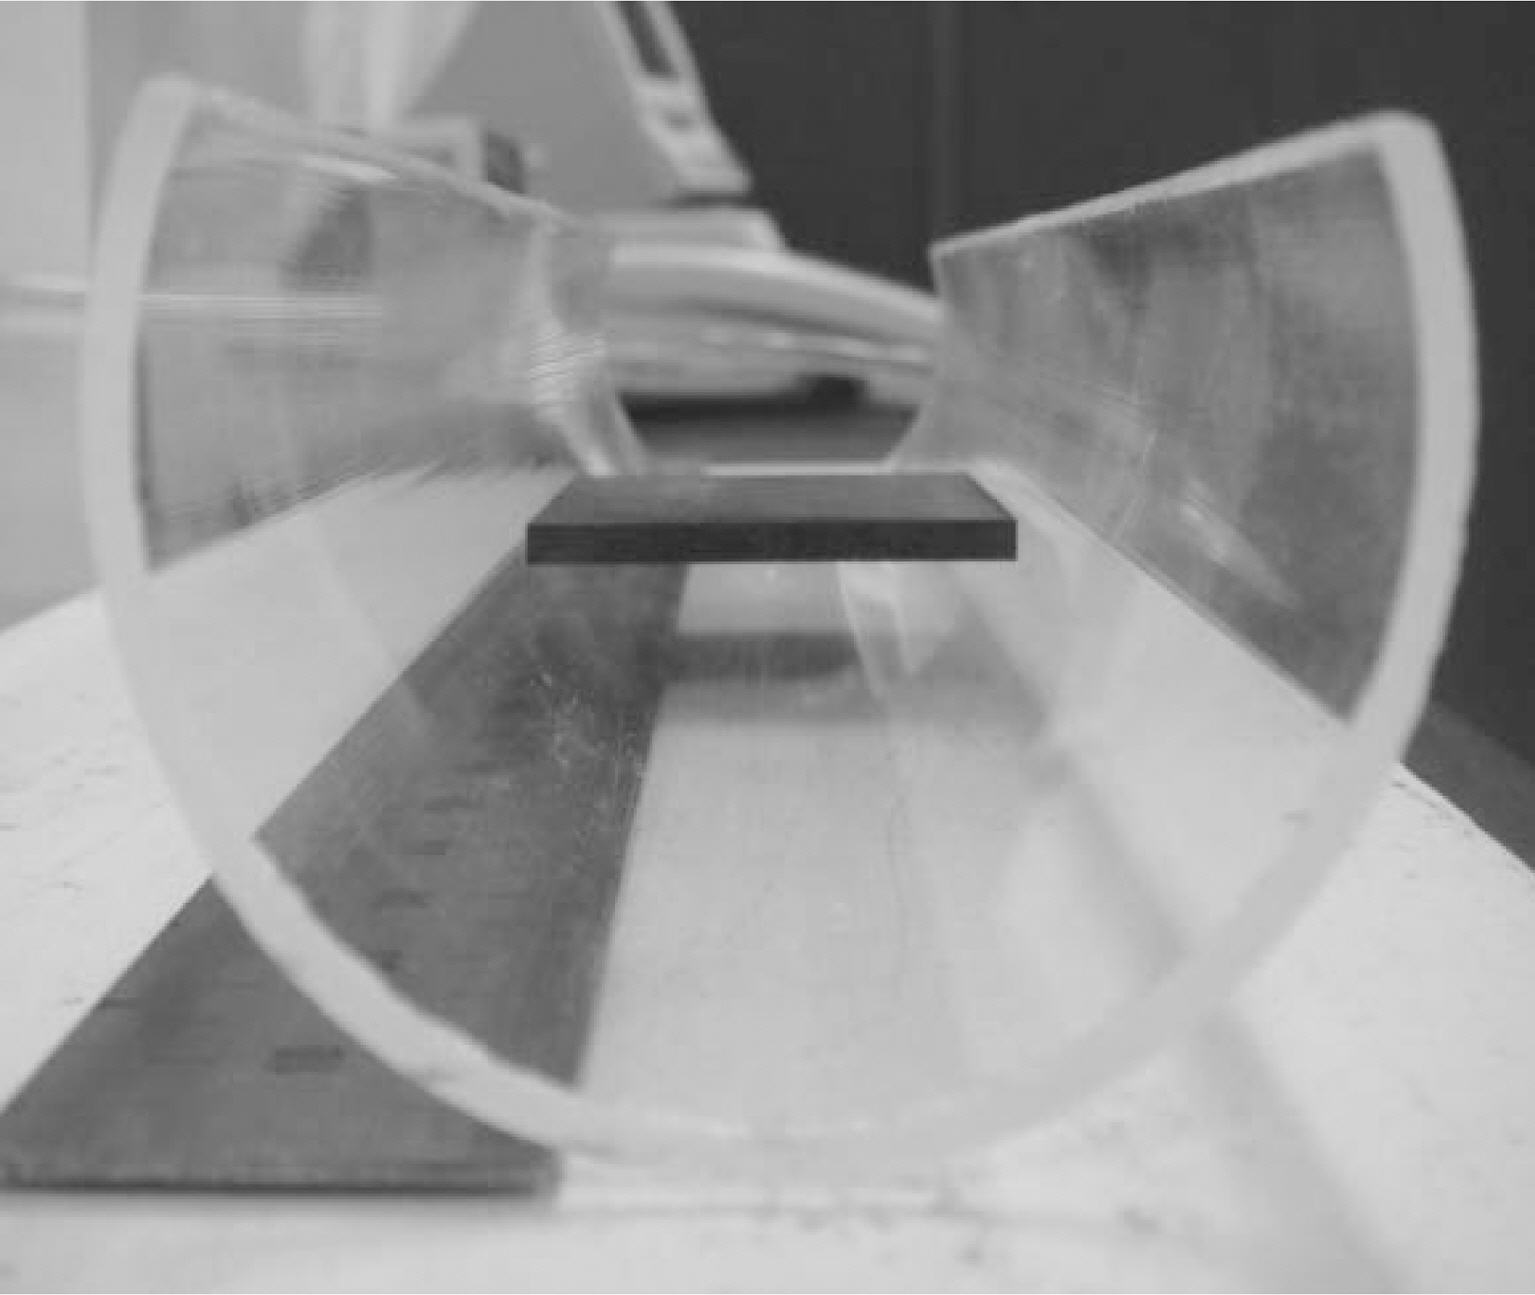
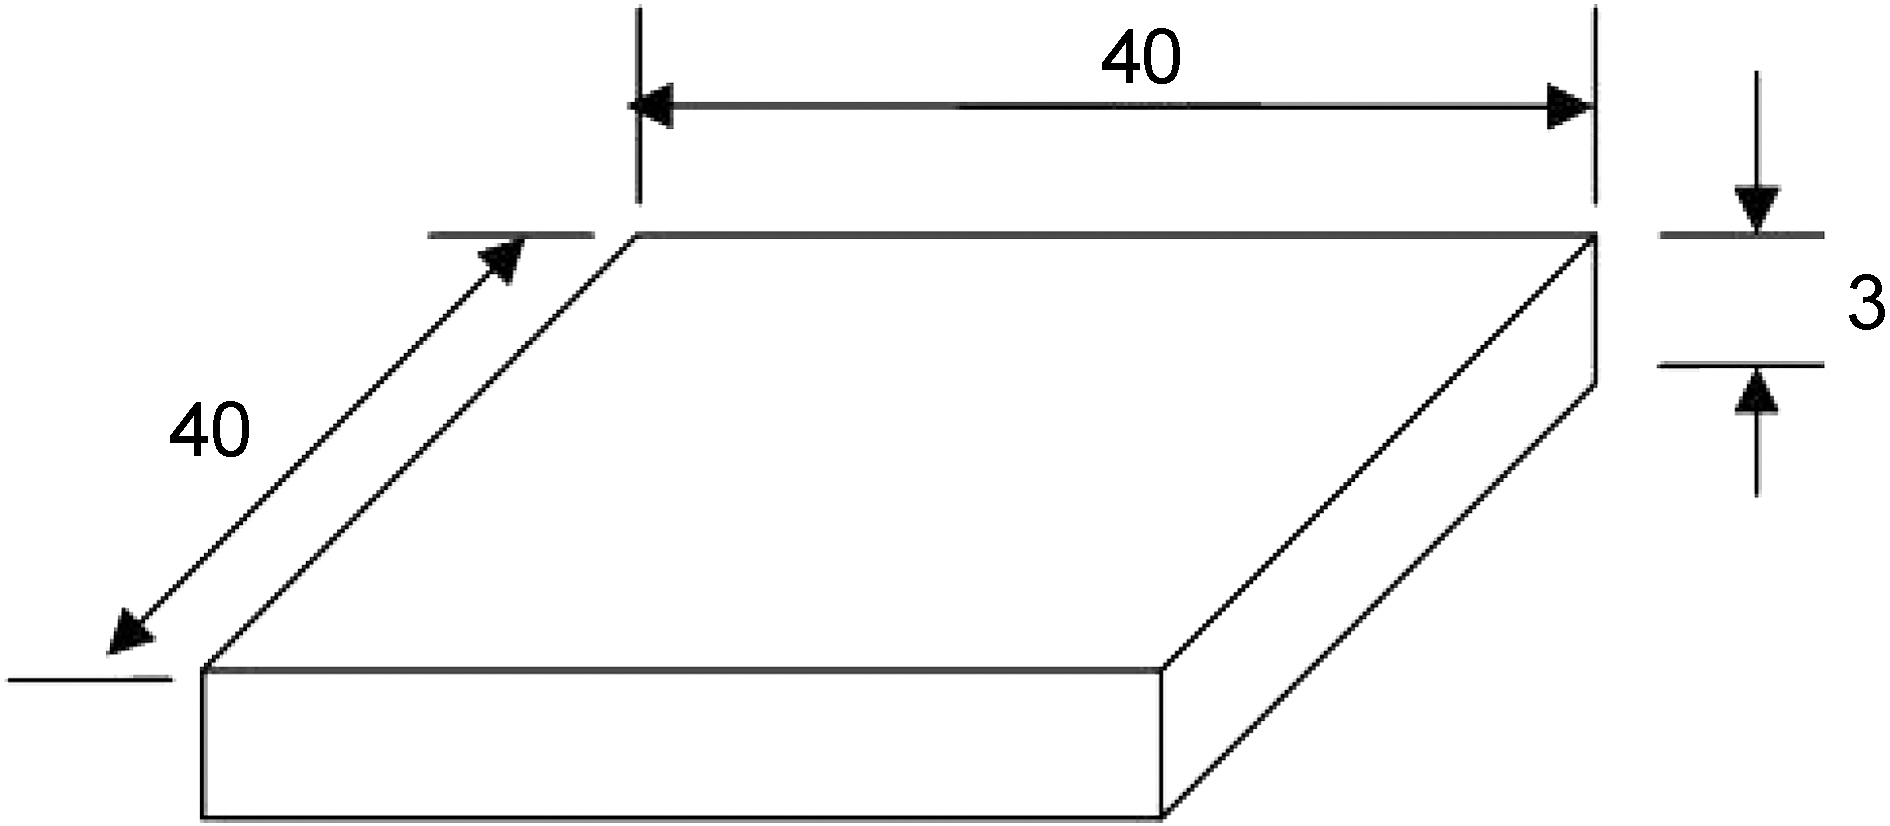
In order to measure the thermal emissivity, the specimen is cut to size of 40×40×3 (mm) as shown in Fig. 1. This specimen dimension fits specimen holder size of the thermal emissivity measurement device. To minimize the influence of the surface roughness, the specimens are polished to the roughness of 0.5 ㎛ or below. For uniform oxidation reaction, the specimens are loaded in the circular-shaped quartz boat in which only two bottom edges of the specimen are in contacted with quarts boat and other sides are open to the atmosphere as shown in Fig. 2.
The density and porosity of specimens after oxidation were measured by the Archimedean method. The calculation formulas of density and porosity using the Archimedean method are as follows;
- Porosity (%)={(wet weight - dry weight)/(wet weightsuspended weight in water)}×100
- Density (g/cm3)=dry weight/(wet weight - suspended weight in water)
2.3. Microstructure observation
The changes in the microstructures on the specimen surfaces caused by oxidation were observed with the digital camera,optical microscope (OM), and scanning electron microscope (SEM). The OM and SEM microstructures are photographed at a magnification of 50X. Through the microstructure observation the pore distributions and pore size were observed as well. The microstructure observations using an electron microscope were conducted on 60° tilted specimens in order to observe pore shapes and surface morphologies more clearly.
2.4. Measurement of thermal emissivity
After the oxidation experiment, the thermal emissivity of the specimen is measured by the measuring device using the far infrared ray. The thermal emissivities of the specimens with weight loss of 0%, 5%, and 10% were measured at the temperature of 100℃, 200℃, 300℃, 400℃ and 500℃, respectively. The measuring room was maintained at 22℃ and humidity of 35%.
Table 2 shows the summary of the density and porosity
[Table 2.] A Summary of the Density and Porosity Data
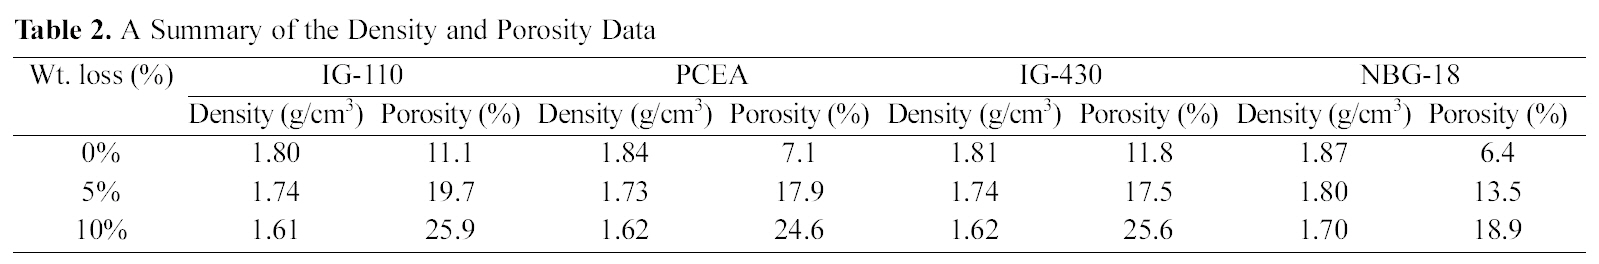
A Summary of the Density and Porosity Data
measured by the Archimedean method and Fig. 3 and Fig. 4 illustrate the changes in graphs.
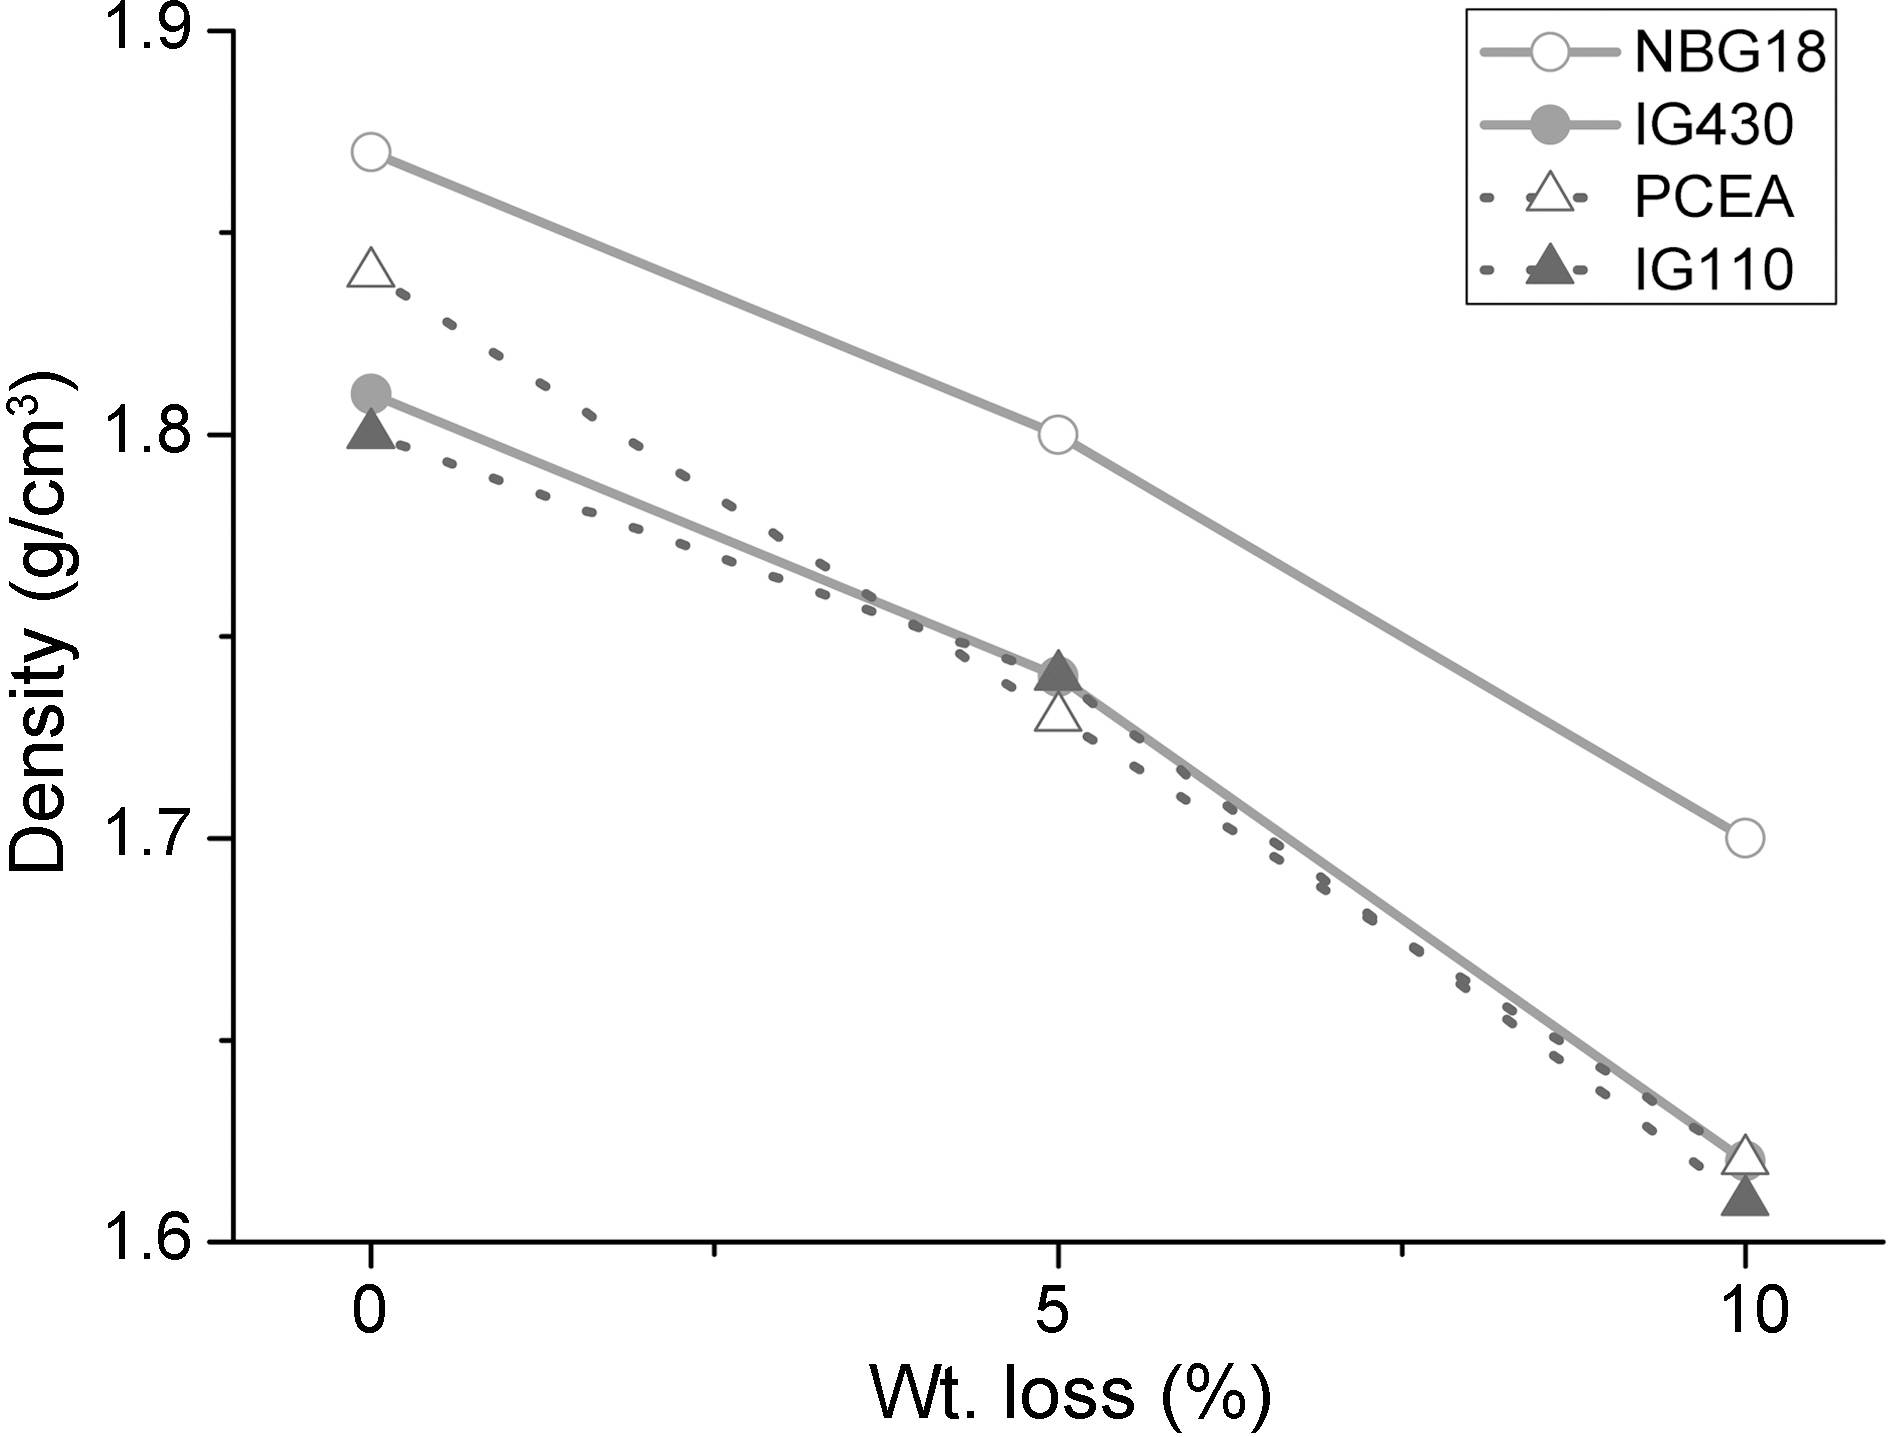
Fig. 3 shows an overall tendency under which as the oxidation degree increases the density decreases. Density changes following changes in oxidation degrees are as follows. The density of IG-110 was decreased by oxidation (0%→10%) from 1.80 g/cm3 to 1.61 g/cm3, PCEA from 1.84 g/cm3 to 1.62 g/cm3, IG-430 from 1.81 g/cm3 to 1.62 g/cm3 and NBG-18 from 1.87 g/cm3 to 1.70 g/cm3. Under all conditions before and after oxidation, the density of NBG-18 was the highest and the density of IG-110 was the lowest.
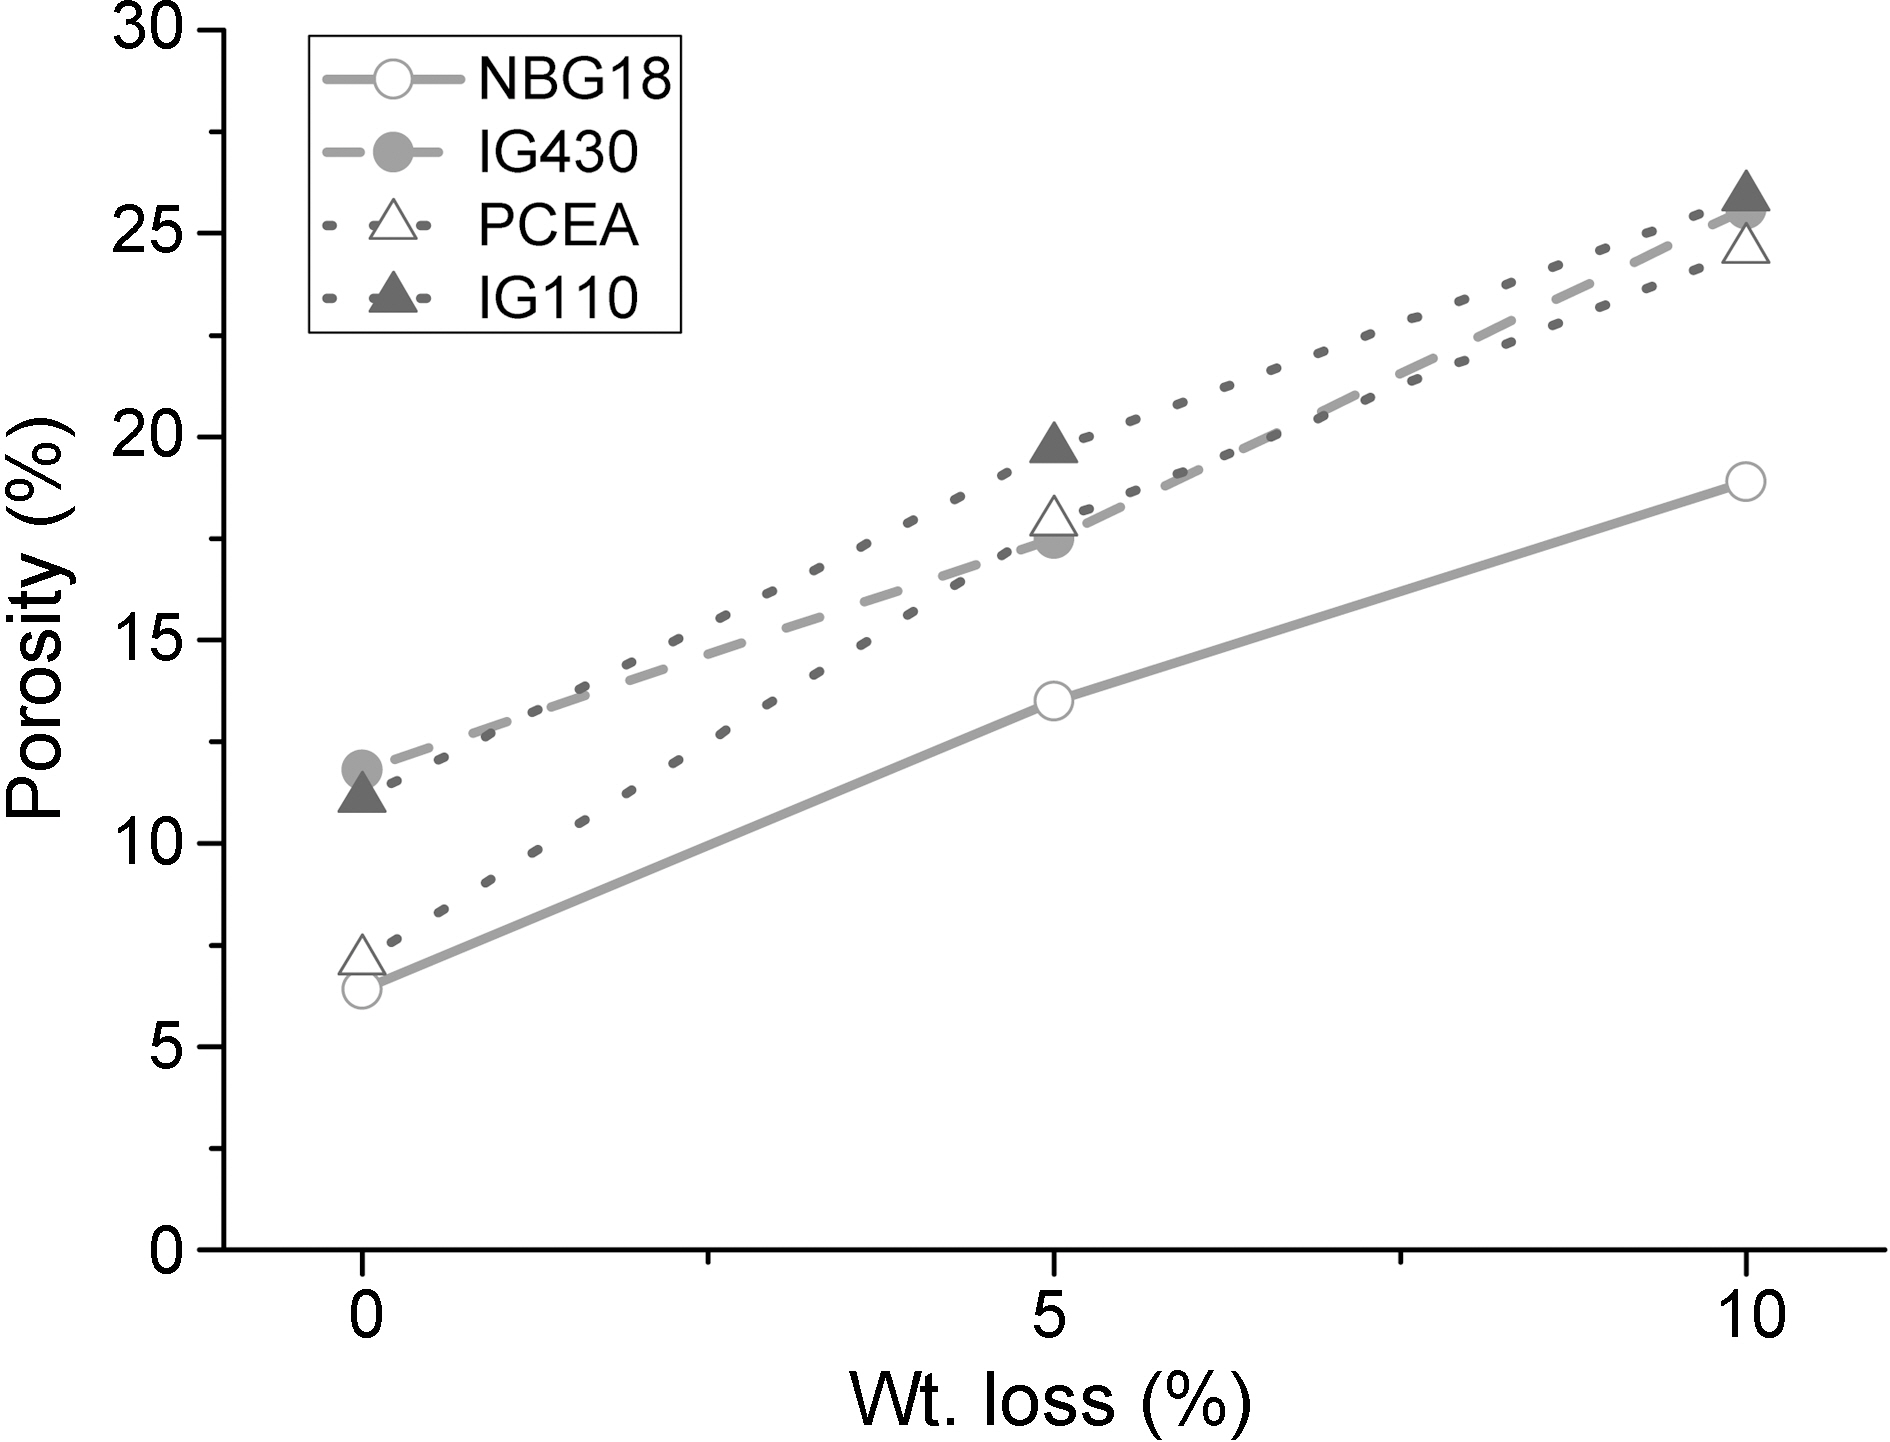
Fig. 4 shows a tendency under which as the oxidation degree increases, the porosity increases as well. By oxidation
(0%→10%), the porosity of IG-110 was increased from 11.1% to 25.9%, PCEA from 7.1% to 24.6%, IG-430 from 11.8% to 25.6% and NBG-18 from 6.4% to 18.9%. Under all conditions before and after oxidation, the porosity of IG-110 was the highest and the porosity of NBG-18 was the lowest. It is not easy to explain the reason why the used graphites showed different porosity after oxidation. It could be assumed that the graphites were manufactured using different processes and raw materials. Therefore the oxidation reactions of the graphites take place by different mechanisms.
3.2. Microstructure observation
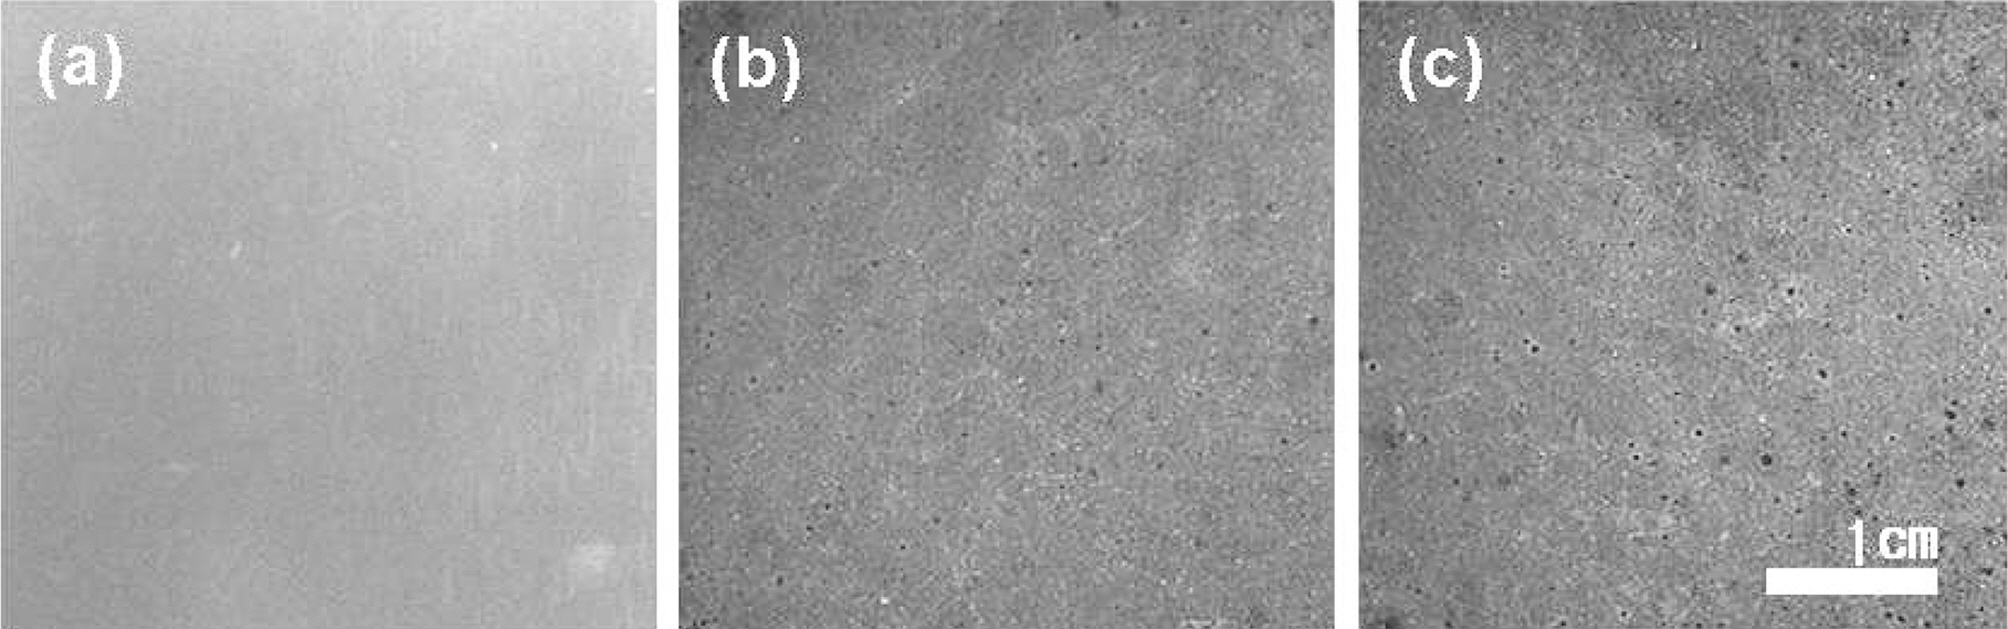
The surface images of IG-110 taken by digital camera
were shown in Fig. 5. It can be observed that as oxidation degrees increase, pores are created and grow bigger.
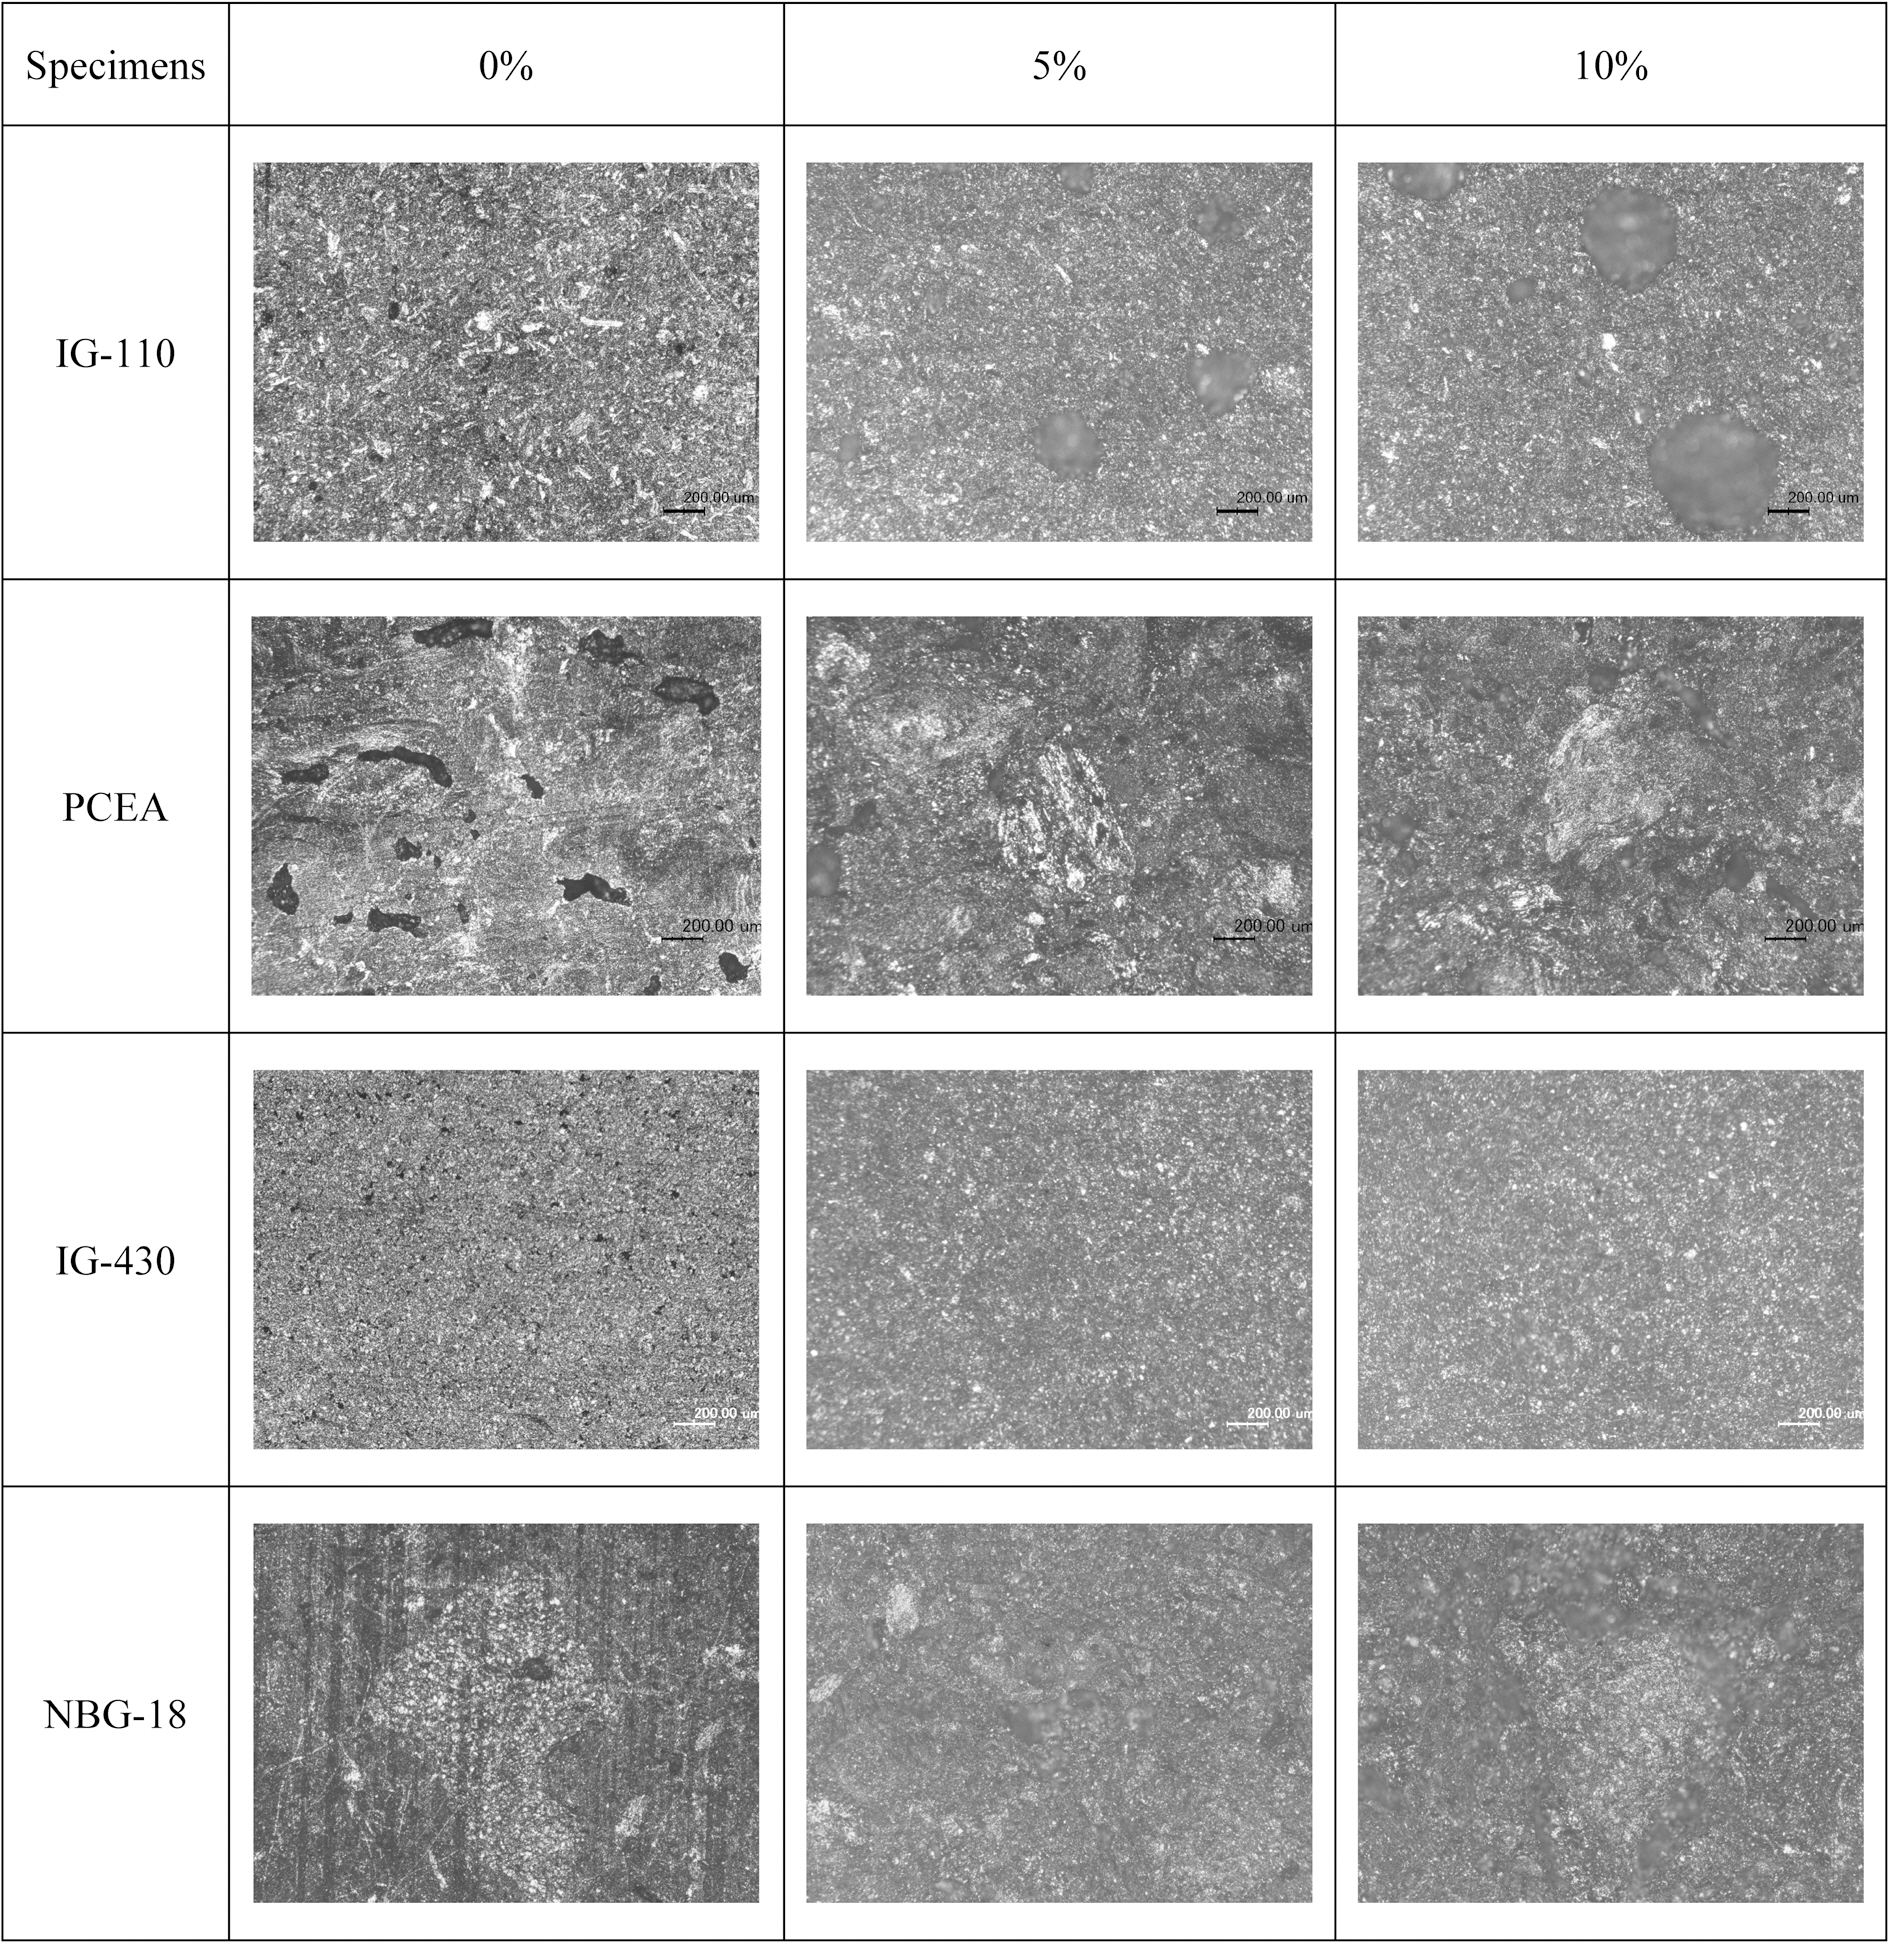
Fig. 6 shows the surface images of the specimens (no polished) observed at a magnification of 50X using an OM. Small pores were observed in the 0% specimen of IG-110, and pores with several tens to 200 ㎛ were observed in 5% specimen. It can be observed that very large pores larger than 300 ㎛ have been developed in 10% specimens rather than small pores. In IG-430, however, the phenomenon of formation and growth of pores on the surface following increases of oxidation degrees could not be observed.
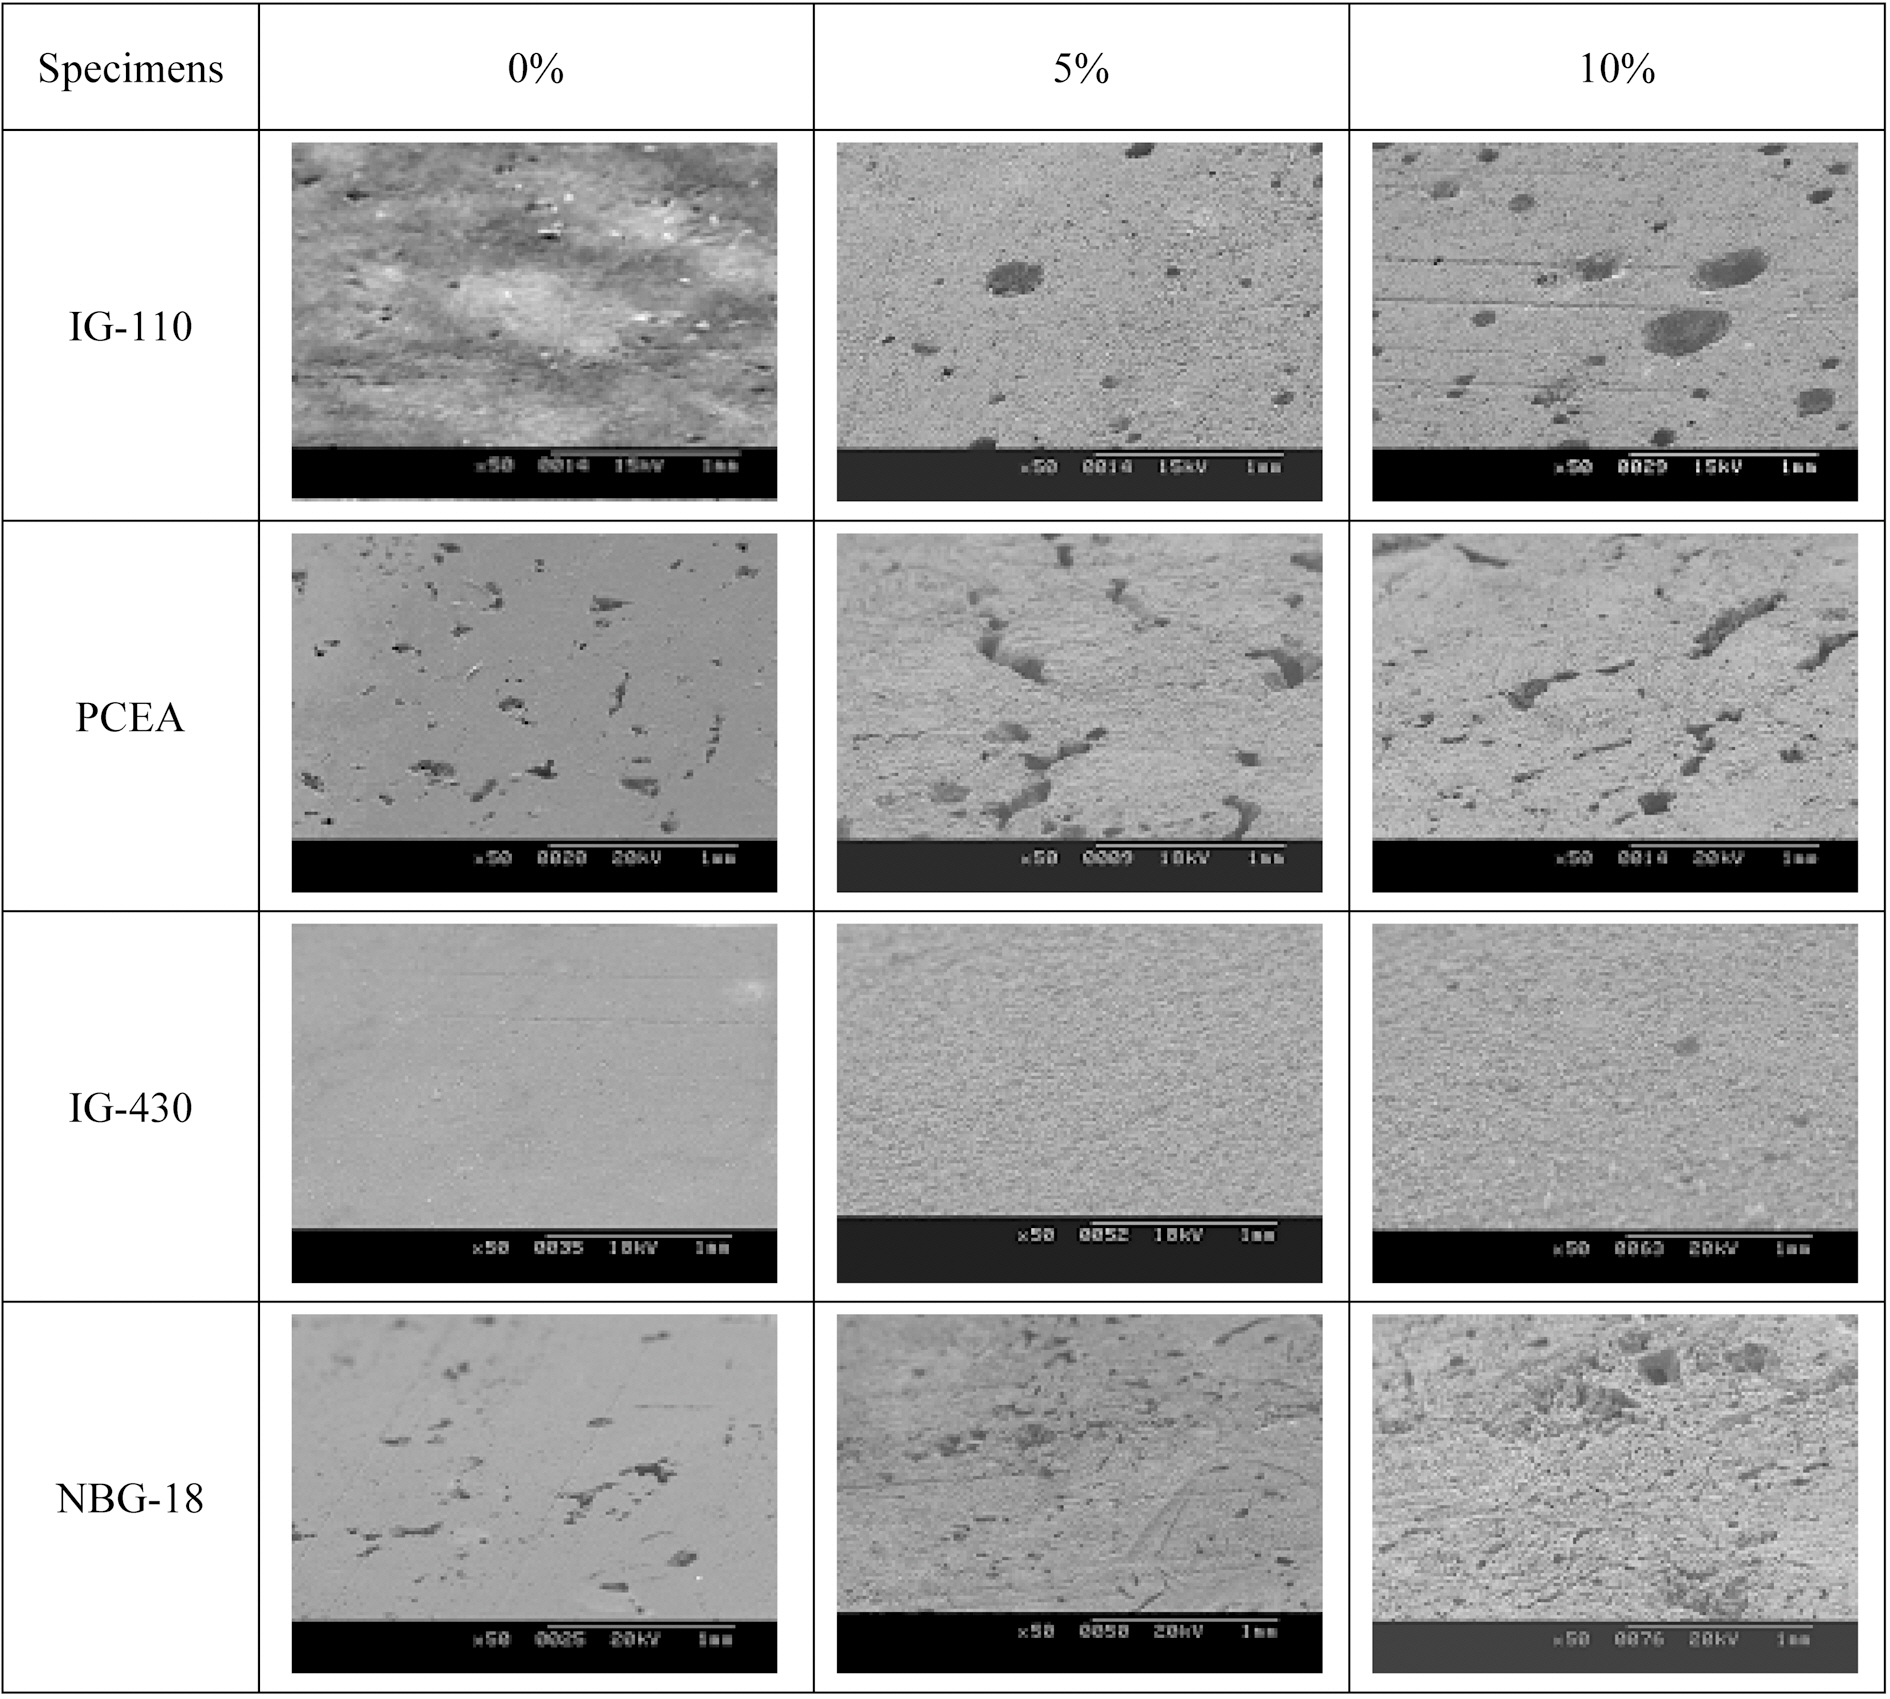
Fig. 7 shows the SEM micrographs of surface morphologies under different oxidation degrees. It can be seen that in the case of IG-110 pores develop well as the oxidation degree increases and in the case of IG-430 large pores are not observed even though prominences and depressions develop on the surface of graphite by oxidation. It can be seen that, in the case of PCEA and NBG-18 pores already exist on 0% specimens. It is considered that the reason why pores exist on 0% specimens of PCEA and NBG-18 is the large grain sizes. As shown in the Table 1, the grain size of PCEA and NBG-18 was around 300 ㎛ which was larger than that of other types of nuclear graphite.
Table 3 shows changes in thermal emissivity following changes in oxidation degrees. The porosity increased as oxidation degrees increased, and the thermal emissivity showed an increasing tendency as the porosity increased.
Therefore it could be said that increases of porosity resulting from oxidation affect increases of thermal emissivity. However the relationship between two properties is different by the kind of graphite. The specimen with the highest
[Table 3.] Results of Thermal Emissivity
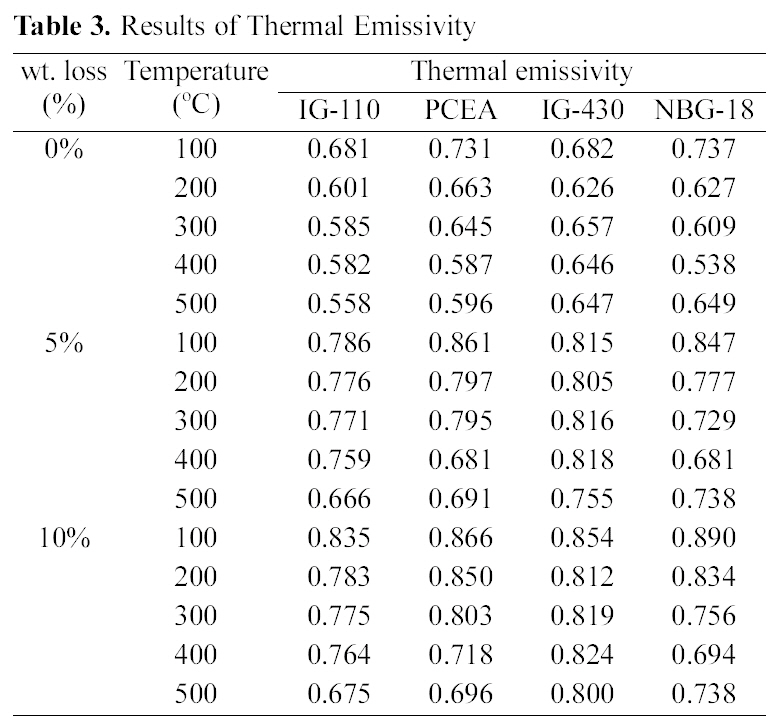
Results of Thermal Emissivity
thermal emissivity in Table 3 is 10% oxidized NBG-18 measured at 100℃, but the decreasing rate may be higher depending on measuring temperatures. Based on the above porosity and density data, NBG-18 has high density and low porosity under all oxidation degrees. As shown in the Table 2, NBG-18 has a grain size of around 300 ㎛ which is much larger than IG group. Like NBG-18, PCEA also consists of large grains of around 360 ㎛ and it shows second highest value of 0.866 as the emissivity of the 10% oxidized graphite at 100℃ of which the porosity is 7.1%. Therefore, evaluation of effects on thermal emissivity should consider not only changes in density and porosity but also microstructures.
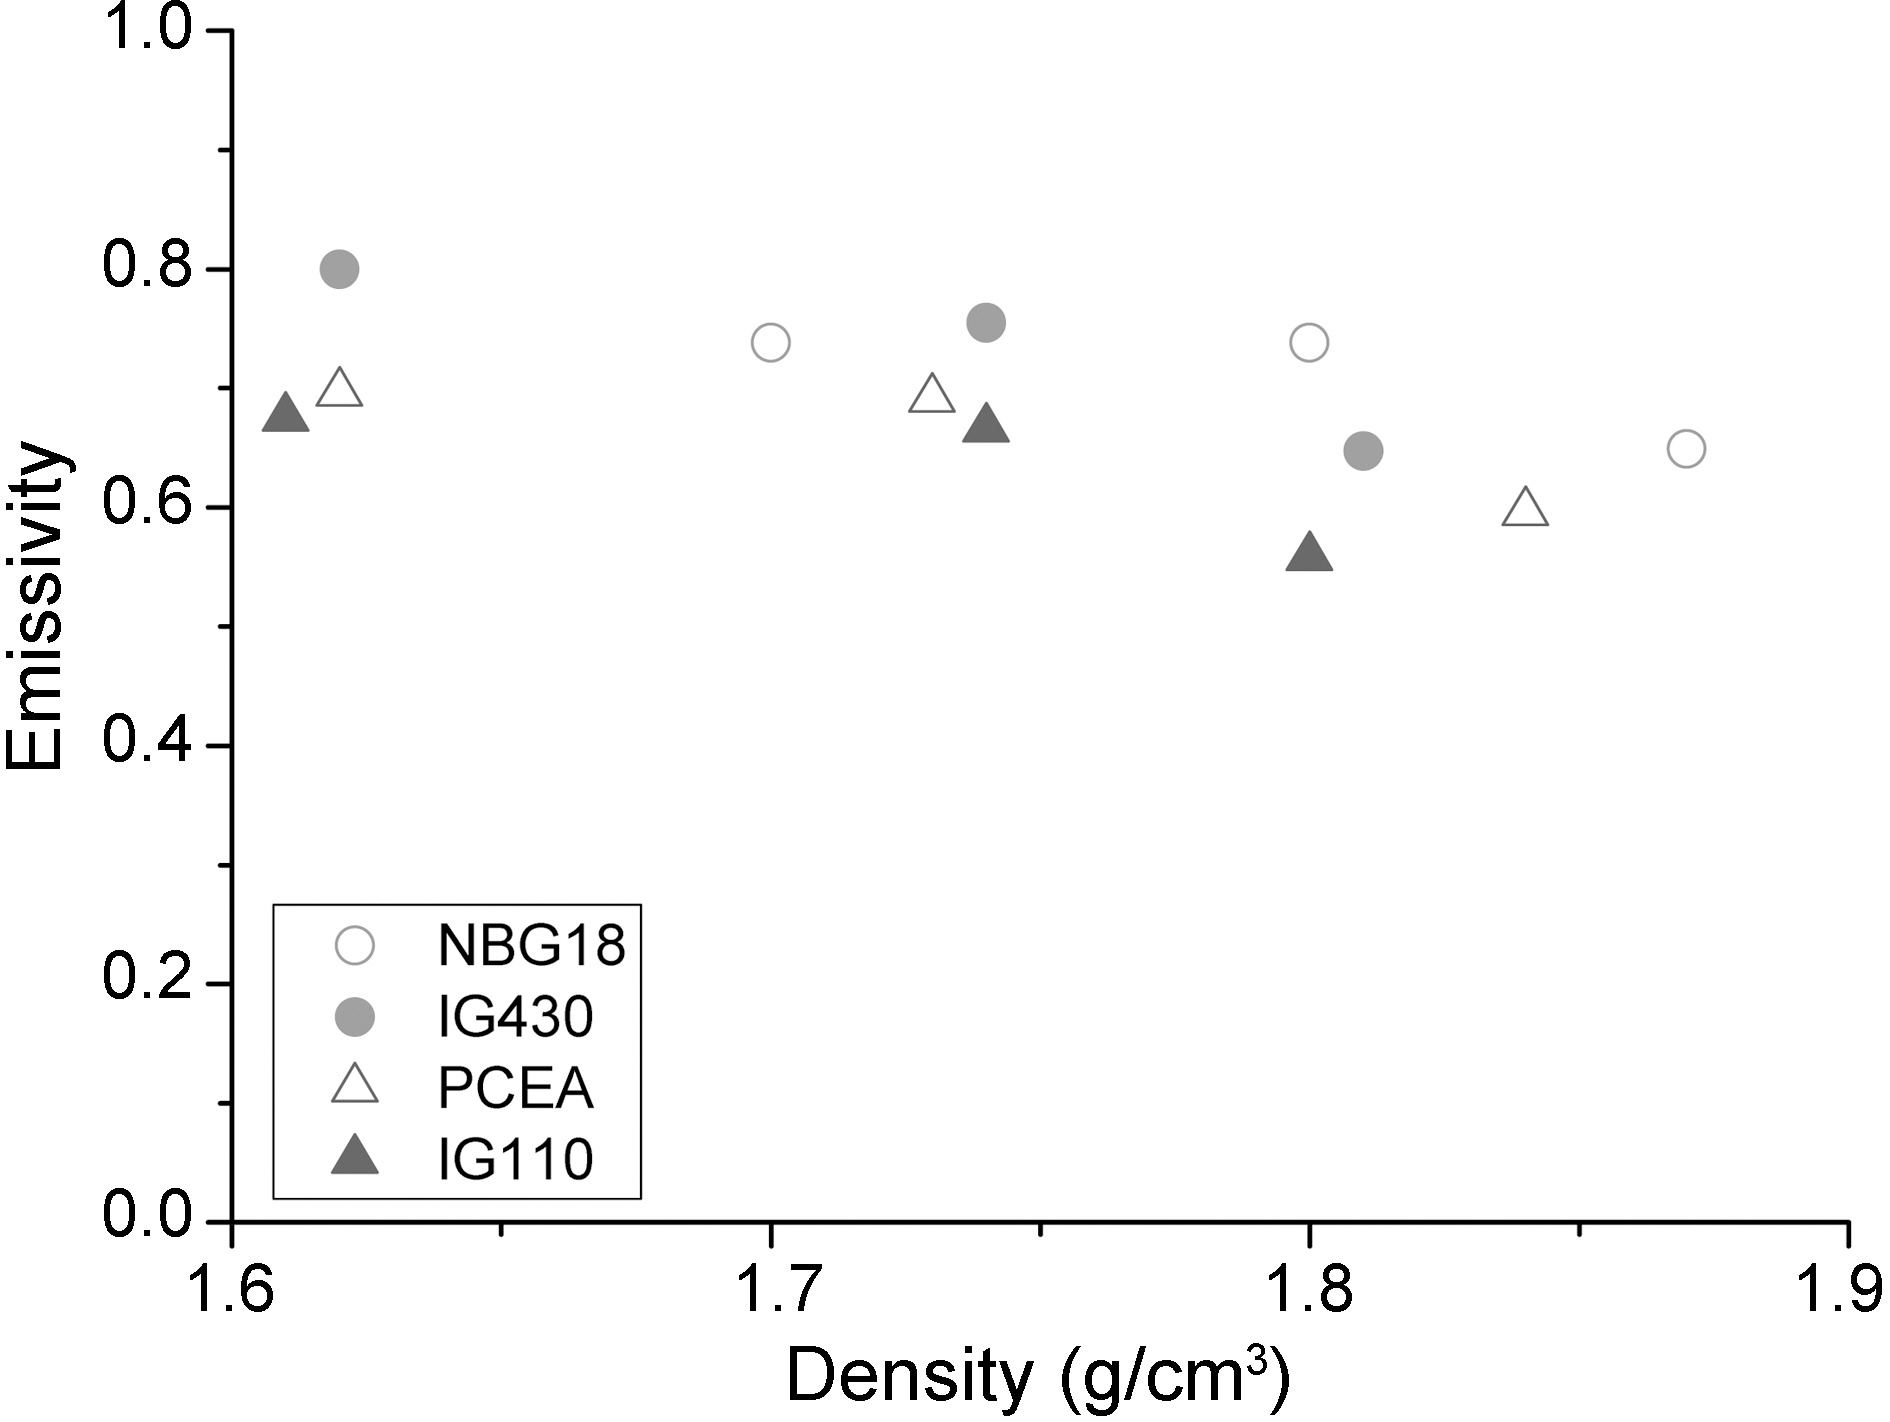
Fig. 8 shows a graph that indicates relationships between density and thermal emissivity obtained through integrating all density data for nuclear graphite used in this study. In general, as density increases, thermal emissivity shows a decreasing tendency.
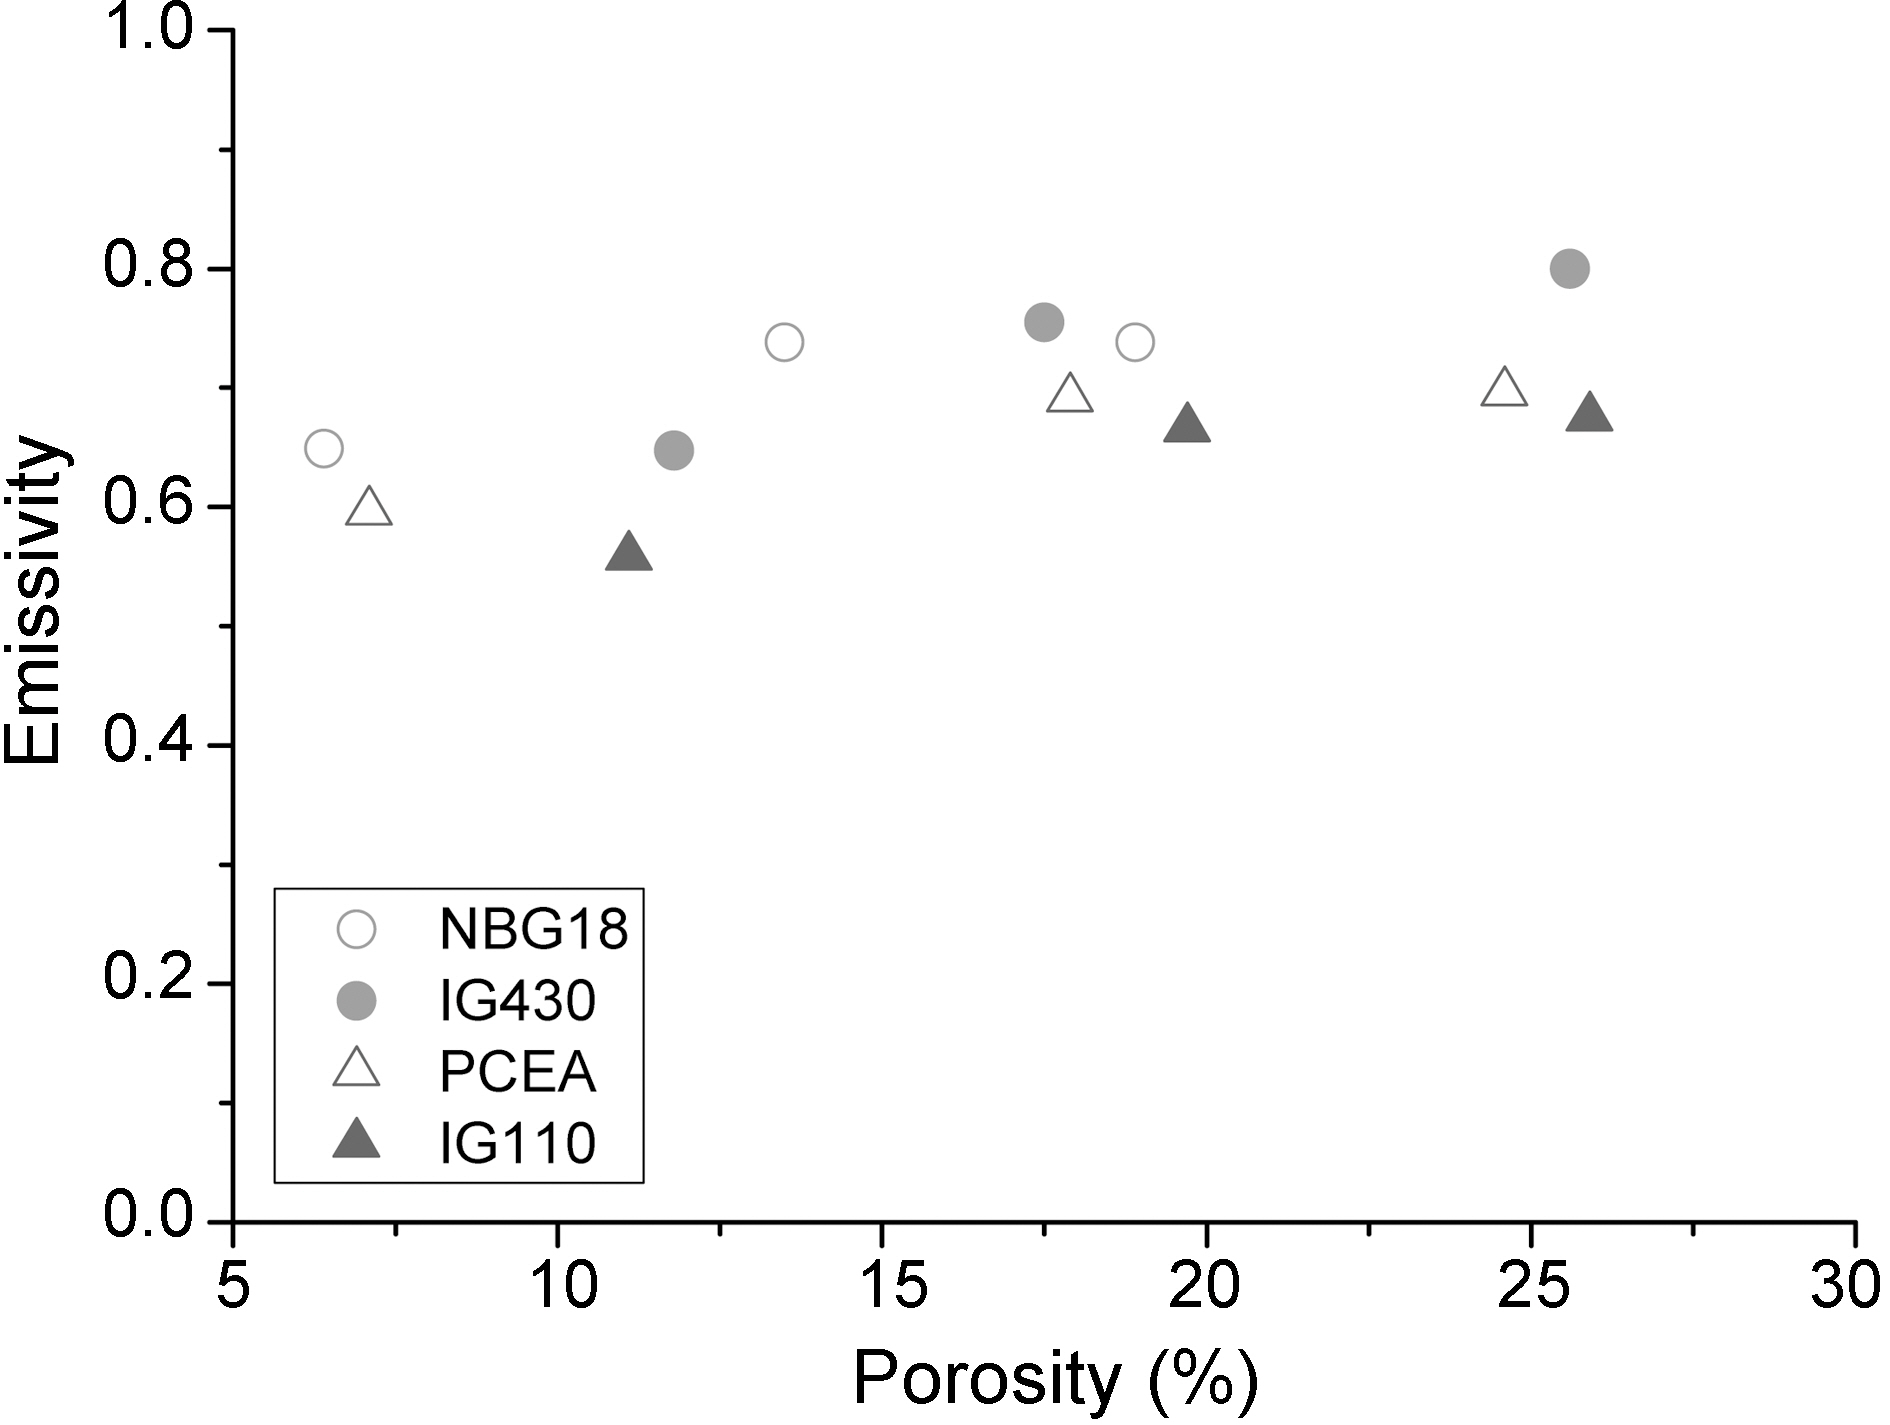
Fig. 9 shows relationships between porosity and thermal emissivity by integrating all porosity data for nuclear graphite used in this study and as porosity increases, thermal emissivity increases as well.
The thermal emissivities of nuclear graphites following changes in oxidation degrees were studied. The graphite was oxidized in air flow of 5l/min at 600℃ using a furnace, and the thermal emissivities were measured using an infrared spectrum analyzer. The measuring temperatures for the thermal emissivity were 100℃, 200℃, 300℃, 400℃ and 500℃. Also density, porosity, and surface roughness of the specimens were observed to compare with thermal emissivity. The results are as follows.
The overall emissivities of oxidized samples were increased with increase of the oxidation degrees. As oxidation degrees increased, density decreased and porosity increased, respectively. PCEA graphite showed the largest changes in density and porosity after oxidation among the all graphite. The density of PCEA graphite decreased in 12.0% from 1.84 g/cm3 to 1.62 g/cm3 and porosity increased in 3.5 times from 7.1% to 24.6%. SEM observation showed that fine pores of oxidized graphites were developed and grown.
The 10% oxidized NBG-18 showed the highest emissivity (0.890) which value is larger for 24% than the value of asreceived specimen. Investigation of factors affecting the emissivity revealed that increases in the surface roughness and porosity due to oxidation were responsible for the increase in emissivity after oxidation.

![Properties of IG-110 PCEA IG-430 and NBG-18 [2,13,14]](http://oak.go.kr/repository/journal/10441/HGTSB6_2009_v10n3_225_t001.jpg)