In the present scenario of uncertainty of security of man and material due to possibility of chemical warfare by terrorists, versatile adsorbents are required to provide full protection against those toxic agents. Recently, the microporous ACS are used as strategic adsorbent materials, which are used protection against organic toxic substances [1]. They are extensively outstanding materials employed for purification of gases, water and removal of toxic agents [2]. ACS have considerable advantages over cylindrical or irregular by shape one that they are not being particularly liable to crumbling due to abrasion. Activated carbons are a predominantly amorphous solid with higher surface area and pore volume. They are also used for liquid and gas phase applications [3].
Activated carbons are prepared by physical activation or chemical activation [4] from different precursors materials such as bituminous coal, wood, coconut shells, peat, petroleum pitch, and polymers. The physical activation was performed in two steps as carbonization of precursor followed by activation with carbon dioxide, steam and oxygen [5]. The chemical activation was carried out in single steps as impregnation with dehydrated agents such as ZnCl2, KOH and H3PO4 with thermal treatment [6,7]. Recently, many researchers have paid their attention to control the pore size and its distribution of activated processes from polymeric precursor because of their novel adsorption properties. The type of pore developed in activated carbon depends on both type of the precursor and activation method [8]. The processing parameters, which are strongly influencing the type of pore structure and its distribution of activated carbon, are activation time, temperature, heating rate, and activation agents. The temperature for the carbonization of precursor has been reported to have an influence on porosity of activated carbons. The heating rate during prolysis noticeably affects on the composition of the volatile matter and char properties [9-10]. Marcilla et. al. [11] studied the effects of the coal carbonization step heating rate on the reactivity of the chars obtained as well as on their microstructure development in the subsequent activation step. Chang et. al. [12] also reported effects of pre-carbonization process to the porosity development of activated carbons. Sun et. al. [13] studied carbonization temperature affects the polyacrylonitrile hollow fiber precursor affects on the microstructure in including BET surface area, pore size and its distribution.
The phenolic resins which are outstanding precursor material used to develop activated carbons in desired physical forms such as powdered, granular, and fibered form with control pore structure by changing processing parameters and composition of phenol and formaldehyde [14-17]. Activated carbons have an advantage over other ones that they have better abrasion resistance because of absence of sharp edge and irregular shape. Moreover, Influence of pyrolysis conditions and type of resin on porosity of activated carbon obtained from phenolic resin by chemical activation was reported [18]. The effects of heating rate on porosity of ACS from resole-type cross-linked PB by CO2 activation have not yet been reported.
Apart from heating rate, the temperature for development of porous activated carbons may not have great effect on porosity but also carbon structure of activated carbons. The structure of activated carbon is understood to be closely linked with porosity of material. It is known that activated carbons are composed of disorderly micro graphite crystalline. The extent of disorder in activated carbons and chars depends on the process, processing conditions and chemical structure of precursor material. The basic structural units of activated carbons are, which are made up of small plane aromatic rings formed during carbonization stage, varied with changing the carbonization conditions and heat treatment temperature of processing parameters. It is reported that a short ordering between crystallites and small crystalline thickness is necessary to achieve super high surface area of activated carbons. For this purpose, Raman spectrometry is more promising tool to provide detailed information of structural variations of carbonaceous materials because it is sensitive not only to crystal structure but also to molecular structures. The Raman signals of graphite crystals result from vibrations and they are very sensitive to the degree of structural disorder. The study has exhibited that there are many structural variation of several commercially available activated carbons blank using Raman spectrometry [23]. T. H. Ko et. al. [24] studied the effect of steam and carbon dioxide activation on structure of polyacrylonitrile based activated carbon fabrics at different heating treatment temperature using Raman spectrometry. Actual physical and chemical structural of adsorbents are made elemental composition such as, carbon, oxygen, hydrogen and oxygen and ratio of crystalline graphite-like to amorphorous organic carbon depend on the starting materials and conditions of carbonization process residence time [24, 25] etc. In our laboratory, the work on development of microporous activated carbons and fabrics from different polymeric precursors using various processing parameters and methods is major activity during last two decades [18-20]. In our previous study, the effect of gasification time, gasification temperature, and flow rate on microporosity of ACS were investigated. The temperature of processing parameters to develop ACS from cross-linked PB may not affect porosity but also pore structure has not yet been reported in literature.
In the present study, the effects of heating rate on the porosity of ACS and influence of activation temperature on porosity of ACS and carbon structure were investigated. The pore structure of ACS was characterized by their N2 adsorption isotherms. The microstructure changes in ACS during different activation temperature were studied using Raman spectroscopy, CHNS analyzer and FTIR spectroscopy in order understand ACS from PB and its adsorptive capacity better. The change in porosity of ACS with activation temperature was also evaluated by SEM studies in detail.
The phenol (Ranbaxy Laboratories Limited Chemical Division S.A.S. Nagar), aqueous formaldehyde solution 37~41% w/v LR(s-d fine-Chem Ltd), poly (vinyl alcohol) (PVA, Mw 125,000) (s-d fine-Chem Ltd), triethylamine (TEA) 99% Lancaster Synthesis (Eeastgate White Lund, Morecaube, England), Hexamine LR (hexamethylenetetramine) (HMTA) (s-d. fine Chem. Pvt. Ltd.) and acetone AR (Samir Tech-Chem Pvt. Ltd.) were used as received.
The process to prepare of resole-type crosslinked PB from phenol and aqueous solution of formaldehyde by polymerization was described in our previous study [26]. The polymerization reaction was carried out by mixing phenol and formaldehyde in the presence triethylamine as initiator and aqueous solution of poly(vinyl alcohol) as stabilizer at agitation rate 550 rpm and temperature 96 ± 1℃ for 40 min. Then, hexamethylenetetramine as a cross-linking agent was added to the reaction vessel and polymerization was carried out at same temperature and agitation rate for 4 h. Finally, PB were obtained by filtration and washing with methanol following by water.
2.3. Carbonization and Activation
Physical activation consists of carbonization followed by activation of PB having particle size from 0.2 ~ 0.8 mm carried out under N2 of gas flow 2 L/min (STP) in vertical tubular furnace. In the first set of experiment, the PB were carbonized at different heating rates of 2.5, 5.0, and 10℃/min from room temperature to highest treatment temperature in the range 900℃ in N2 atmosphere and temperature was maintained constant at 950℃ for 2 h in CO2 gasification. The samples of ACS2.5, ACS5.0 and ACS10.0 were prepared at different heating rates 2.5, 5.0 and 10.0℃ at temperature 950℃ for 2 h respectively. In the second set of experiment, the PB were carbonized with heating rate 5℃/min from room temperature to highest treatment temperature 950 ~ 1050℃ in N2 atmosphere. The resultant chars were activated for different activation temperatures (950 ~1050℃) for 5 h.The samples of ACS900, ACS950, and ACS1050 were prepared at different activation temperatures 950, 1000 and 1050℃ for 5 h respectively.
2.4. Carbon Characterization Methods
Particle size and its distribution were measured using Mesh sieves of different sizes. The surface morphology of the particle was studied using Scanning Electron Microscope. The samples were sputter coated with gold before analysis. Thermal Gravimetric Analysis (TGA) was carried out by using TA instrument (TGA2950 High-Resolution Thermal Gravimetric Analyser). The specific BET surface area and pore structure parameters of ACS were determined from the adsorption isotherm of nitrogen molecule at 77 K using SORPTOMATIC 1990 Series (Thermo Finnigan). The BET equation was used to calculate the surface area [27]. Before measuring specific BET surface area and pore structure parameters, the samples were out-gassed at 250℃ in a vacuum oven for 5 h. The micropore volume of the ACS was determined from DR equation [28]. The total pore volume was obtained from the amount of nitrogen adsorbed at a relative pressure of 0.95 to the liquid nitrogen volume [29]. The subtraction of micropore volume (from the DR equation) from the total pore volume will give the mesopore volume [20].
Elemental analysis was carried out in a Carlo-Erba Elemental Analyzer. The ACS were grounded before for elemental analysis. The experiments were repeated thrice to obtained accuracy in the results. Raman spectra were recorded using Renshaw Raman Microspore using a 514 nm Ar line as excitation source at power of 10 mw. The scattering light was collected by CCD detector. The 4 ~5 scans were given at a resolution of 4 cm-1. The functional groups of ACS were detected by Fourier Transform Infrared (FTIR) Spectrometry (FTIR -2000, Perkin Elmer). The spectra were rounded from 4000 to 400 cm-1.
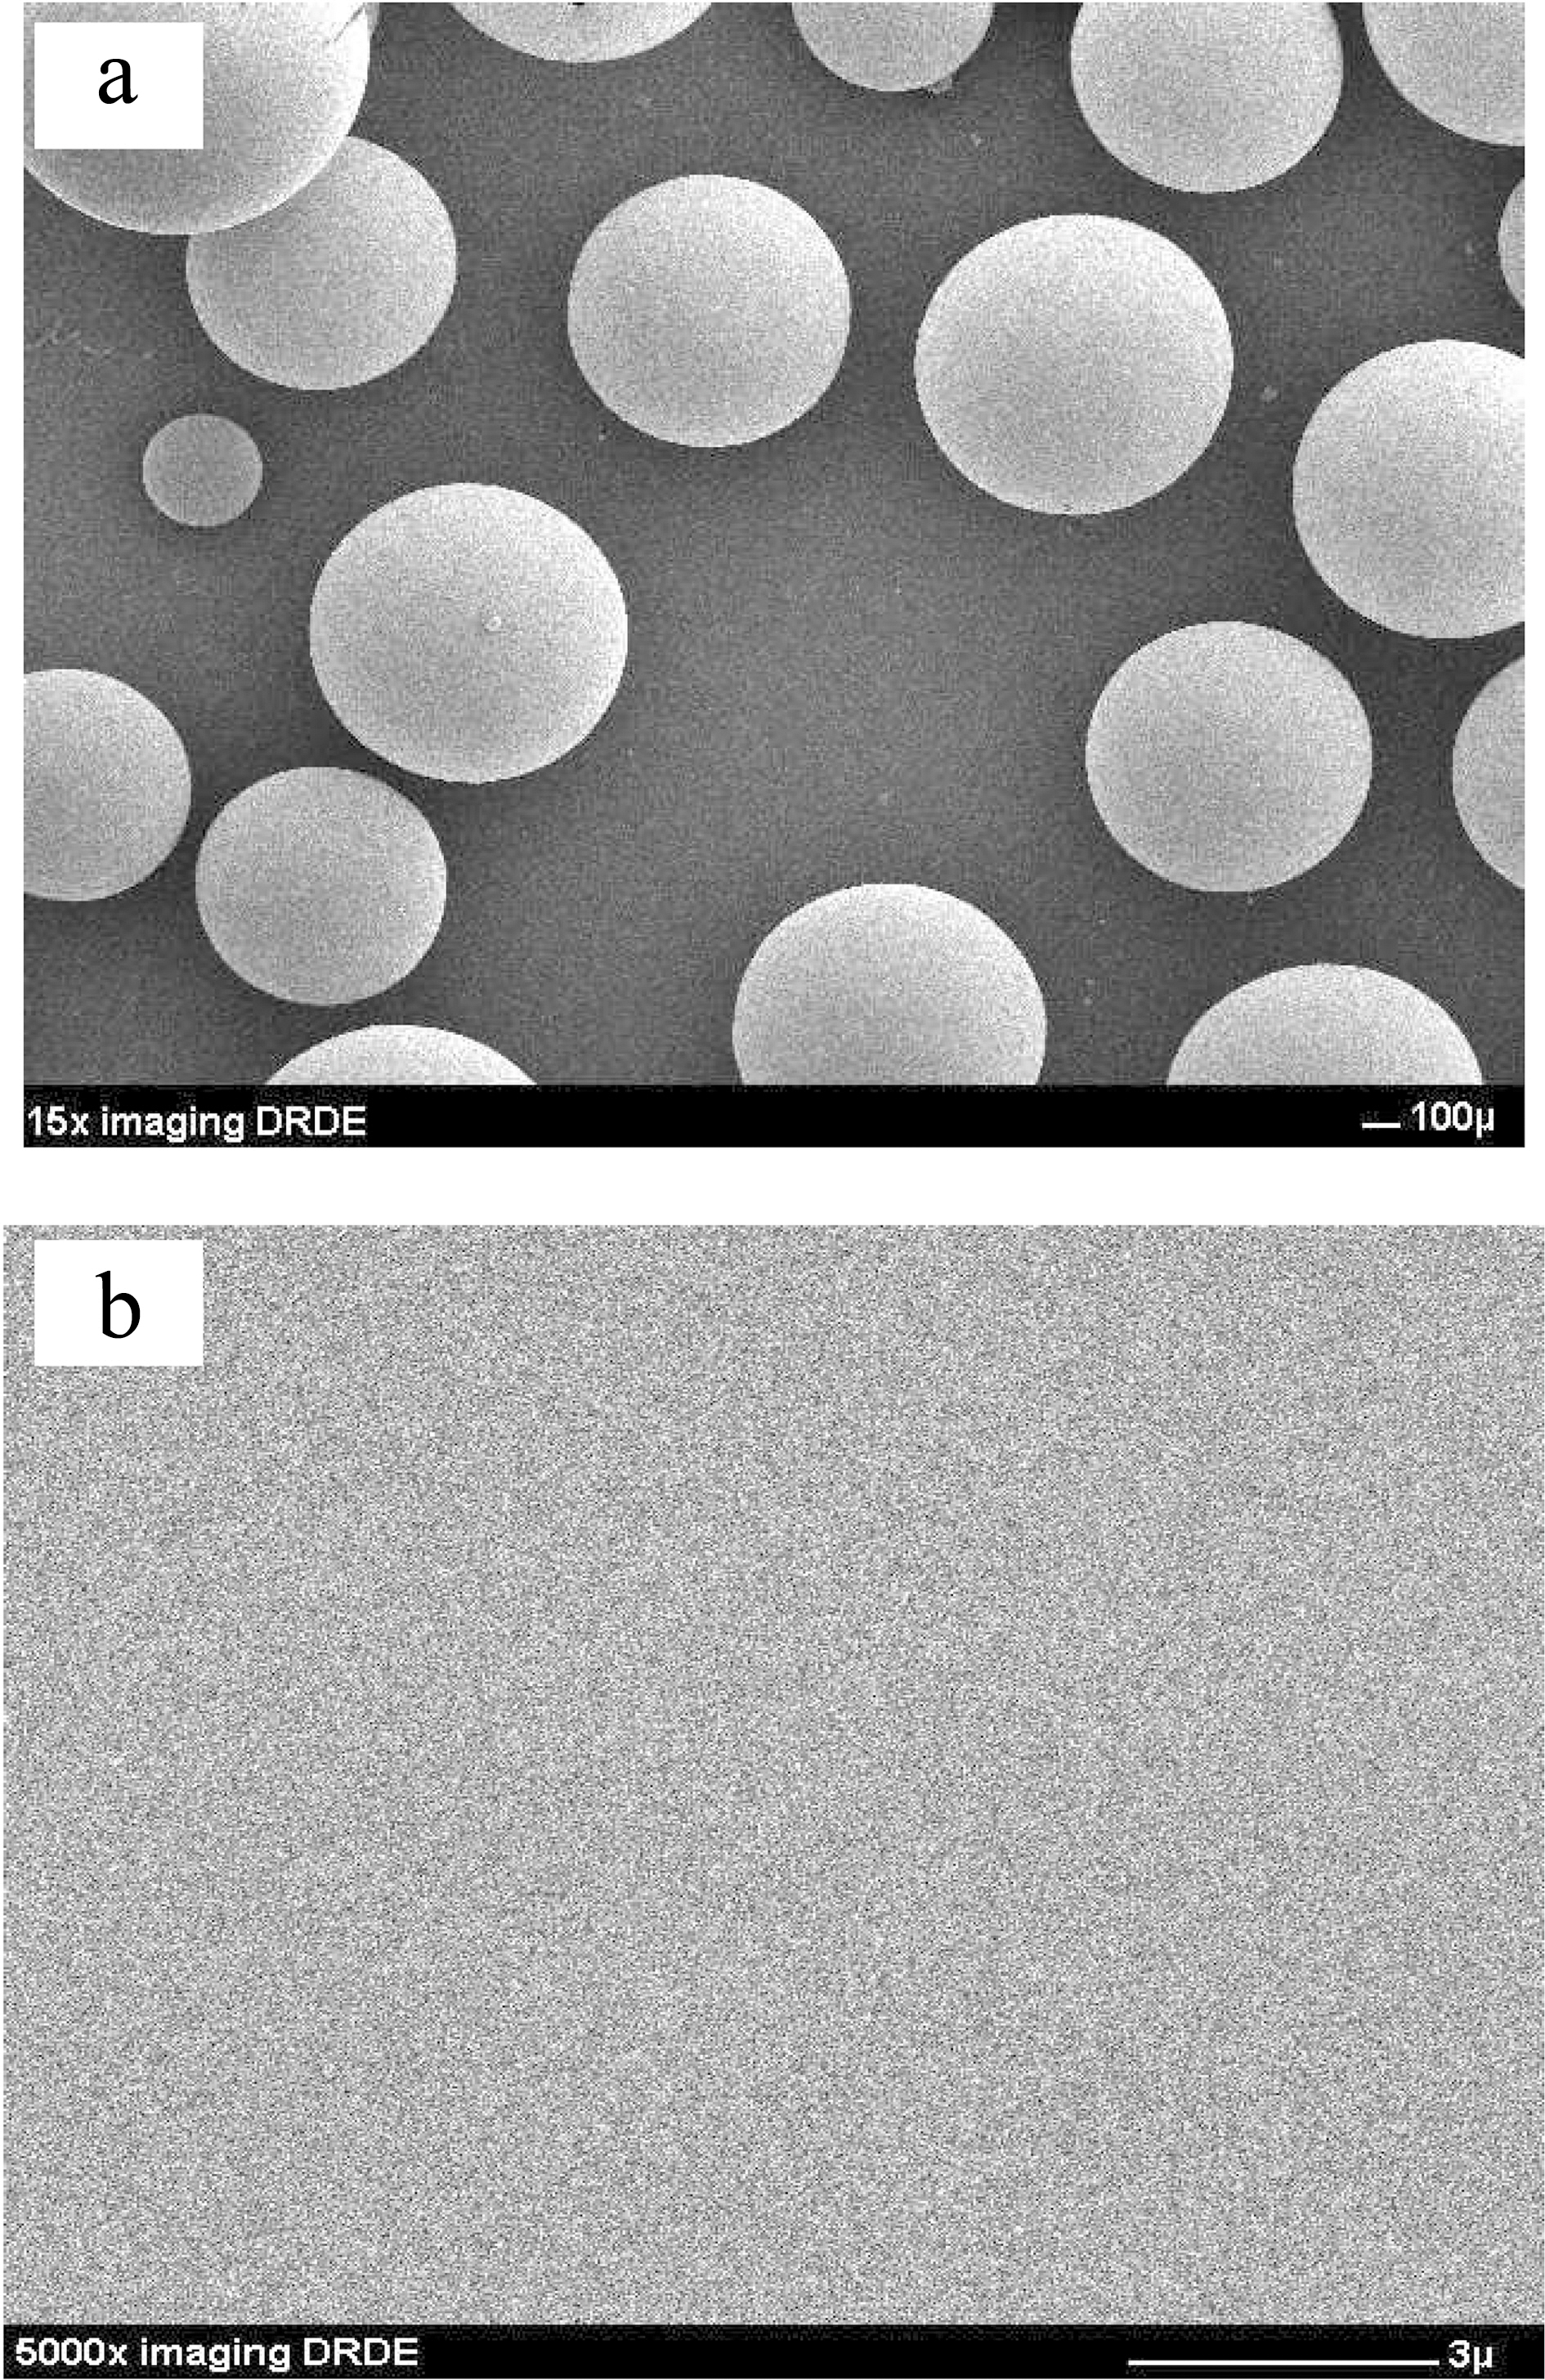
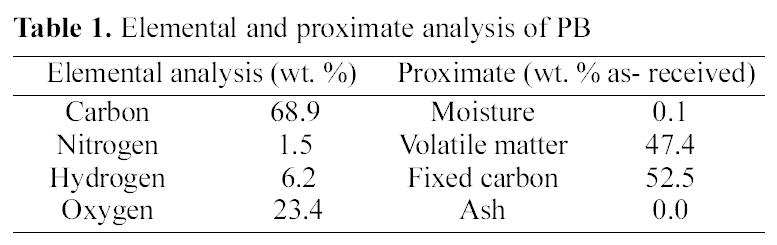
SEM image of Fig. 1(a) showed that resole-type of PB prepared above process was spherical in shape. External surface of PB was shown in Fig. 1(b) that they had a smooth surface and not meso- and macro-pore had seen in higher magnification (x5000). The elemental and proximate analysis of PB, which are reported on a dry-ash free basis and dry basis, were shown in Table 1 respectively. In the elemental analysis, PB were dried at 100℃ in a vacuum oven for 2 h and oxygen content were obtained by difference. The elemental analysis results showed that PB
[Table 1.] Elemental and proximate analysis of PB

Elemental and proximate analysis of PB
have relatively higher carbon contents as carbon, hydrogen, oxygen, and nitrogen contents of 68.9, 6.2, 23.4, and 1.5 respectively. PB had nitrogen contents (1.5%) showed in Table 1 indicating the incorporation of nitrogen to PB from hexamine during the polymerization reaction. In dry-basis analysis, ash, and volatile matter contents of PB were calculated on moisture-free basis. The proximate analysis of PB showed that the moisture, ash, and volatile matter contents were of 0.3, 0.0, and 35.1% respectively.
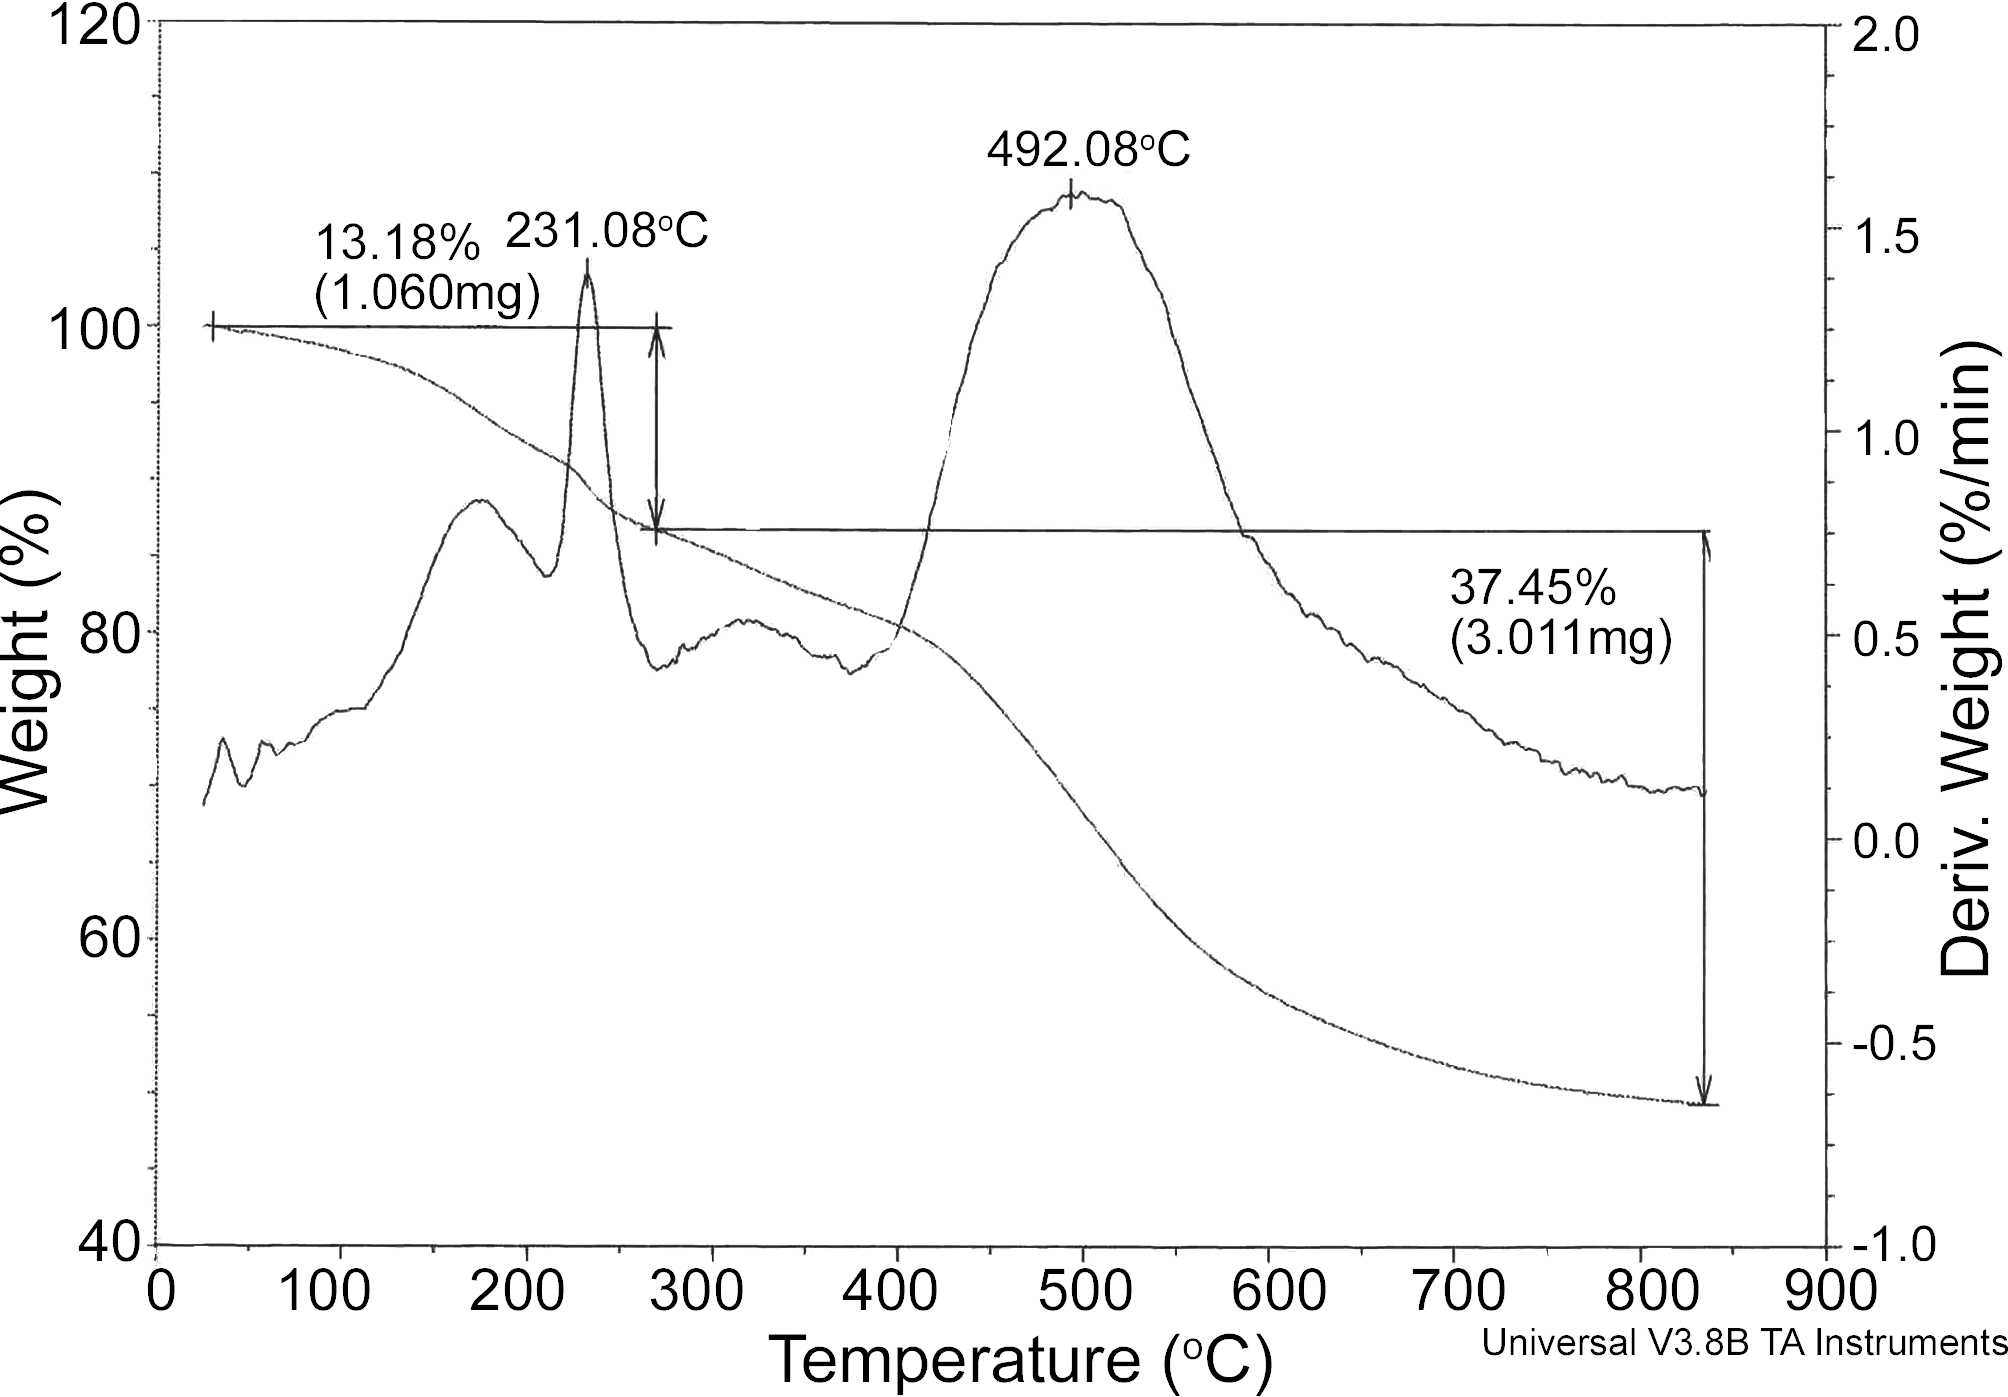
In order to simulate the carbonization process, PB were subjected to a thermal degradation of a TGA under N2 atmosphere at heating rate 10℃/min (Fig. 2). It is seen from
Fig. 2 that thermal degradation occurred at various stages. In the first stage, the loss of weight about 5% is due to the loss of moisture present in material. The second stage from temperature 200 ~ 400℃ may be attributed to loss of some
volatile molecules such as unreacted formaldehyde and phenol. The main loss occurred at 400 ~ 650℃ to release main quality of gaseous degradation products such as carbon monoxide, methane, phenol, cresols and xylends [30]. PB started to pyrolze at 450℃ and lasts to 600℃. The temperature above 800℃ a horizontal plateau appears which is indicates the end of the carbonization process. The char yield of about 45% of the starting PB after heating in whole range from room temperature to 900℃.
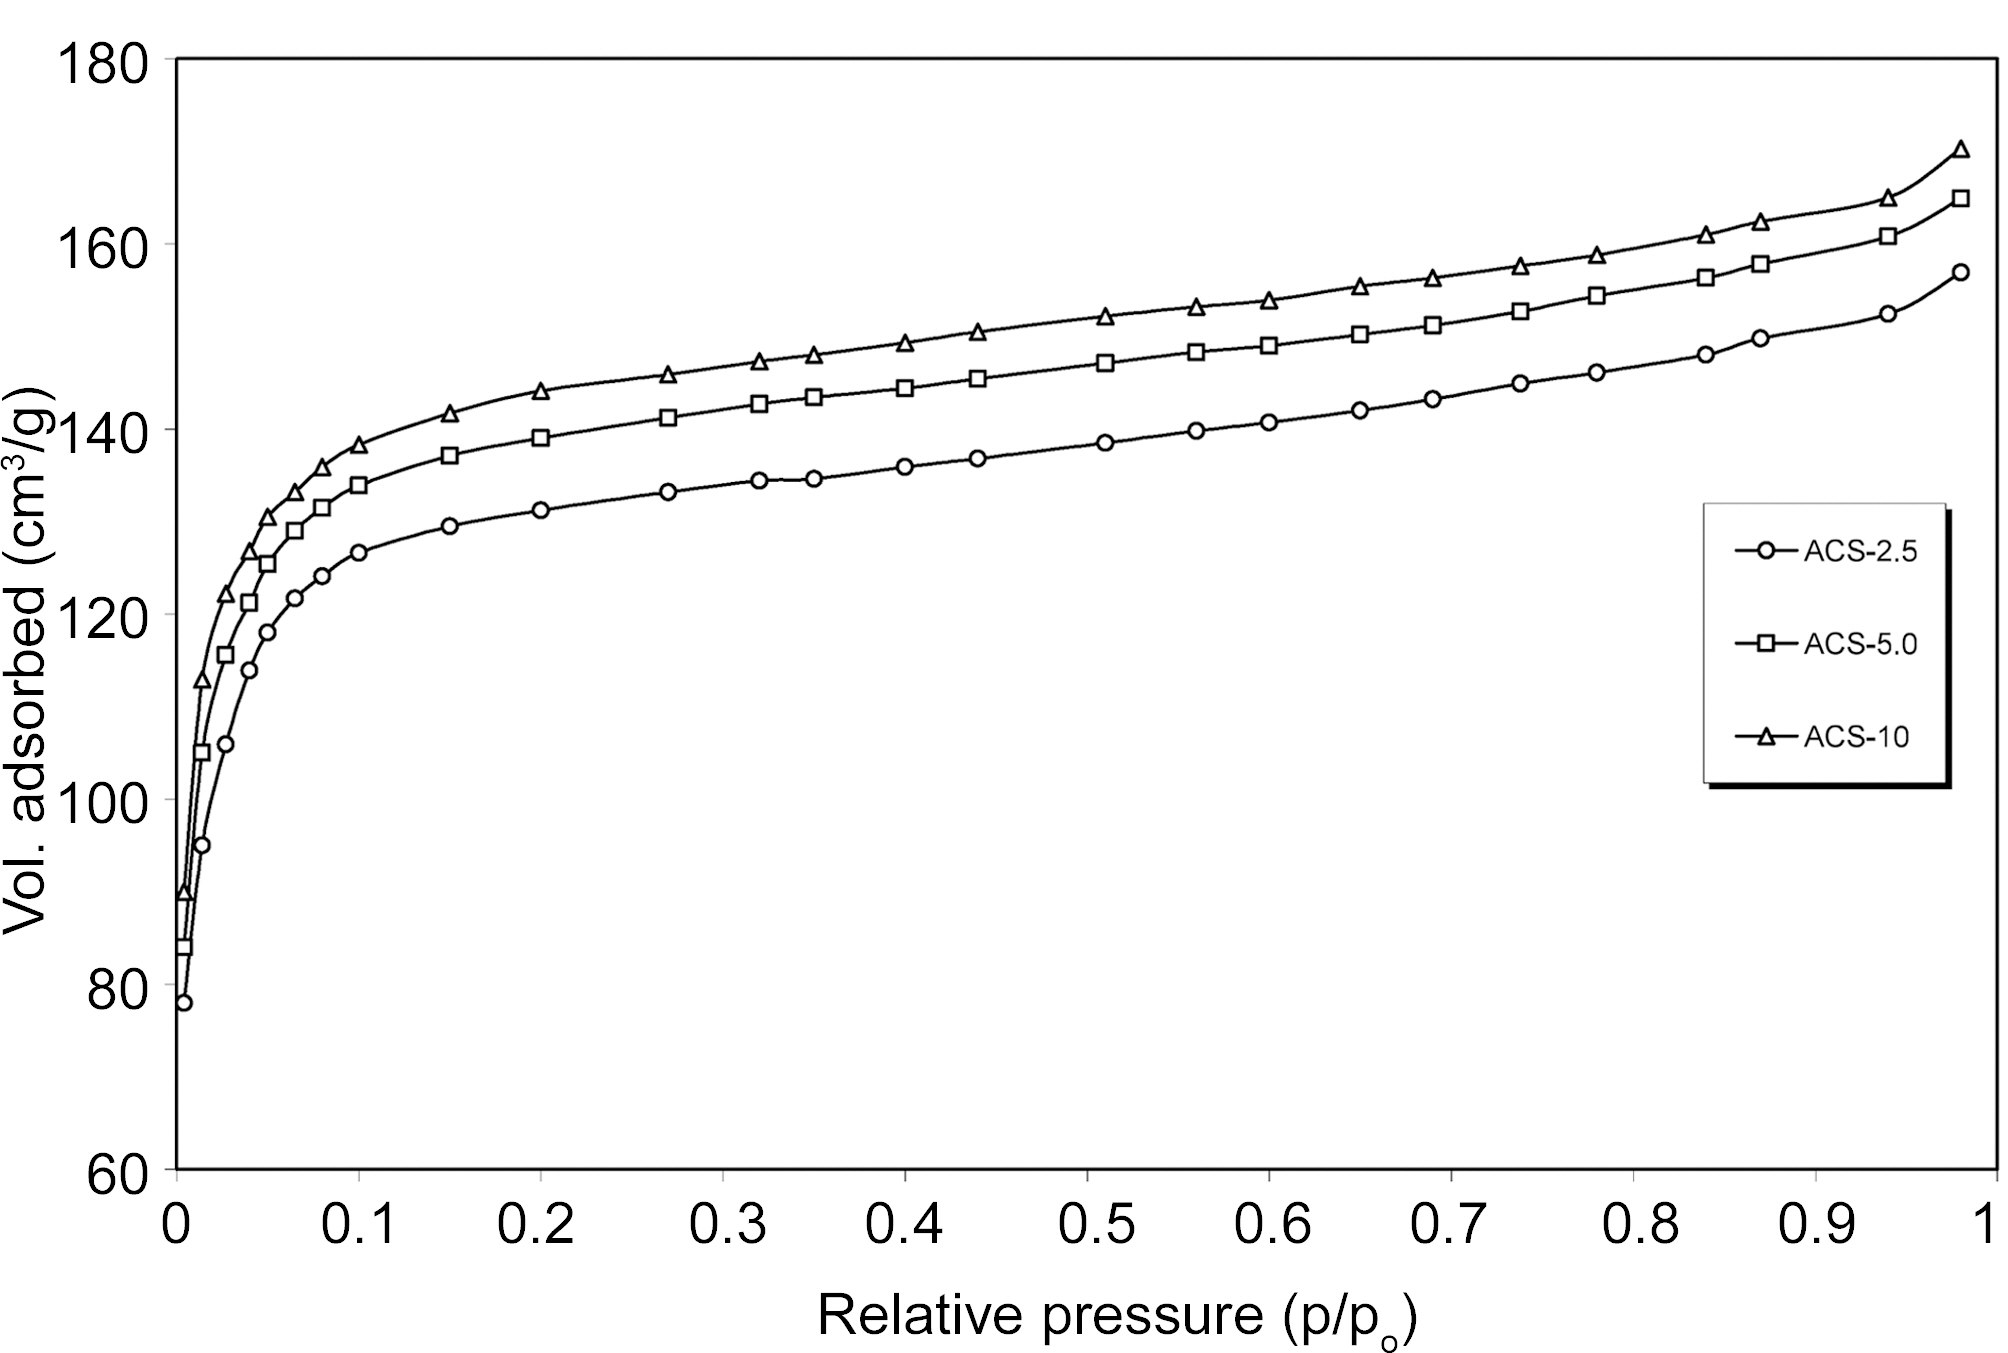
The porosity of ACS depends on carbonization temperature, heating rate, activation time, temperature, flow rate of oxidizing agent and type of precursor material used so for. The porosity development of ACS samples at 950℃ for 2 h with CO2 gasification at different heating rates 2.5, 5.0 and 10℃/min was investigated by N2 adsorption. Fig. 3 shows the horizontal plateaus of adsorption isotherms of ACS2.5, ACS5.0 and ACS10.0 at different heating rate 2.5, 5.0 and 10.0℃/min. This indicates that ACS samples are microporous and the adsorption capacity of ACS samples slightly increases with increasing heating rate.
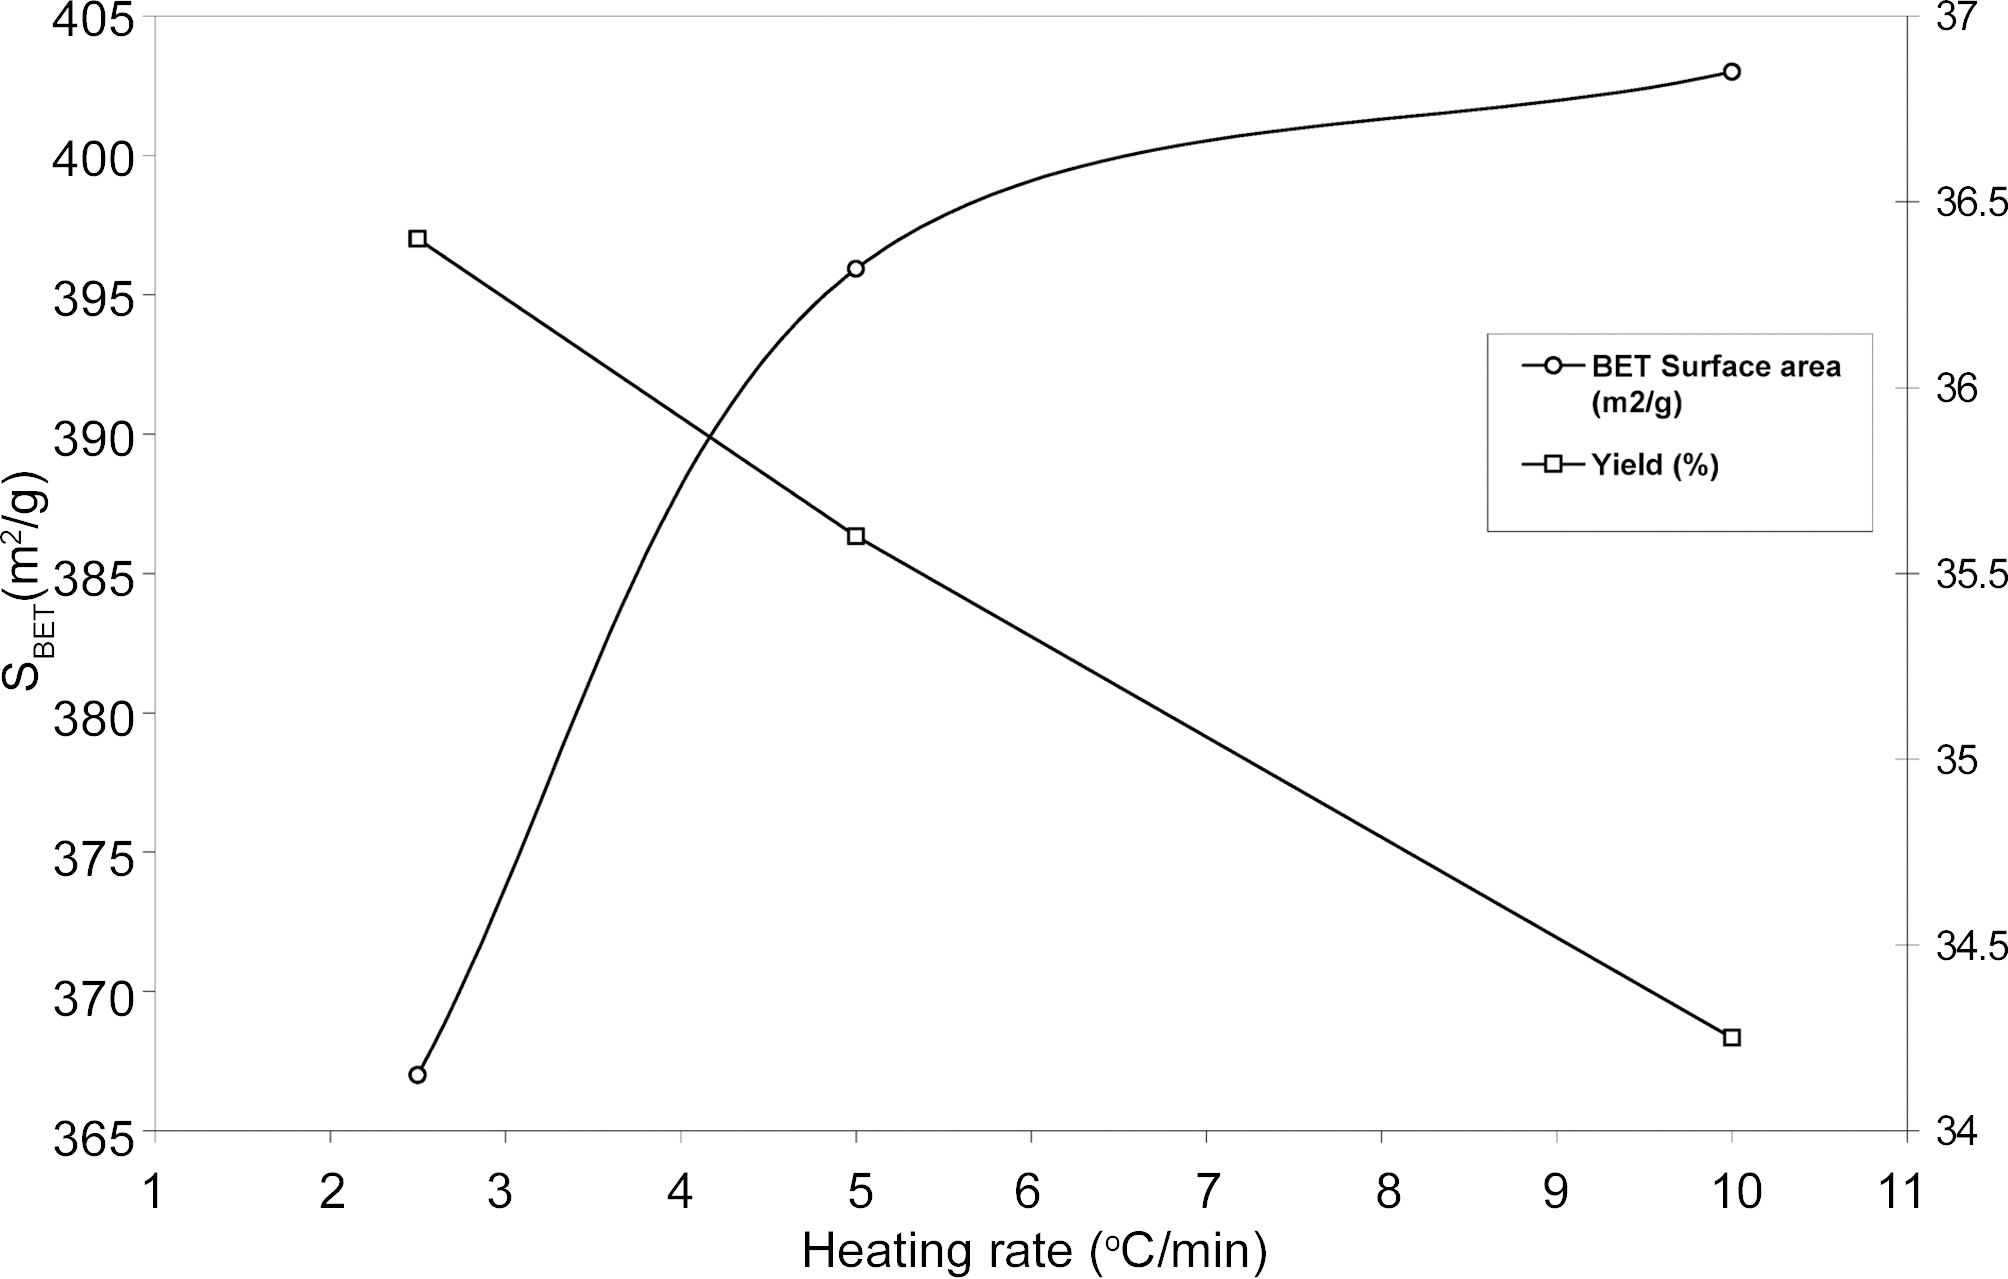
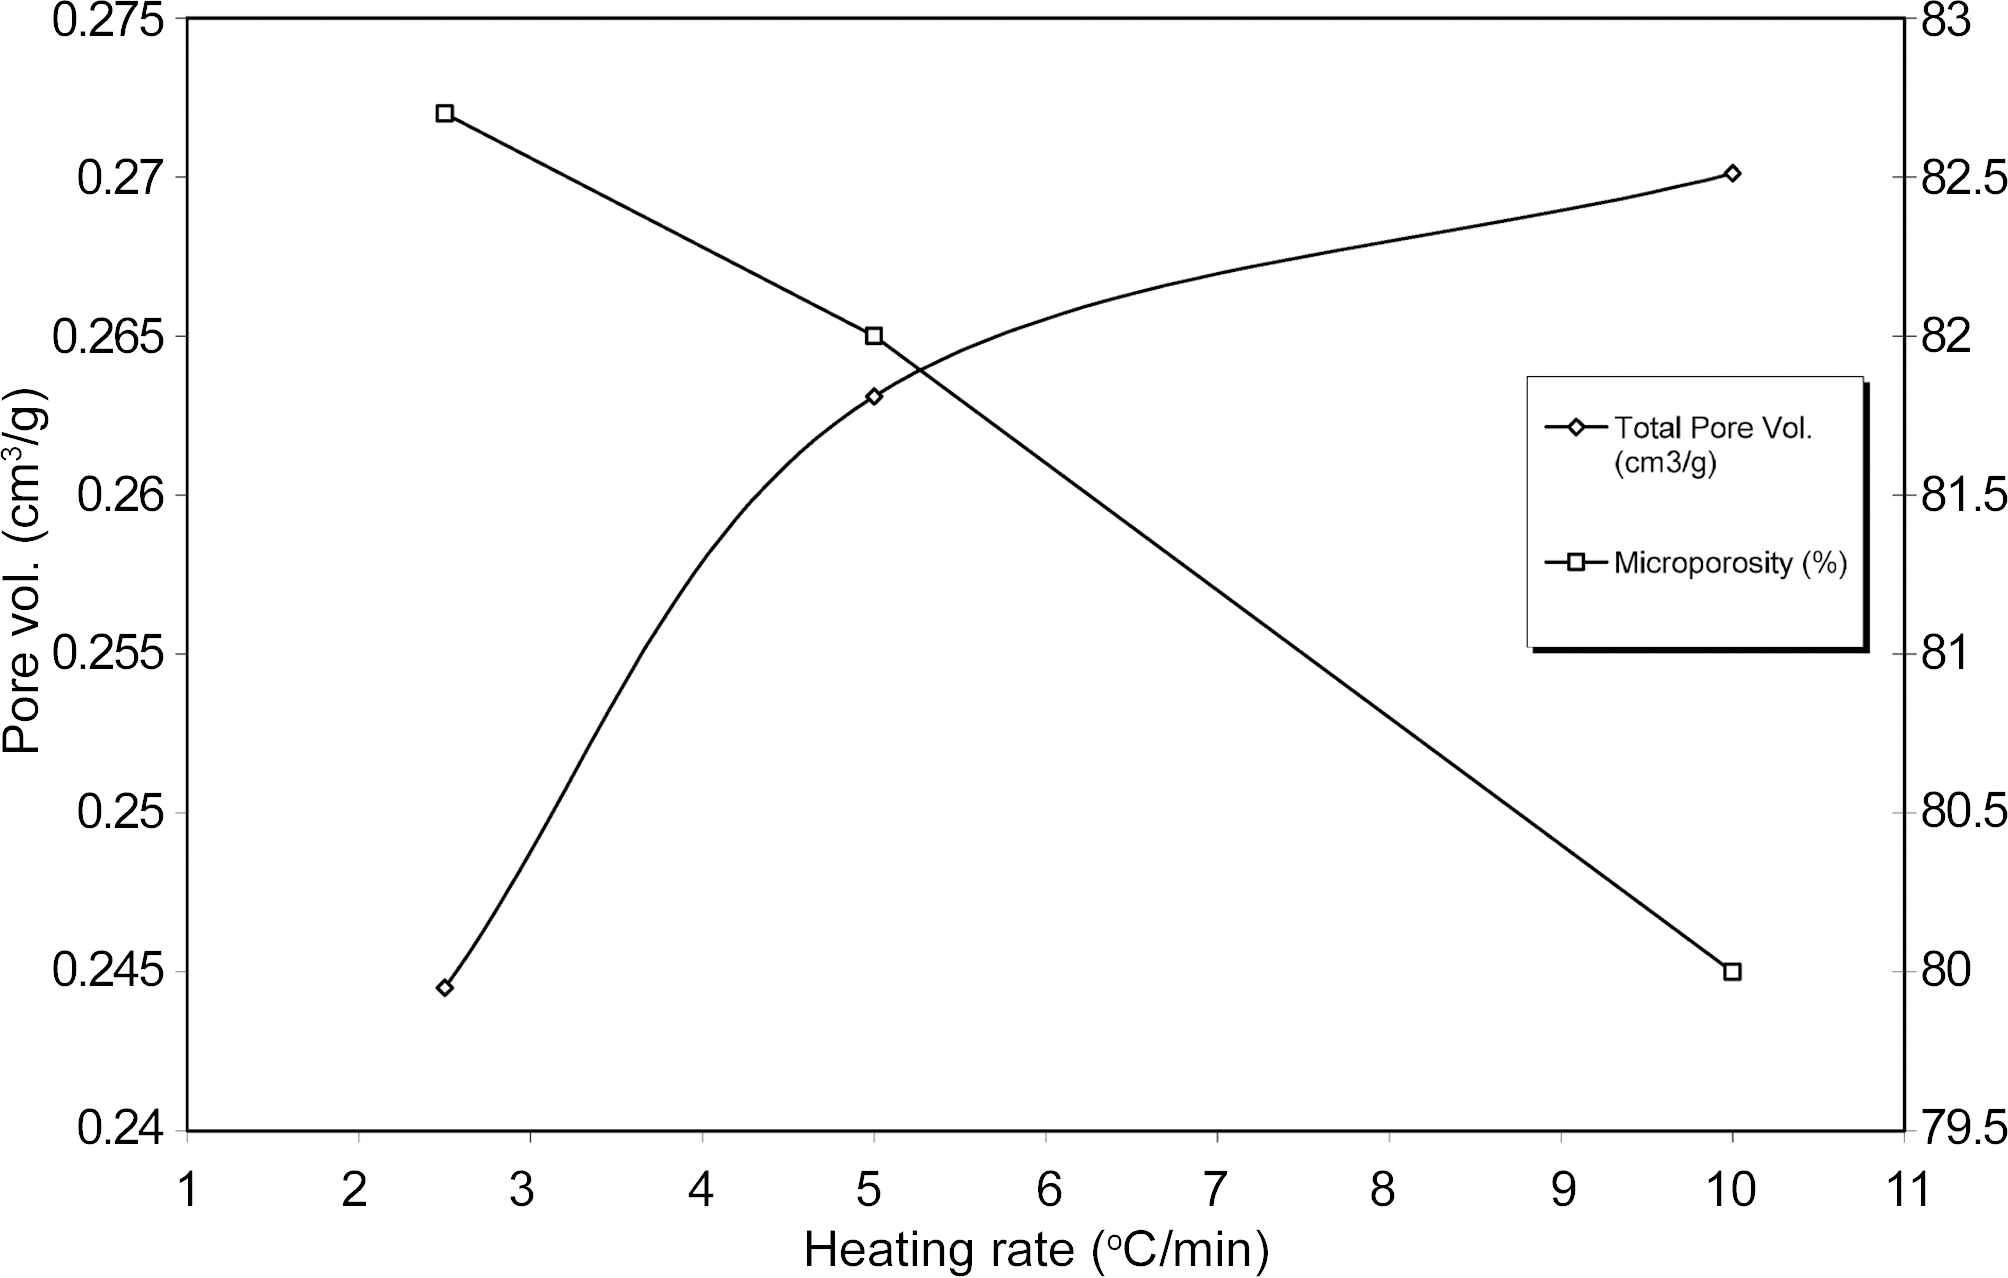
Fig. 4 & 5 shows specific surface properties such as BET surface area, total pore volume and micropore volume are obtained at different heating rate of resulting ACS samples. The results show that BET surface area and pore volume ACS are changed between heating rate 2.5℃ and 5.0℃ and after that there is little change in BET surface area and pore volume with increasing heating rate. It can be seen that yield, surface area and pore volume increase with increasing heating rate. It is generally observed that the carbonization process is evolved of volatile matter to form lamellar constituent molecular structure. The rate of escape of volatile matter during carbonization is play important role to mass transfer. The slower in heating rate implies a higher concentration of volatile matter evolved in the parent material.
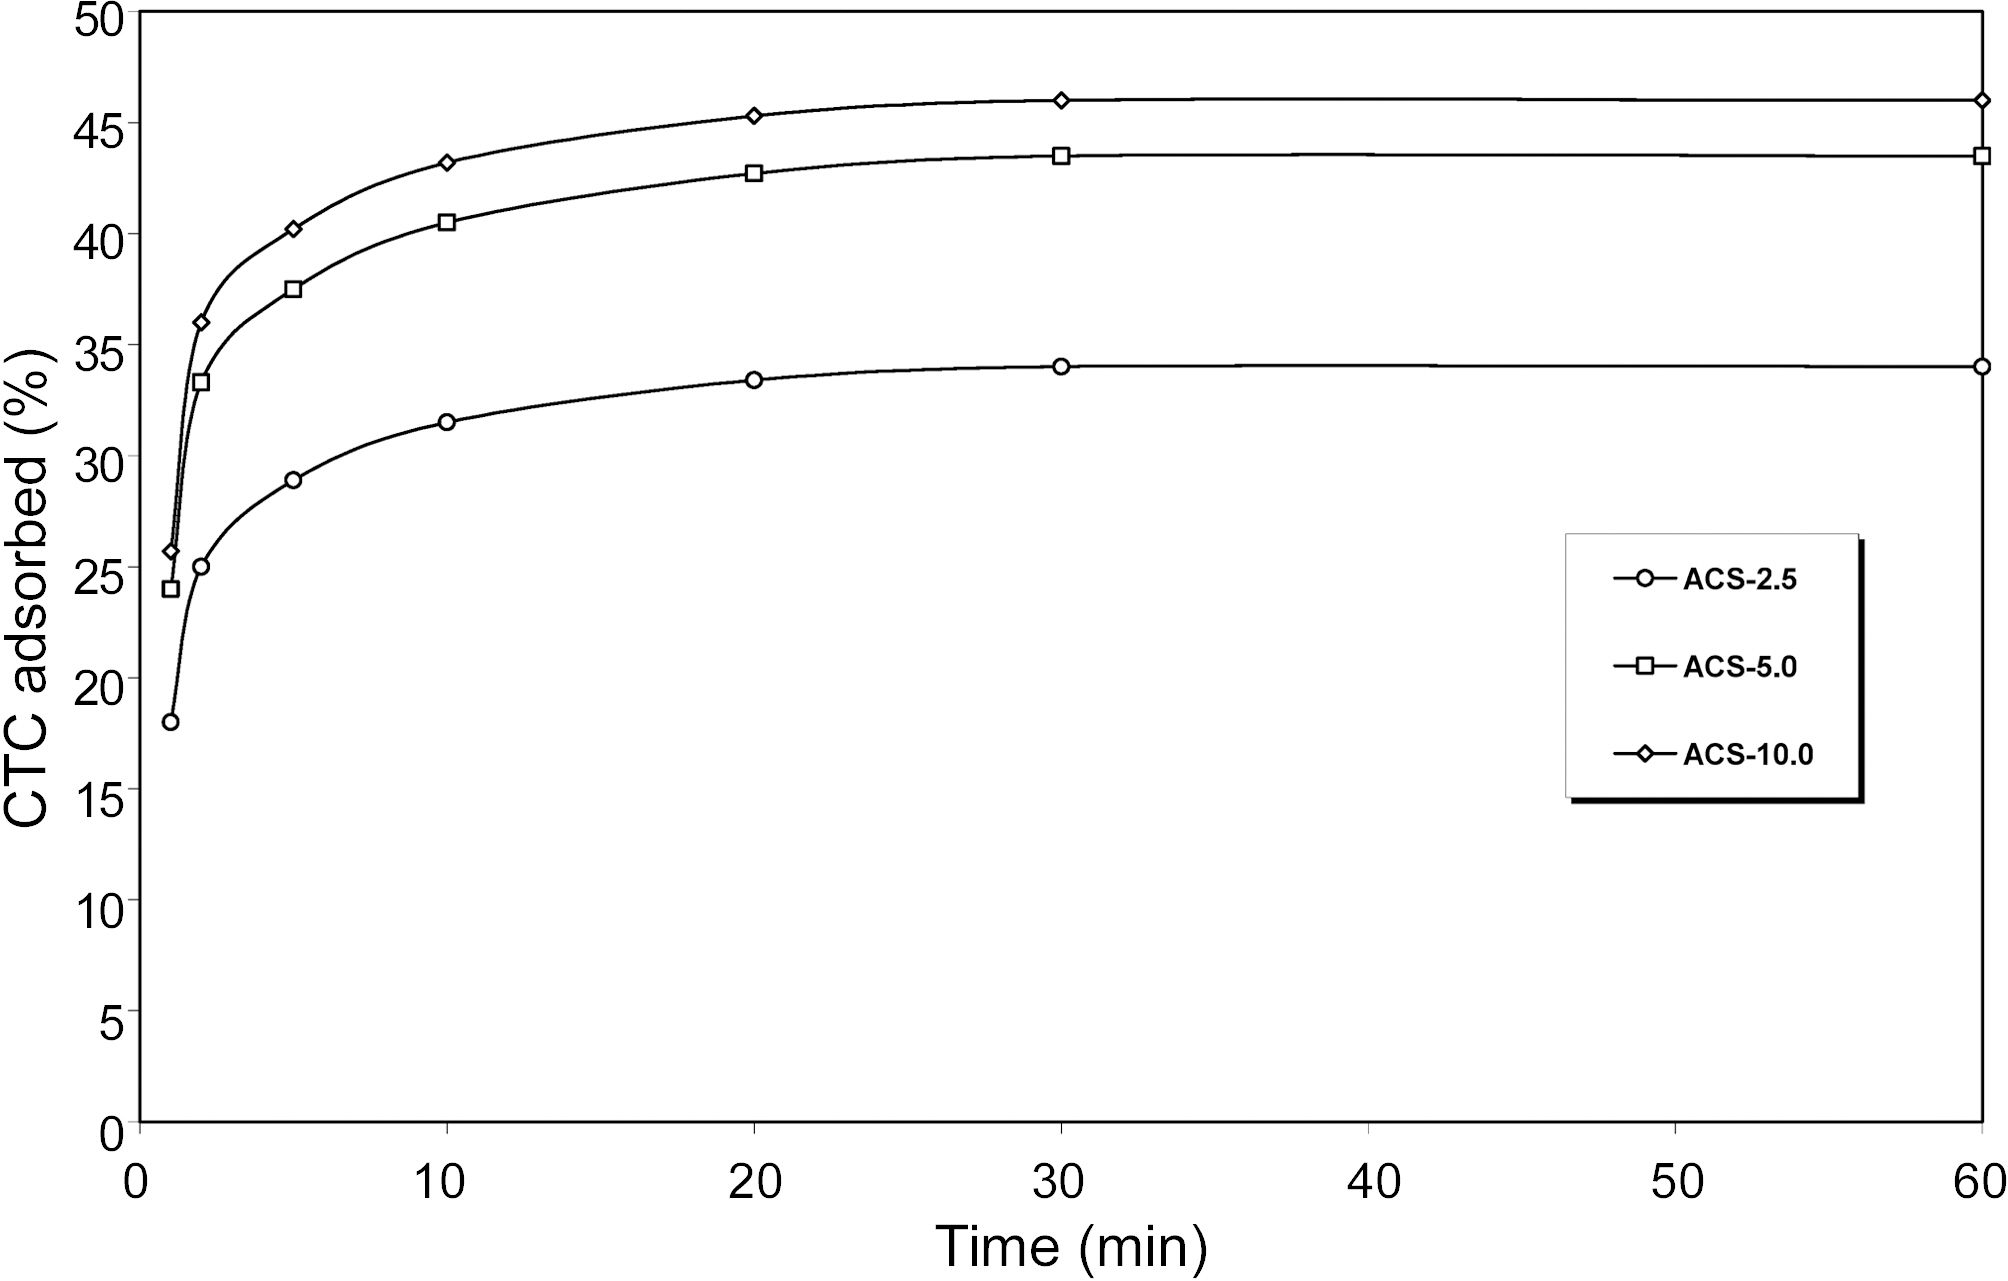
The adsorption capacity of ACS samples prepared at
different heating rate is further seen by adsorption capacity of carbon tetrachloride (CTC) as an adsorbate (STP). It is seen from Fig. 6 shows that CTC adsorbed fast in beginning and the maximum volume adsorbed within the min, after

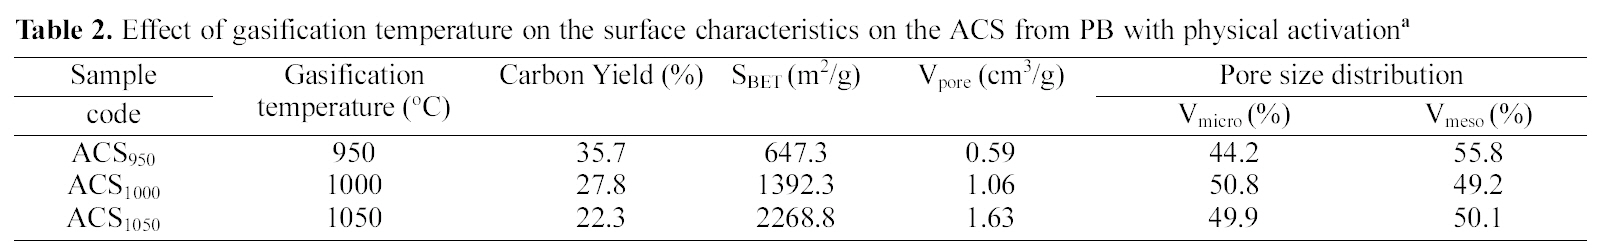
Effect of gasification temperature on the surface characteristics on the ACS from PB with physical activationa
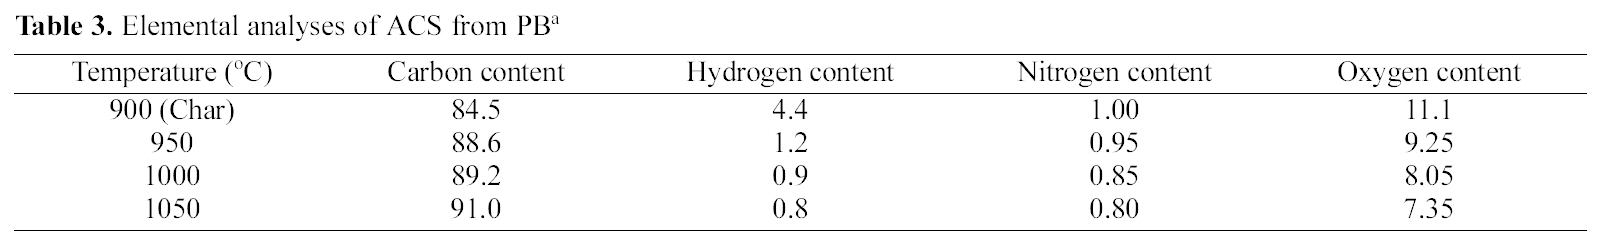
[Table 3.] Elemental analyses of ACS from PBa

Elemental analyses of ACS from PBa
that a horizontal plateaus was obtained which indicates that there is no further adsorption of CTC molecules with increasing adsorption time. Fig. 6 also that adsorption capacity of CTC increased with increasing heating rate. The CTC value of ACS is its adsorptive capacity that is related to the specific surface area. Generally, it is observed that the higher CTC adsorption capacity of ACS samples higher is the pore surface area.
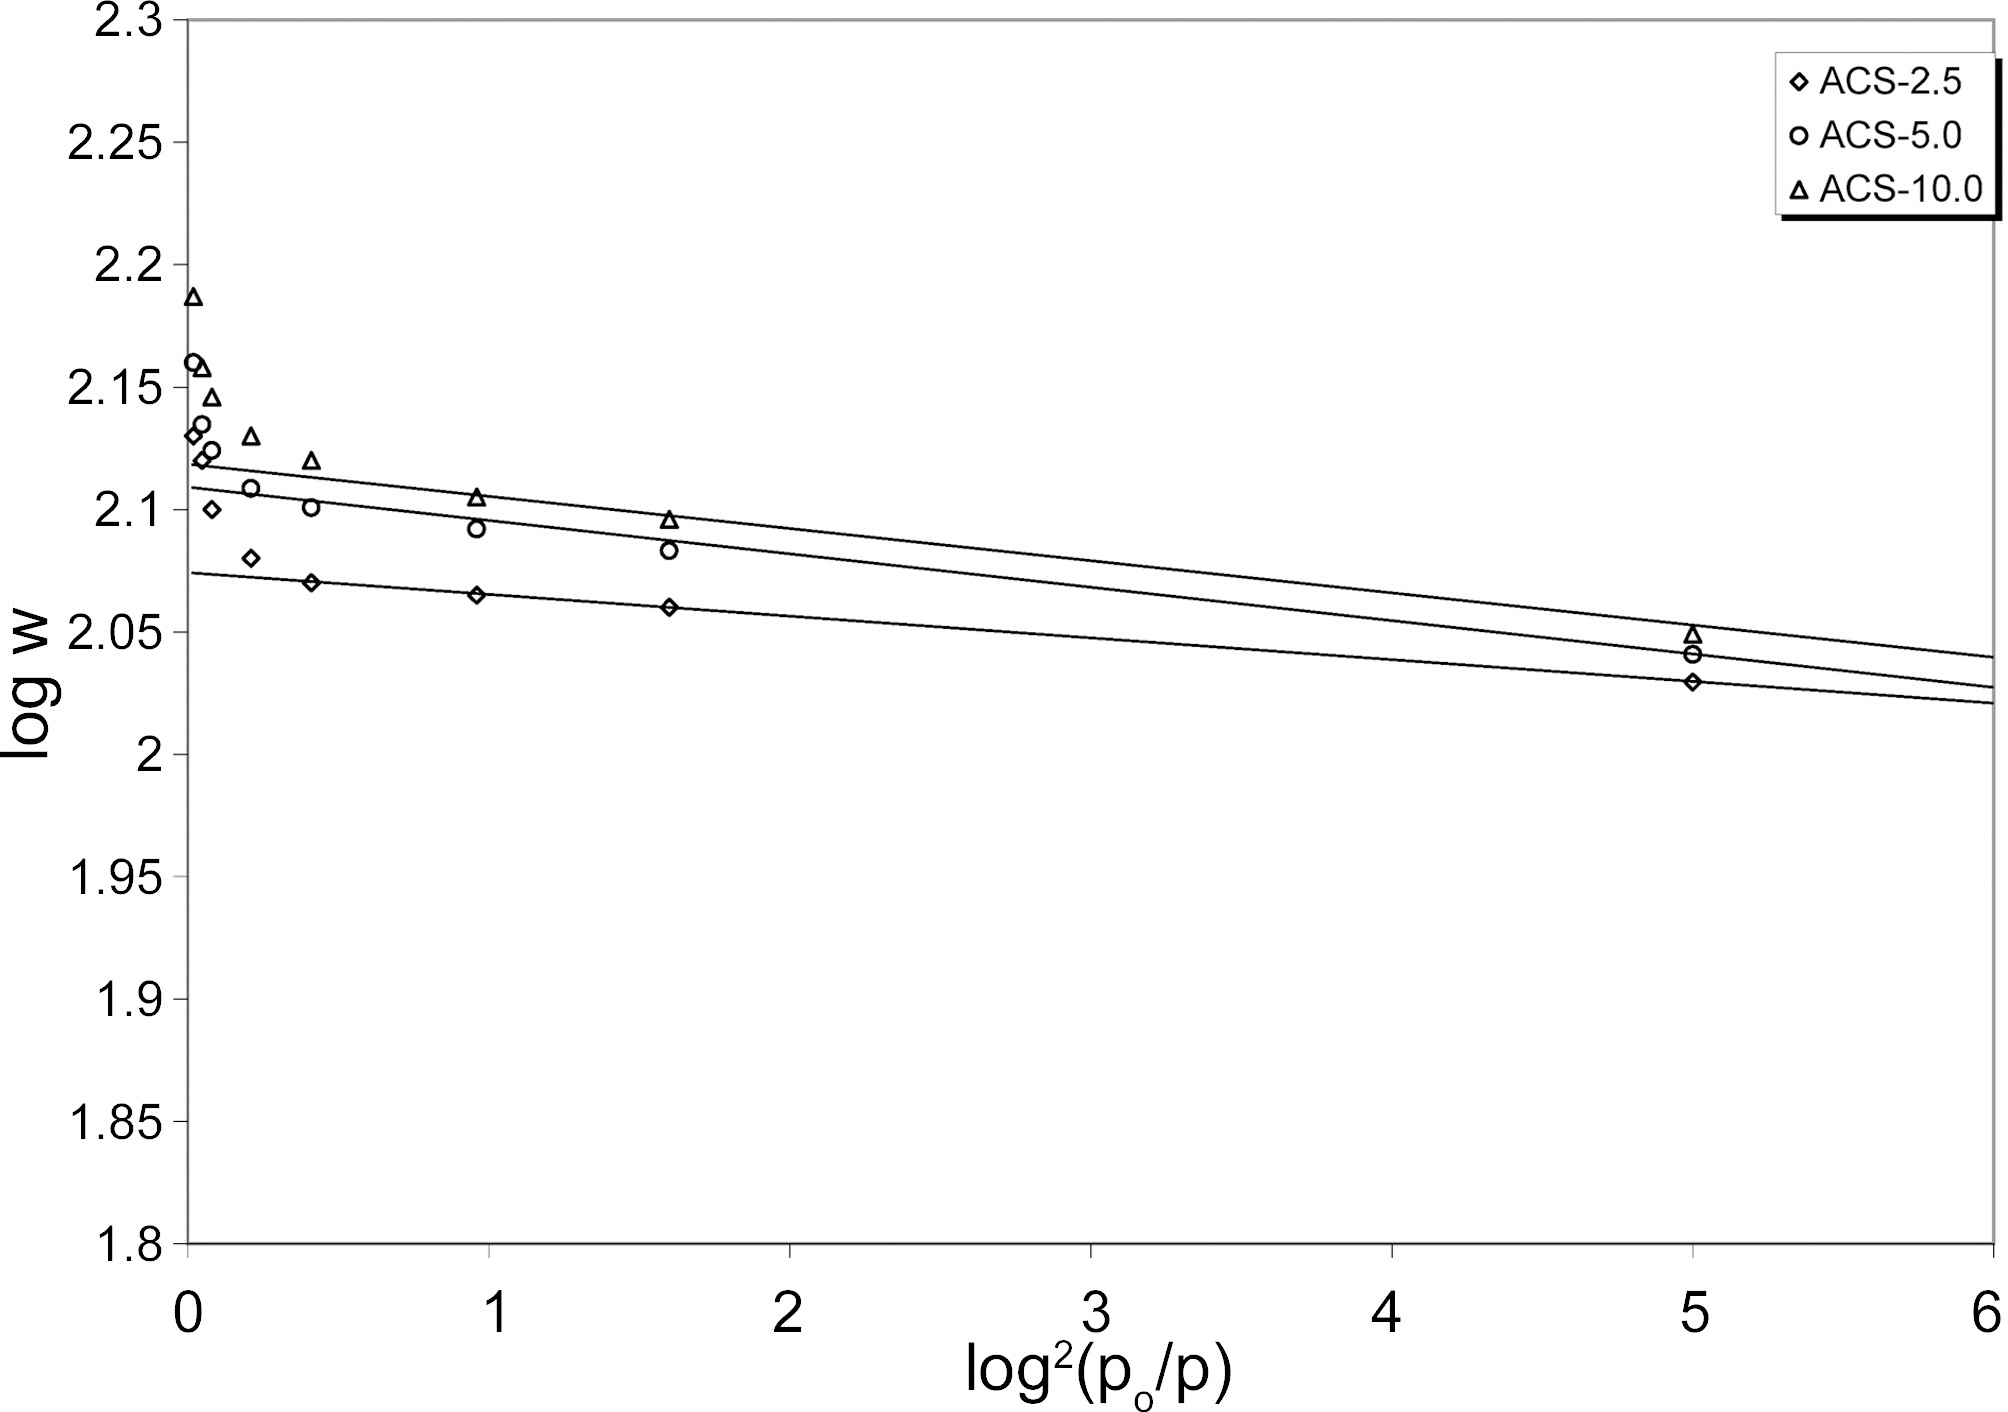
The microporosity of ACS is calculated by DR equation [31] given below:

Where V is the volume filled at temperature T and relative pressure p/po, Vo is total volume of the micropores, E0 is characteristics adsorption energy for standard, β is the adsorbate affinity co-efficient taken as 0.34 for nitrogen and R is gas constant.
The adsorption of gases by ACS samples can be well explained by DR plots between log V versus log2(po/p). The Fig. 7 showed the ACS samples gave nearly linearly plots over a wide range of relative pressure. At low relative pressure upward derivation of DR plots indicates the presence of mesopore. It can be seen from Fig. 7 that upward derivation points from DR straight line plots are slightly increased with increasing heating rate. The value of log V on y-axis gave the total micropore volume of ACS. The results of microporosity of ACS2.5, ACS5.0 and ACS10.0 samples with heating rate are shown in Fig. 5.
The effects of activation temperature on porosity ACS samples obtained at 950, 1000 and 1050℃ are shown in the Table 3. It can be seen from Table 3 that specific surface area of ACS samples increased with increasing temperature. The increase in porosity with gasification temperature can be attributed to enhanced carbon gasification as well as the
release of volatile, leaving space that was previously occupied by decomposed materials [34, 35]. ACS1050 prepared at 1050℃ temperature had shown BET surface area 2210 m2/g and at higher temperature than 1050℃ (which are shown here), the carbon matrix was breakdown which can be attributed to the thermal treatment, which causes the breakdown of crosslinks in the matrix.
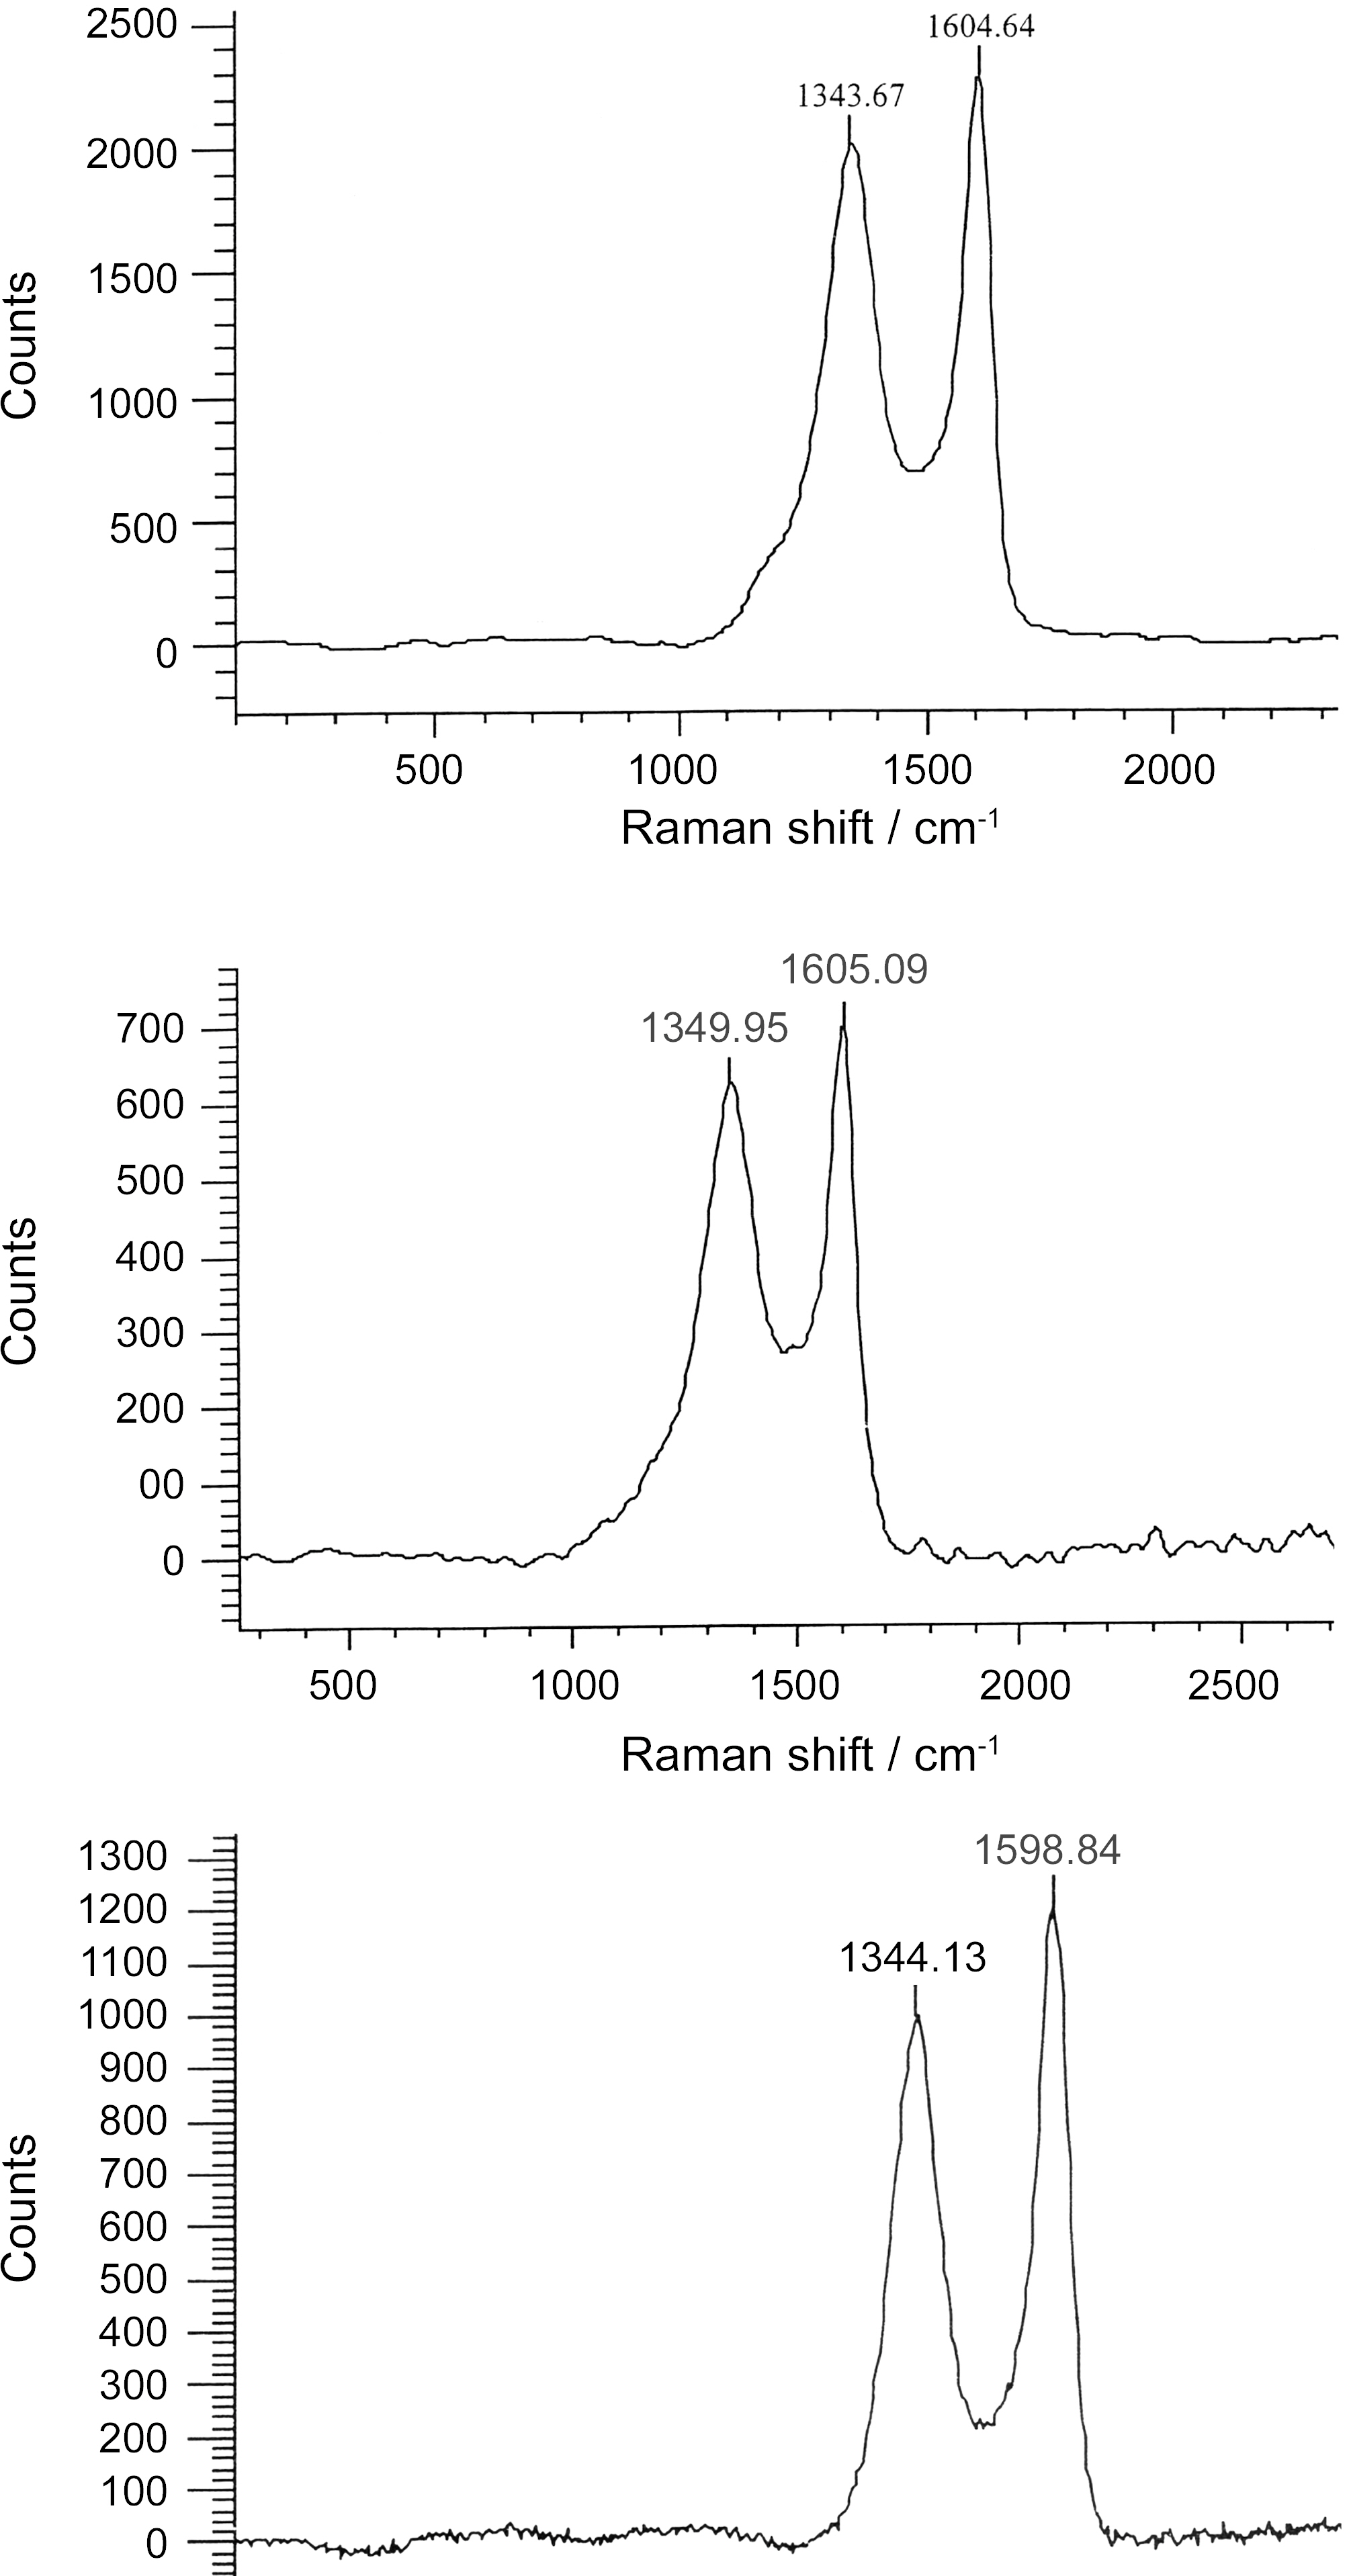
3.5. Carbon Structure using Raman Measurement and Spectral Analysis
Raman spectrometry is a very useful tool in investigating structural variations of carbonaceous materials [32]. The Raman spectra of ACS950, ACS1000 and ACS1050 samples prepared at 950, 1000 and 1050℃ activation temperature are shown in Fig. 8. There are two specific absorption peaks for ACS locates within the 1599 ~ 1605 cm-1 (G-mode) and 1340 ~1344 cm-1 (D-mode) respectively. The G-mode peak refers the normal graphite structures and D-mode represents the short-range turbostratic structures [33]. The R- value is peak intensities ratio of D-mode to G-mode. The G peaks and D peaks show increase with increasing activation temperature upto 1000℃, then it starts to decrease with increasing the temperature. The Raman spectroscopic parameters, such as frequency, half width at half maximum (HWHM) is shown in Table 2.
The relationship between G-peak and D-peak intensities are proportional to the degree of structural order [34] as shown R =ID/lG. The results show that the increase of the Rvalue indicates that the function of glass carbon was very random and these structures were amorphous contribution. Above 1000℃, the crystalline structure was lengthened and broadened therefore, the Lc and La decreased with increase the temperature. Above 1000℃ Lc and La decrease with increasing temperature, this may be due to rearrangement of the crystal structure.
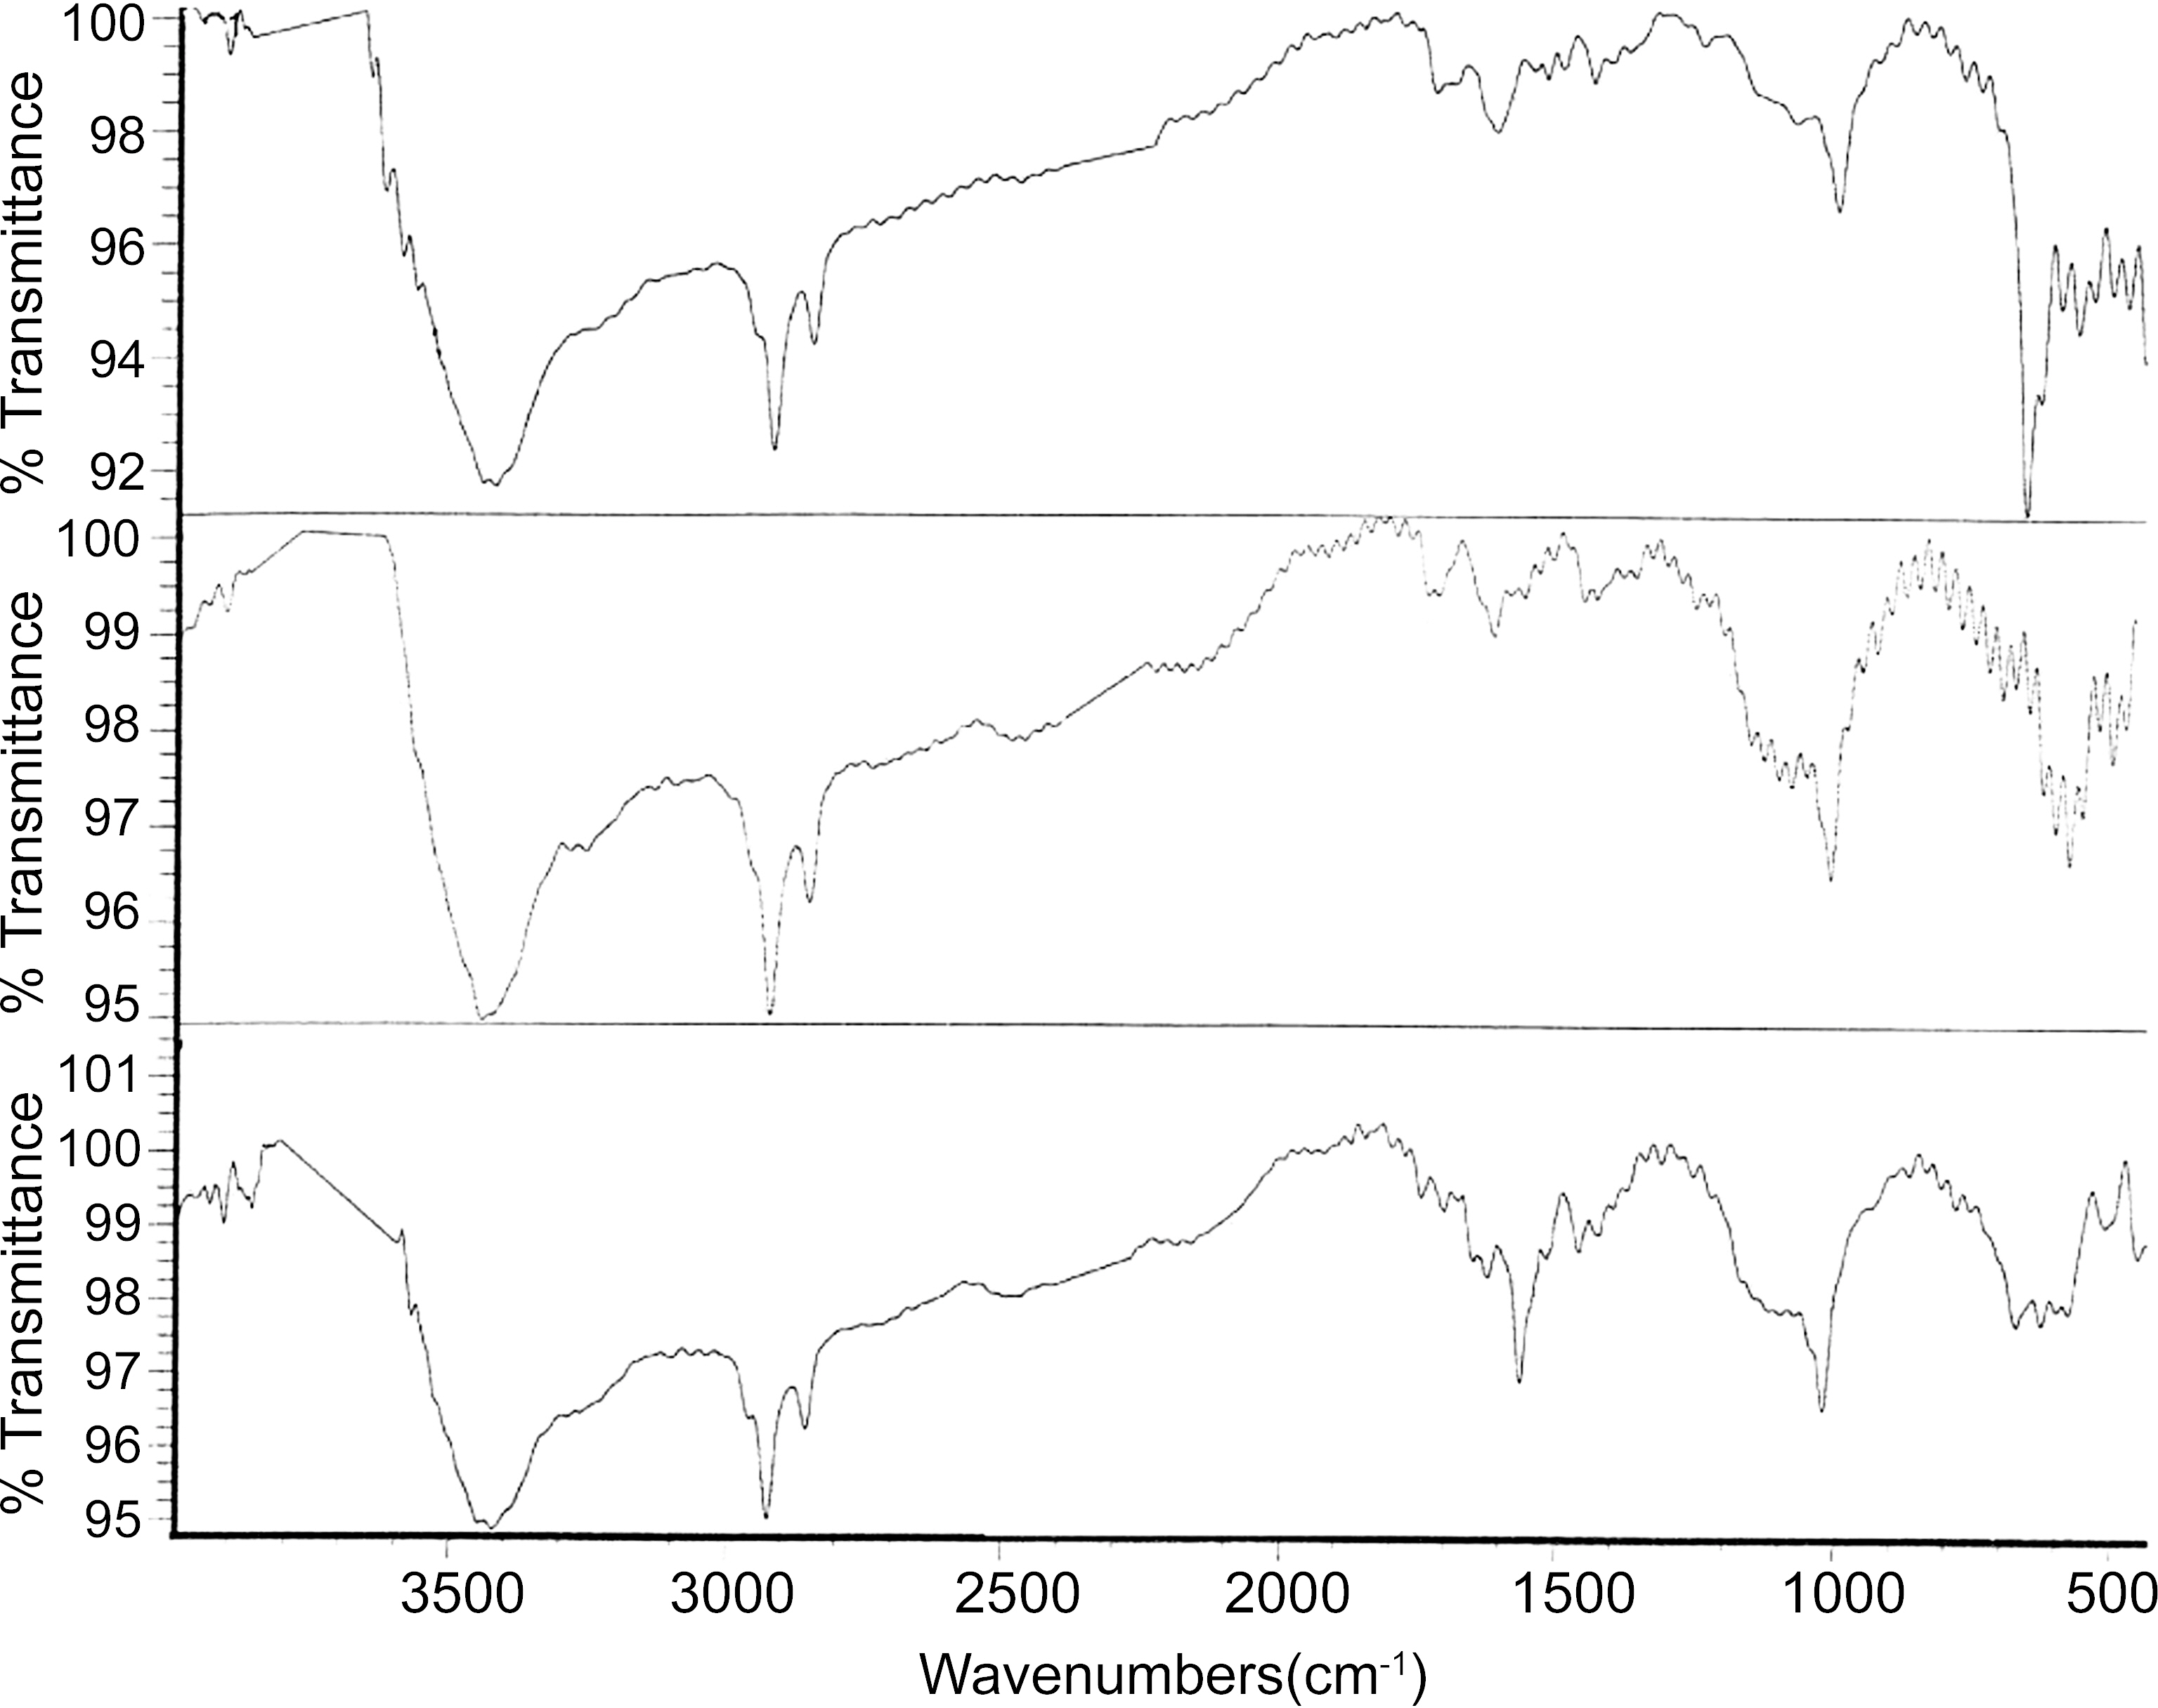
The FTIR spectra of the ACS950, ACS1000 and ACS1050 samples prepared at different temperature are shown in Fig. 9.The infrared spectroscopy was employed to show the functional groups in ACS prepared at different activation temperature. The Fig. 9 showed that all the spectra of ACS are almost same peak with their different relative intensities. The OH stretching vibrations on 3200~3600 cm-1 and deformation at 1362~1467 cm-1 reflect the presence of methylol group or phenol. The band at 2830~2930 cm-1 due to aliphatic C-C and deformation near 1477~1363 cm-1 indicates the presence of aromatic rings. The aromatic C-H out-of-plane is bending at 700~998 cm-1. The C-O stretching in 1000~1227 cm-1 indicates the presence of phenol, methylol or ether groups. The relative intensity of C-C stretching of ACS950, ACS1000 and ACS1050 samples increased with increasing temperature, which indicates ACS became more carbonaceous materials at high temperature. The results are well agreed with the results obtained by elemental analysis showing that the carbon content increasing with increasing activation temperature.
3.7. Elemental Analysis of ACS
The elemental analyses of the ACS950, ACS1000 and ACS1050 obtained from PB at different temperatures (950~1050℃) for 5 h are shown in Table 4. It can be from Table 4 seen that carbon content of ACS samples relatively increased with increasing activation temperature. The other elements such as
hydrogen, nitrogen and oxygen are comparatively decreased with increasing temperature. ACS1050 are more carbonaceous material compared to ACS950 and carbonized material. This indicates that higher temperature promotes to removal of volatile materials and enhanced the porosity in ACS.
3.8. SEM Observation for Porosity
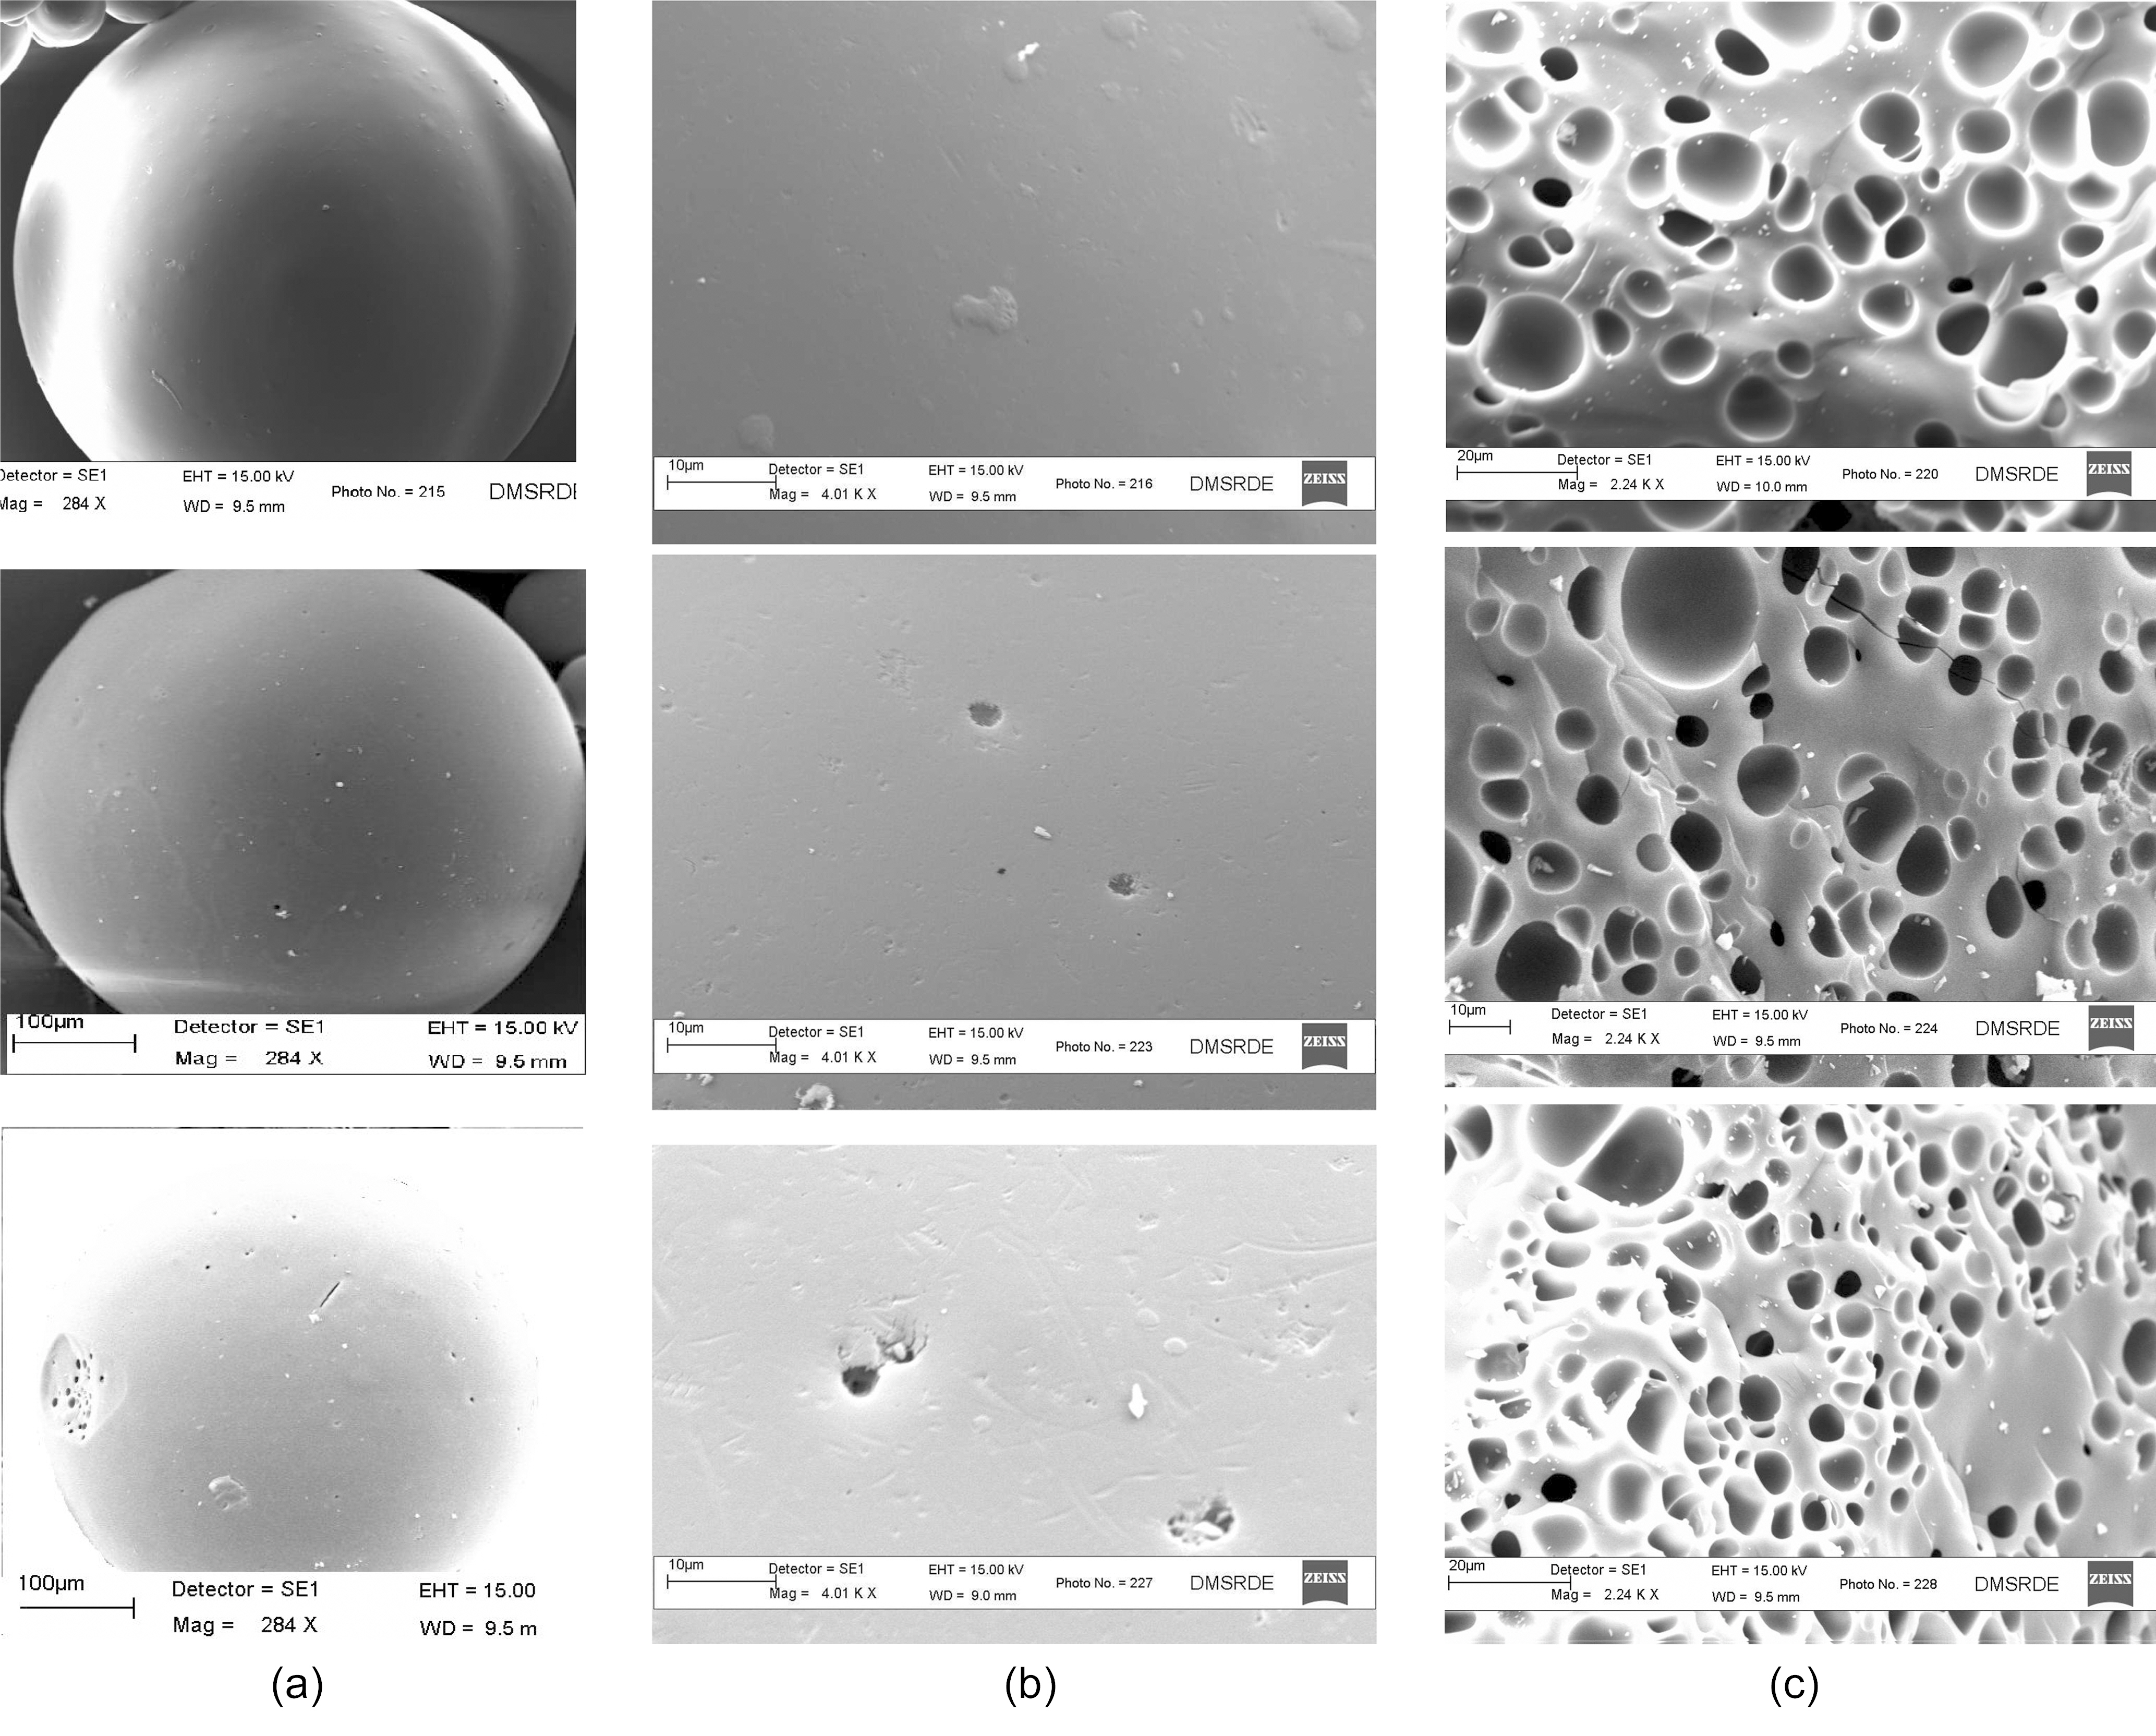
Fig. 10 (a~c) shows SEM micrographs single beads of ACS950, ACS1000 and ACS1050 prepared at different temperature for 5 h. Fig. 10(a) showed that ACS950 prepared at temperature 950℃ had shown no pores on external surface at low magnification. While, ACS1000 and ACS1050 samples prepared at temperature 1000 and 1050℃ from Fig. 10 (b,c) show that the macropores are developed on spheres surface. The pore size of ACS surface increased with increasing activation temperature. It is also seen that ACS had a smooth surface without any cracks, which had been seen in previous studies [16, 17].
Fig. 10 (d,e,f) of SEM micrographs shows the external
[Table 4.] Raman spectra analysis of ACS prepared at different temperature for 5 h in CO2 activation
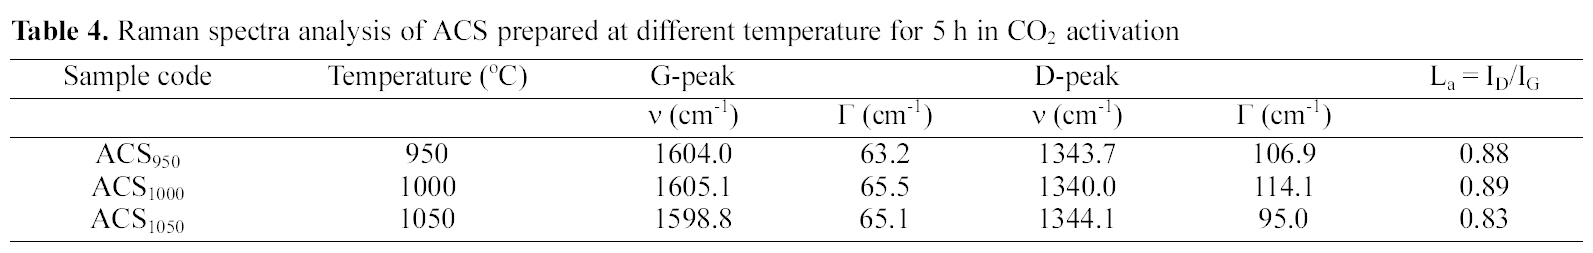
Raman spectra analysis of ACS prepared at different temperature for 5 h in CO2 activation
surface of ACS950, ACS1000 and ACS1050 samples which are obtained at high magnification. The images show that macropores on external surface significantly increased with activation temperature. It can be seen that no crack on external surface of ACS caused to reduce the mechanical strength and these are not promising material to develop ACS for commercial purpose.
The SEM photographs in Fig.10 (g,h,i) clearly showed internal surface pores which are similar for the samples ACS950, ACS1000 and ACS1050 prepared at different activation temperature. The pores in ACS are fully developed inside the carbon structure. ACS950 prepared at temperature 950℃ showed that pore or holes were not deeply opened, while the ACS1000 and ACS1050 prepared at temperature 1000 and 1050℃ showed that pores were clearly opened, resulting in a deeply inside the spheres. The ACS prepared at 1000 and 1050℃ temperature shows more uniform macro- and meso-porosity in its activated carbons compared to ACS950 at 950℃. Furthermore, SEM observations of ACS support the finding of relatively
lesser pores developed inside the sphere at low temperature as compared to well-developed pores of had seen ACS at high temperature.
In this study, the study showed that ACS with porosities can be prepared from PB at different heating rate and activation temperature using CO2 gasification. The results indicate that specific BET surface area, pore volume and proportion of mesopores of ACS were found to be increase with increasing heating rate and activation temperature. At high temperature (1050℃), the prepared ACS1050 sample have a higher adsorption capacity with BET surface area greater than 2200 m2/g. The Raman spectra shows that ACS are not composed of well crystalline graphite, but it is short range turbostatic structure. FTIR studies showed that ACS possessed functional groups and relative intensity of C-C stretching in ACS samples increased with increasing activation temperature, which indicates the ACS become more carbonaceous material. The results were further confirmed by elemental analysis that carbon content in ACS samples was found to increase with increasing temperature. SEM photographs showed that ACS have a well-developed pore structure and the shape of the internal surface significantly changes with increasing temperature.