Since the past decades, proton exchange membrane fuel cells(PEMFCs) have been receiving increasing attention as future energy source for various applications such as low/zeroemission electric vehicles, distributed home power generators,and power sources for small portable electronics devices due to their high power density, relatively quick startup, rapid response to varying loading, and relatively low operating temperatures [1-5].However, hindered by the high cost of precious metal such as Pt,which is the dominant electrocatalytic element in both anode and cathode catalyst layers. In addition, the Pt metal is also susceptible to CO poisoning [6,7]. Much effort has been made to lower the Pt usage and/or improve its CO-tolerance. One of the effective approach for that is alloying of Pt with transition metals such as Fe, Co, Ni, Sn [8,9], Bi, In, Pb, Cu [10,11] or with less expensive noble metals such as Ir [12,13], Ru [14-16], Au [17]and Pd [18]. Frequent attempts were made to use non-Pt-based metal or alloy such as Pd [18], Pd-Co [19] and Pd-Co-Au [20].Consequently, Ru has been proving as one of the most widely investigated promoters in Pt-based anode catalysts for low temperature fuel cells. Furthermore, catalyst support technology has been also proved as effective strategy to lower Pt usage and enhance CO-tolerance of the supported metal catalyst. Among various supporting materials, carbon is one of the most promising catalyst support candidates. Carbon has attractive characteristics such as high inertness under harsh chemical and electrochemical conditions, high surface area and electrical conductivity, well-developed porosity, adequate water-handling capability and low cost.
In the past, carbon blacks were mainly employed as supporting materials for fuel cell application. Uchida
CNTs are subject of great research interest due to their unique structure and excellent conductive properties. They offer potential applications as electronic devices, catalysts,sensors, field-emission devices, and hydrogen-storage media [31-38]. Since CNTs are chemically inert, activating their surfaces for metal dispersion is essential and this has motivated numerous studies to improve metal dispersions on other carbons also, mainly through optimization of the metal supporting procedures or functionalization of the carbon surface. The size and morphology of CNTs enable them to be a suitable catalyst support, in which active metal particles may disperse on the external walls or be encapsulated in the interior of the nanotubes. The metal particles on the external walls make contact with the reactant molecules more easily than those encapsulated inside the internal channels of the CNTs [39-42]. There are diverse methods for dispersing platinum metal on carbon materials or CNT supports. The aromatic ring system of the carbon nanotubes can be disturbed by the application of extremely aggressive reagents, such as HNO3 or H2SO4 or the mixture of both, which can open niches for functionalization with groups such as hydroxyl (-OH), carboxyl (-COOH) and carbonyl (>C=O) that are necessary to anchor metal ions to the tube. However, some of these reagents are known to open the tips of the tubules [43],causing damage to the tubular structure [44]. It may also introduce contaminants on the nanotubes [45]. The exact reason and the details of these undue oxidative processes are still unknown and remain matter of investigation.
In this paper, we have explored time and temperature dependent effect of diluted 4M H2SO4 solution on carbon nanotubes after using them as catalyst supports for PEM fuel cells. Raman spectra were used to analyze surface modification on raw CNTs after the treatment. XRD and TEM characterizations were carried out to determine the particle size and size distribution of the catalysts. These Ptbased catalysts were also employed as anode catalysts in PEMFC to investigate their catalytic activity and single-cell performance. The PEMFC performance test results indicate the catalyst prepared with CNTs treated for 0.5 at reflux temperature has better polarization performance than the commercially available Pt-Ru/C catalyst from E-TEK and Pt-Ru/CNT catalyst using raw CNTs, indicating effectiveness of acid treatment.
2.1. Surface treatment of CNTs
Raw MWCNTs (purity >90%) from Em-Power Co., Ltd Korea were used as received without any further purification process. The MWCNTs were first slowly oxidized using 4.0 M aqueous solution of H2SO4 at room temperature or by refluxing at 90oC, respectively. The surface treatment was carried out at various time intervals such as 0.5, 2, 4, and 24 h. The samples treated at room temperature are denoted as CNT-0.5h, CNT-2h, CNT-4h, CNT-24h and those at reflux temperature are marked as CNT-0.5hR, CNT-2hR, CNT-4hR,and CNT-24hR wherever mentioned throughout the article.
2.2. Preparation of carbon-supported catalyst electrodes
H2PtCl6·6H2O (Kojima) and RuCl3 (Aldrich), were used as metal precursors along with surface treated CNTs as supports for the synthesis of catalyst. Carbon supported Pt-Ru (60 wt%) catalysts were synthesized at room temperature by impregnation method using H2PtCl6·6H2O (Aldrich) and RuCl3 (Aldrich) as a metal precursor and NaBH4 as a reducing agent. The catalyst inks were prepared by dispersing various carbon-supported Pt-Ru catalysts into a mixture of an appropriate amount of deionized water and required amount of 5.0 wt% Nafion ionomer (Aldrich). The Nafion ionomer contents in the catalyst layers were set to be around 25 wt%. Suitable amounts of the catalyst inks were painted uniformly on Teflonized carbon paper (TGPH-090)and dried at 70°C for overnight.
As synthesized supported catalysts were characterized by various techniques. Transmission electron microscopy (TEM)was operated on EM 912 Omega at 200 kV. The scanning electron microscopy (SEM) images were obtained using a Hitachi S-4700 microscope operated at an acceleration voltage of 10 kV.X-ray diffraction (XRD) for carbons and supported Pt50Ru50 catalysts was carried out with a Rigaku 1200 using Cu KR radiation and a Ni a-filter and operating at 40 kV and 20mA.
Cell performance was evaluated using PEMFC single cell with a 6.25 cm2 cross-sectional catalyst area and measured with WFCTS fuel cell test station (WonA Tech Co., Ltd,Korea). H2 and O2 gases were supplied to the anode and cathode at flow rates of 200 and 500 mL/min, respectively,with zero back pressures. Prior to feeding H2 and O2 gases to the cell, they were humidified at a temperature of 15°C higher than that of the cells operating temperature.
The membrane electrode assembly (MEA) was made by hot-pressing (135°C, 2000 psi for 5 min). Pretreated Nafion-115 (Du-Pont) membrane was sandwiched between the anode and cathode, which had been prepared by painting a desired amount of supported catalyst ink on a Teflonized carbon paper (TGPH-090) and dried in an oven at 70°C for 1 h.The catalyst ink was prepared by mixing 100 mg of catalyst with 0.763 ml of 5.0 wt% Nafion solution, which was kept on stirring prior to use. The catalyst loadings at anode and cathode were 0.4 mg/cm2 (based on Pt-Ru, only) and 0.4 mg/cm2(based on Pt, only; 20 wt% Pt/C catalyst from E-TEK),respectively. The Nafion-115 membrane used was pretreated first by boiling in 3.0 wt % H2O2 for 1 h followed by boiling again in 0.5 M H2SO4 for 1 h. The single cell test fixture was composed of two steel end plates and two graphite plates with rib-channel patterns allowing the passage of hydrogen gas to the anode and oxygen gas to the cathode.
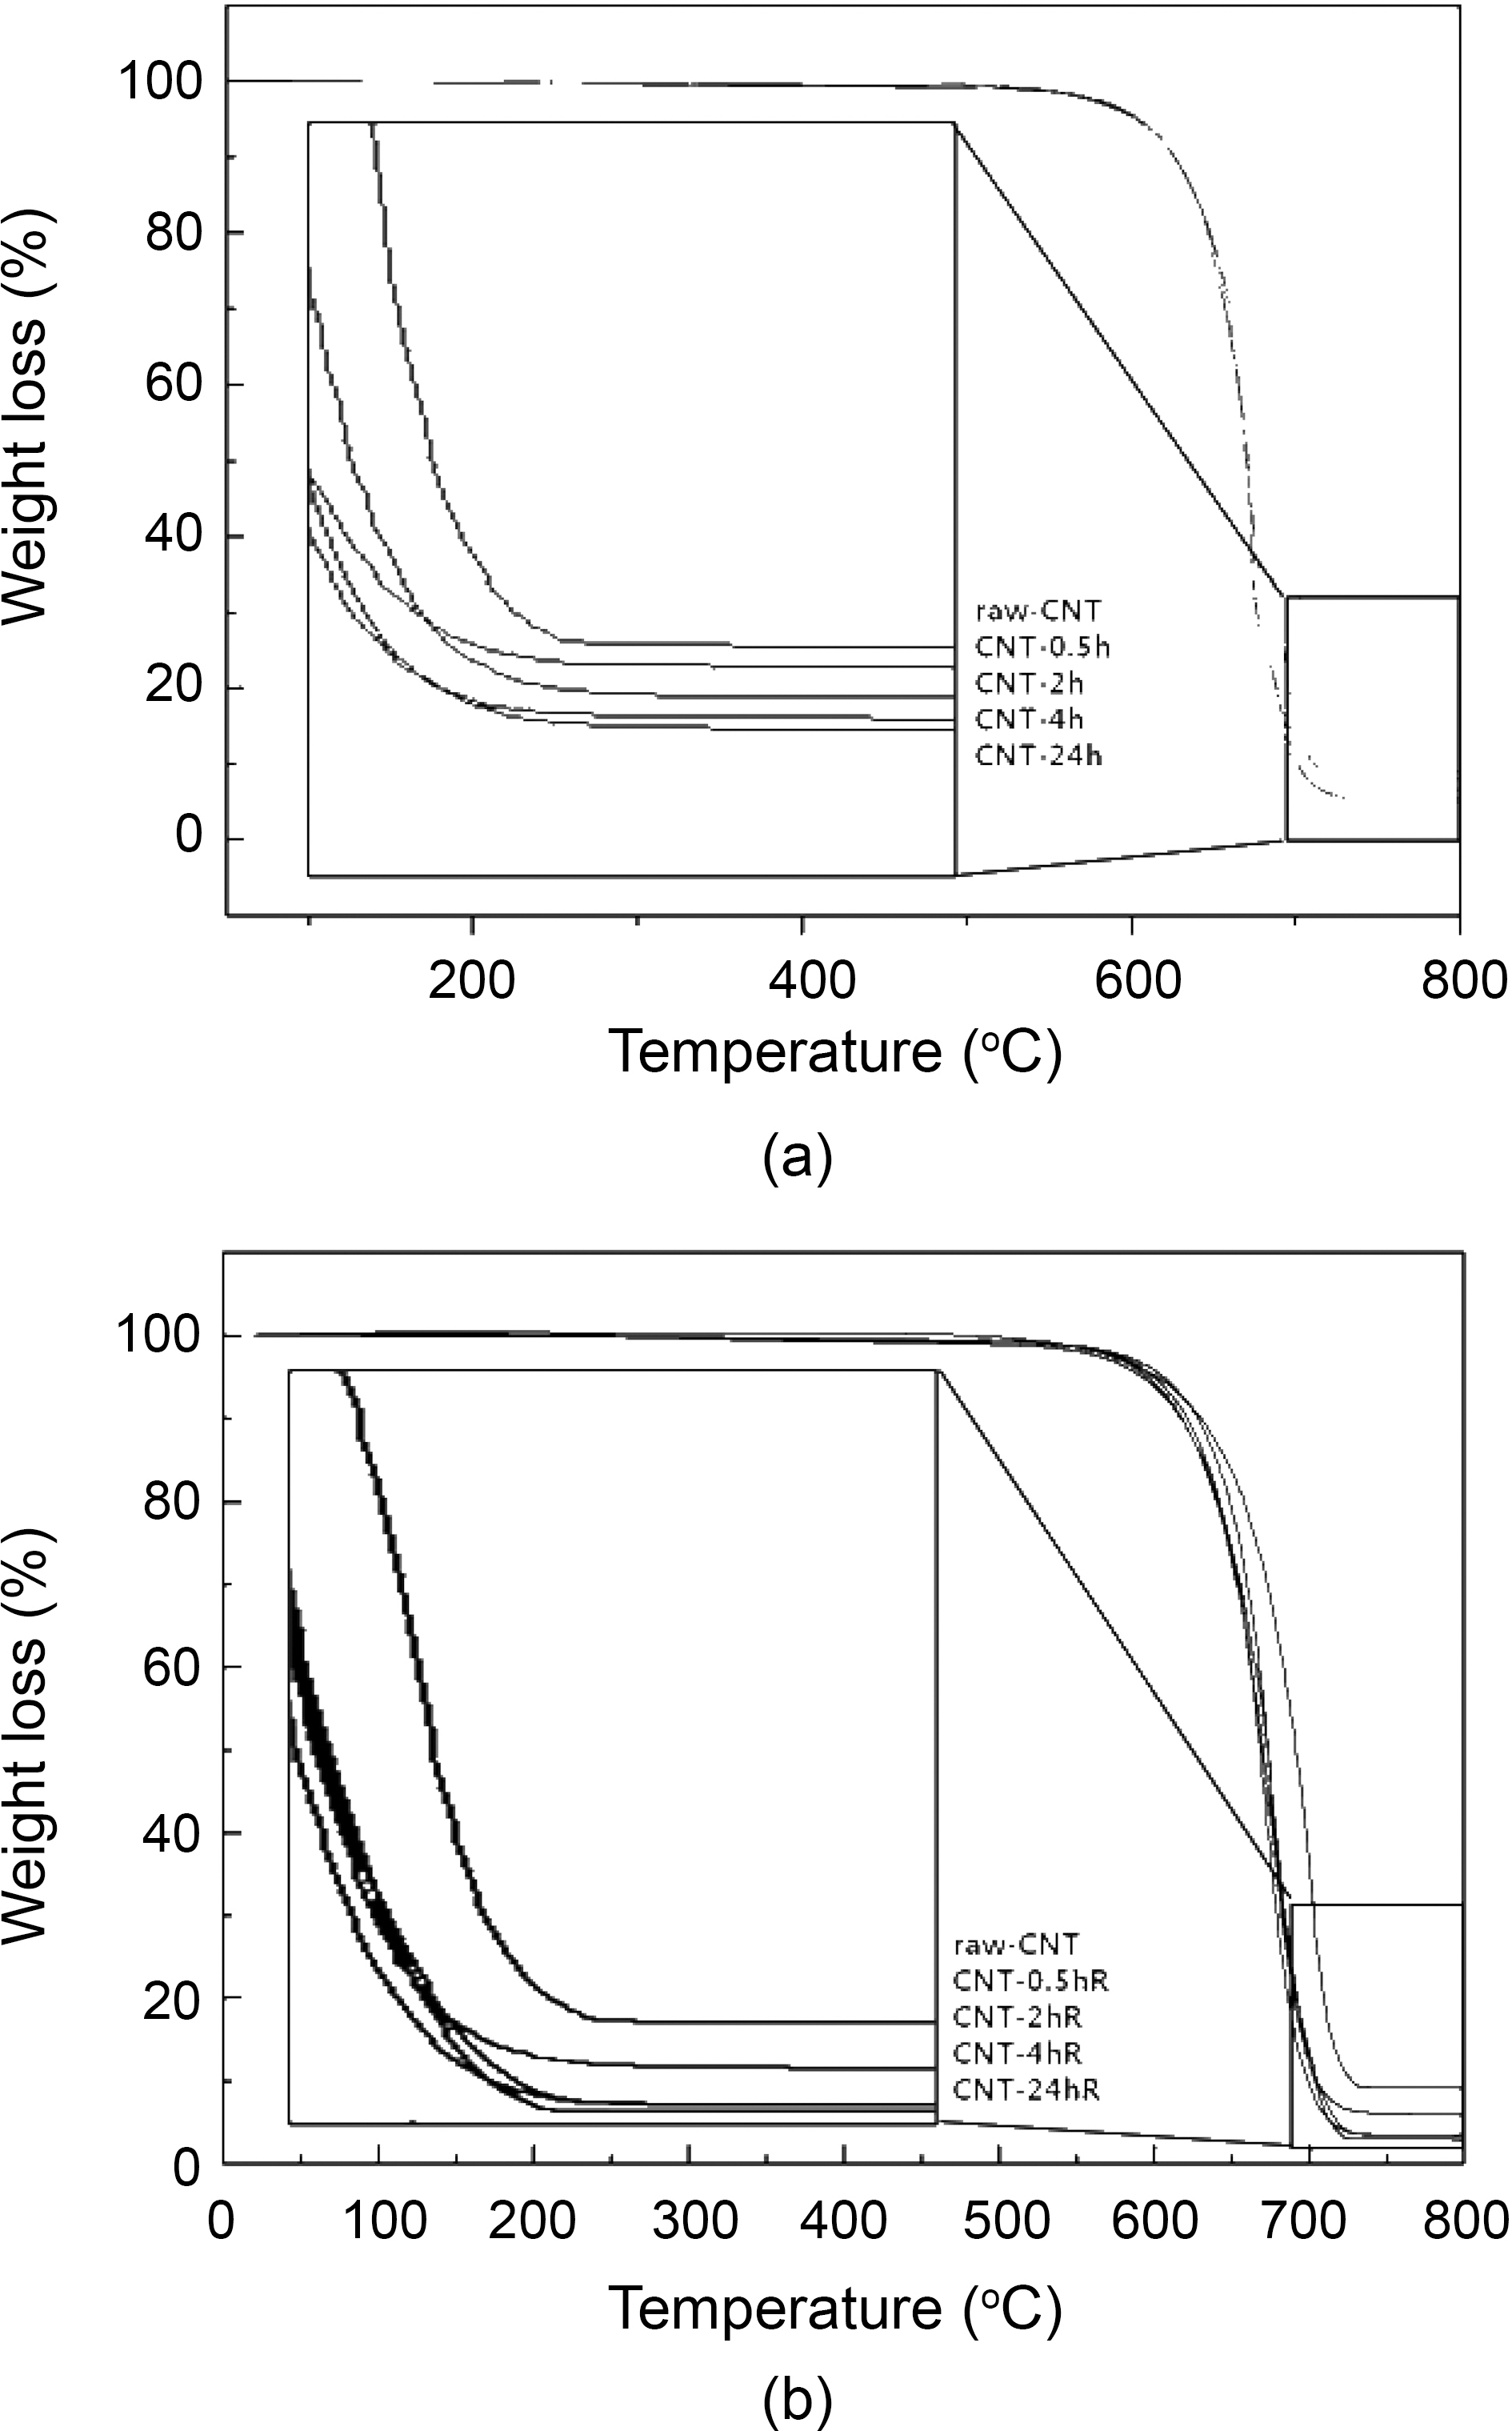
TGA data shown in Fig. 1 reveals that the impurities in all the variously treated CNTs are close to their nominal values,as that of raw CNTs showed impurities up to 10.0 wt%.However, the impurities in CNTs treated with 4 M H2SO4 at room temperature and refluxed at 90oC with different time intervals were found to be 5 wt% and 3 wt% respectively.Interestingly, by careful observation of TGA data shown in Fig. 1, the impurities in CNTs treated by 4.0 M H2SO4 at different time interval was less (5 wt% and 3 wt%) than that of the raw CNTs (10 wt%) indicating usefulness of acid treatment in decreasing the impurity load compared to the raw samples of CNTs. These results indicate that the treatment and reflux time decreases the impurities in raw CNTs.
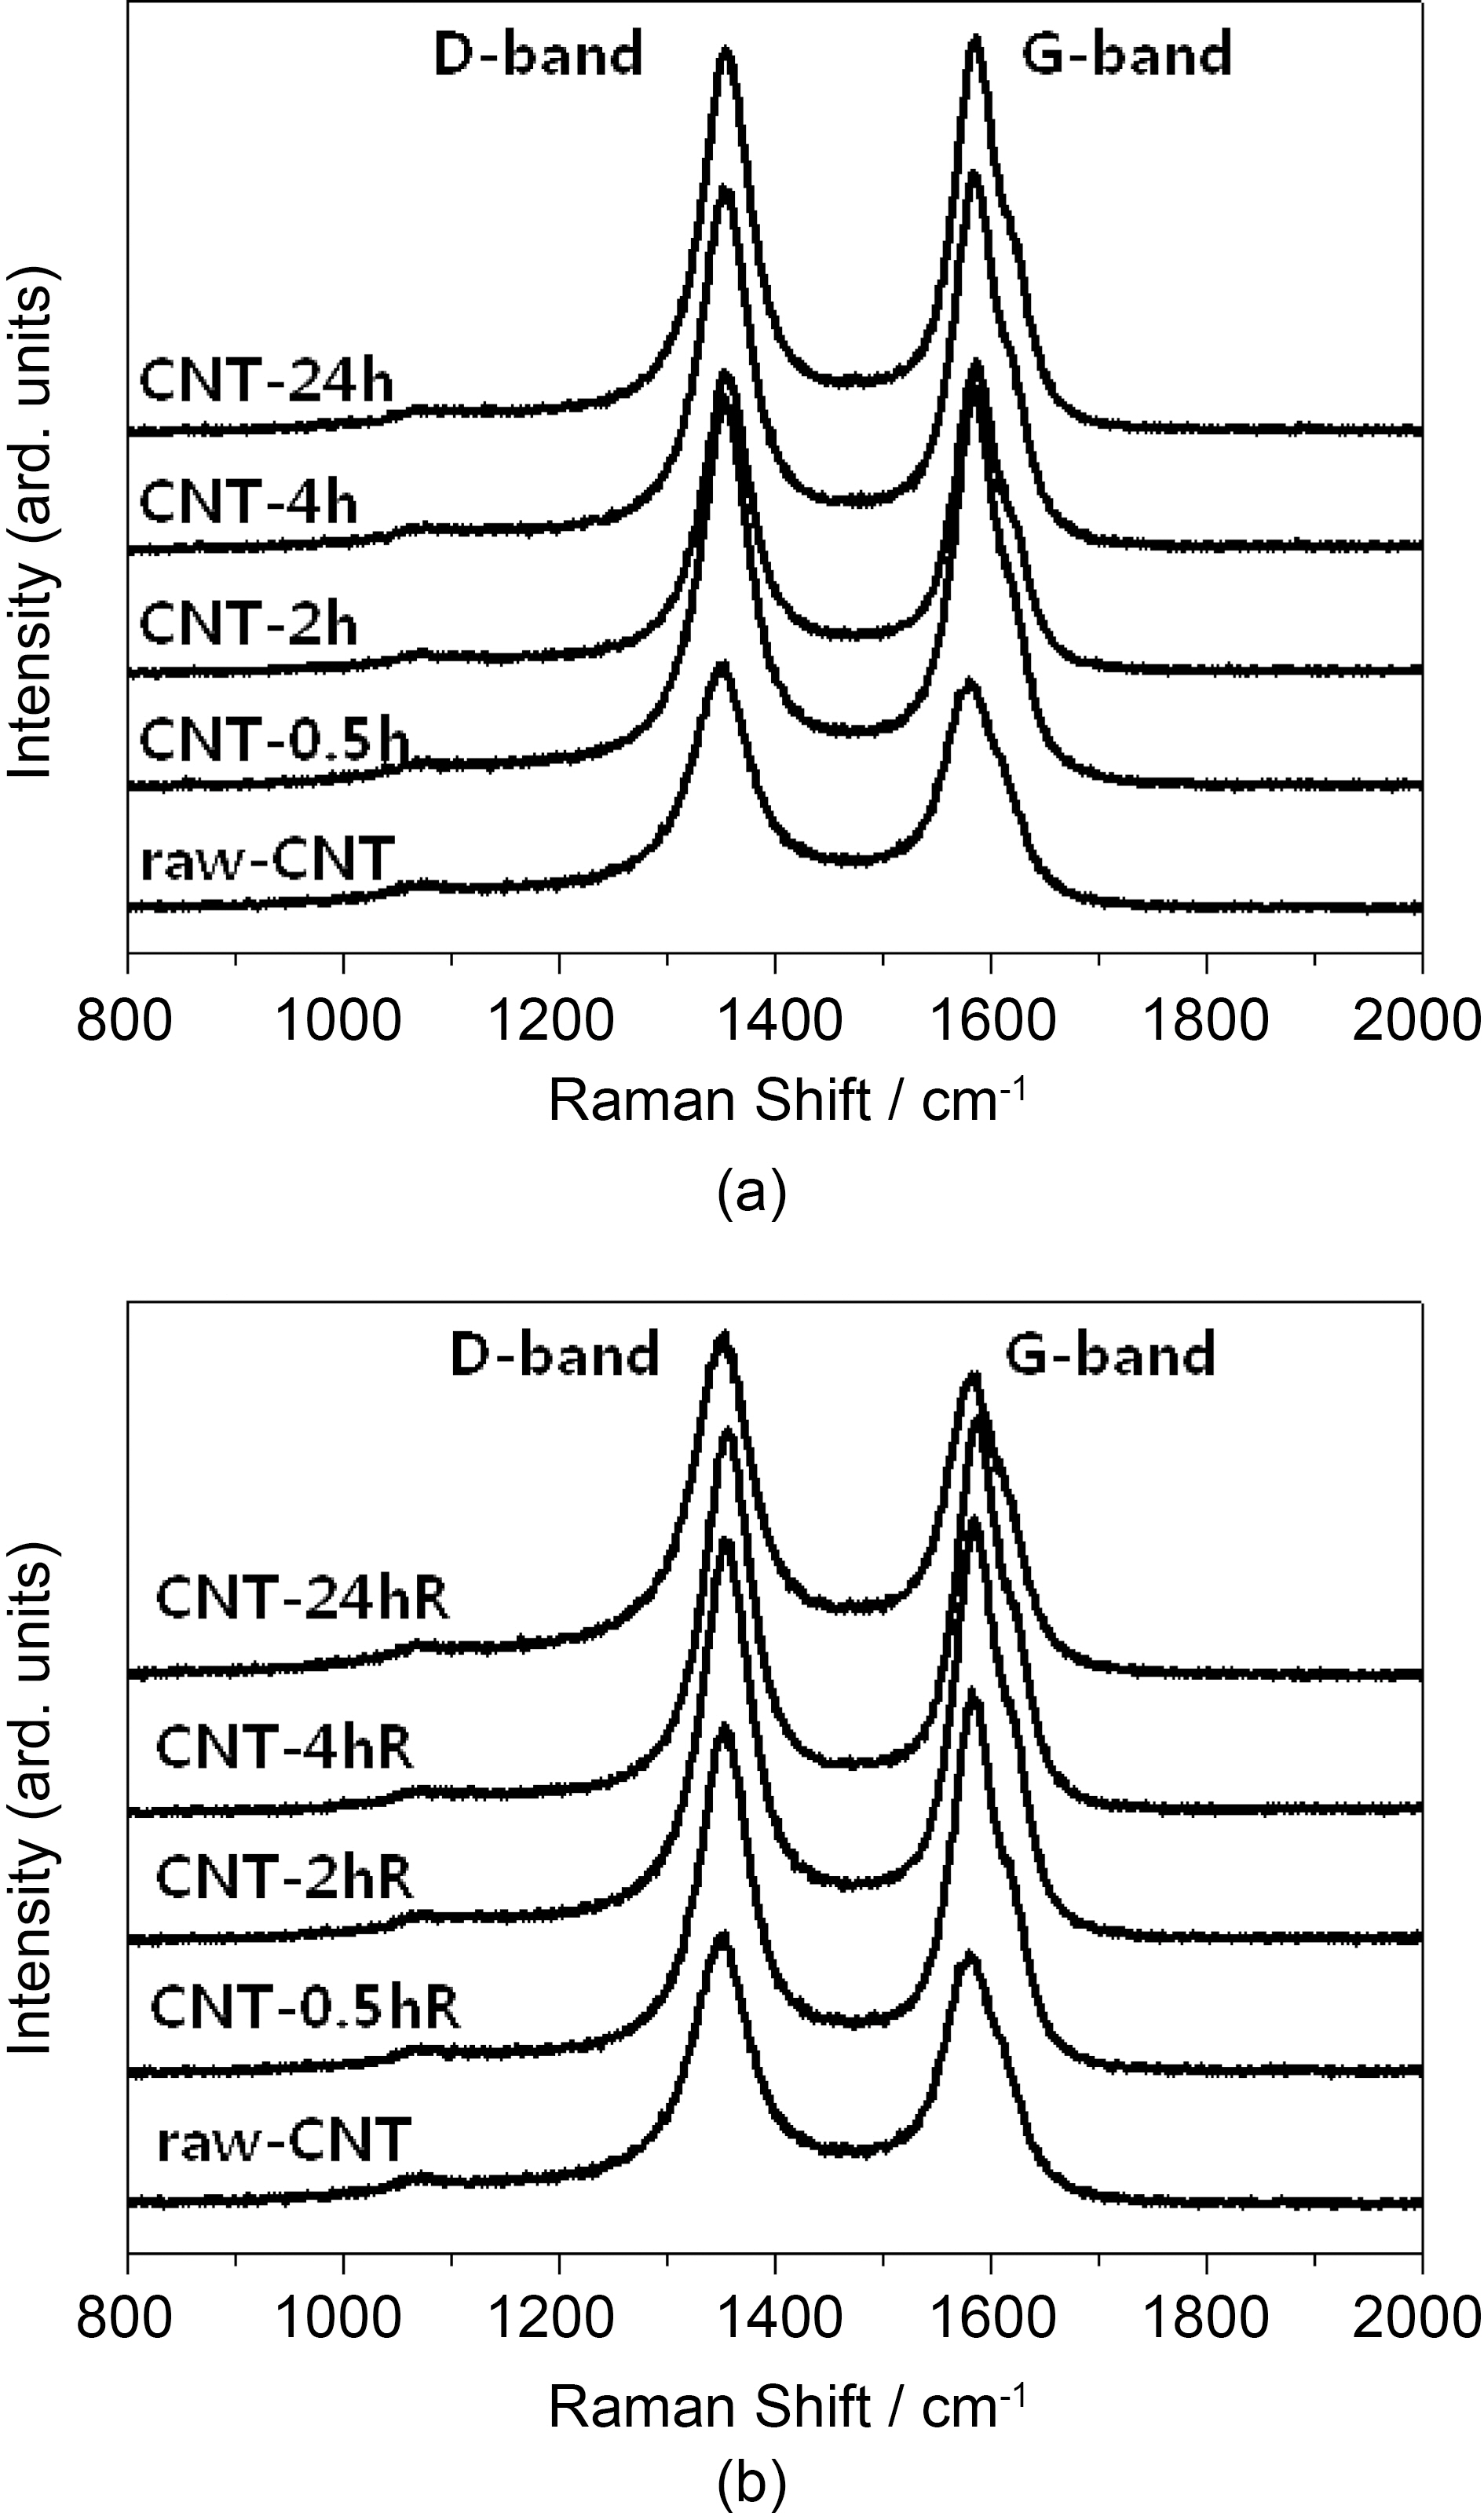
Raman spectra’s of the raw and sulfuric acid-treated CNTs(at room temperature and refluxed at 90°C) CNTs at different time intervals are shown in Fig. 2. All the CNT samples exhibit a disorder-induced peak around 1350 cm-1, which approximately corresponds to the D-line which is connected with the disorder-allowed zone-edge modes of graphite. After surface modification due to acid treatment, a significant decrease in the intensity of D-band was observed in Raman spectra. The decrease in the intensity of D-band is due to the increase in purity and removal of non graphitic carbons during acid treatment. However, by increasing the treatment time intensity of D-band may increase as perfect twodimensional graphitization gets altered to a more disordered structure due to carboxylation. The ID to IG ratio of these samples was calculated by integrating the area of D-band and G-band. The calculated ID/IG ratios of raw and sulfuric acid-treated (at room temperature and refluxed at 90°C)CNTs are shown in Table 1. The high ID/IG ratio on CNTs contributed by the addition of functional groups on the CNT surface after modifications [46,47]. However, CNTs treated by rough condition (acid treatment) results in increase in the ID/IG ratio, indicating decrease in the conductivity.
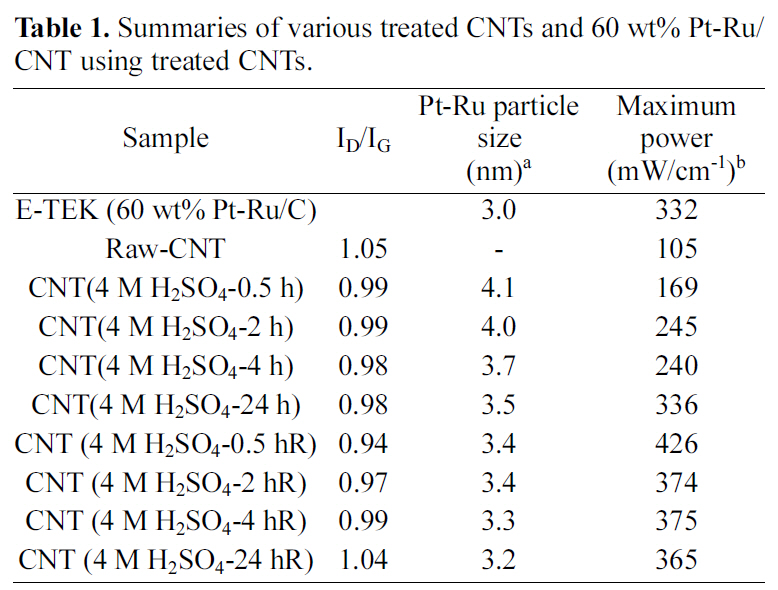
[Table 1.] Summaries of various treated CNTs and 60 wt% Pt-Ru/CNT using treated CNTs.

Summaries of various treated CNTs and 60 wt% Pt-Ru/CNT using treated CNTs.
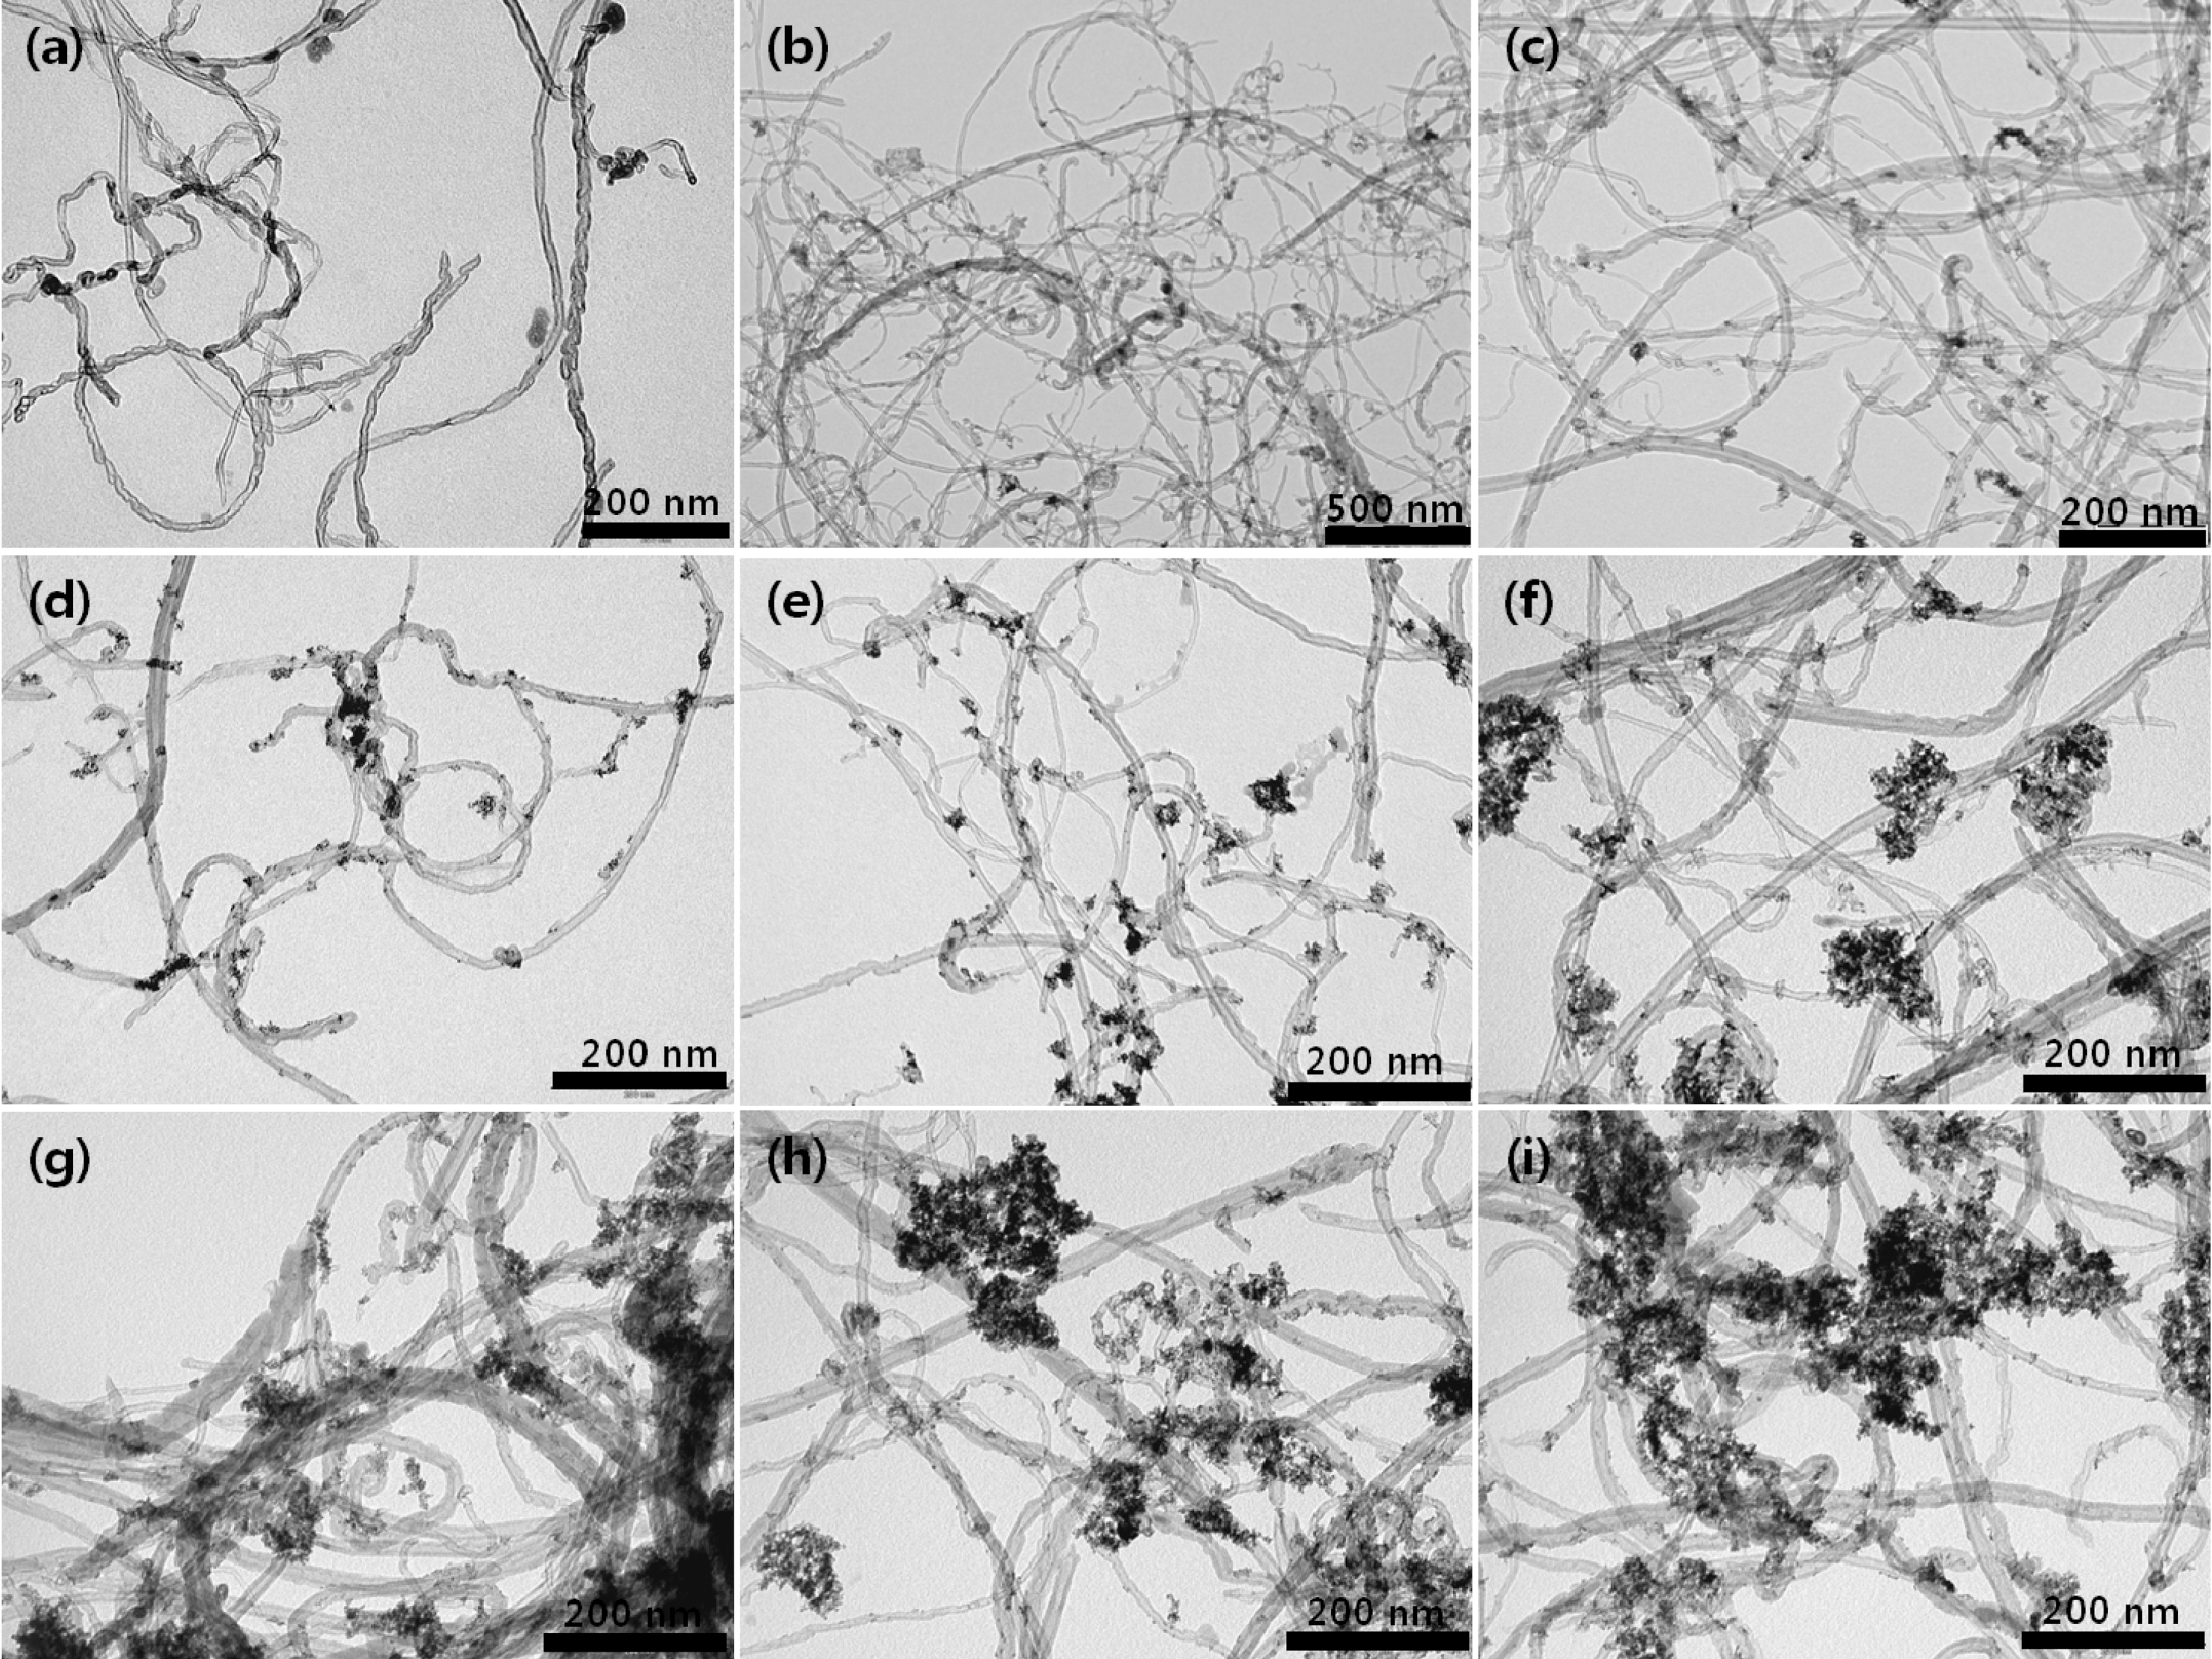
Fig. 3 provides a comparative account of morphological characterization of the raw sample of 60 wt% Pt-Ru/CNT catalyst (Fig. 3(a)) and the acid treated samples at the room temperature(Fig. 3(b)-(e)) and at 90oC (Fig. 3(f)-(i))with a reflux. The raw sample in Fig. 3(a) shows minimal metal deposition on its surface compared to the ones which have received treatment with acid. It directly imputes towards the unmodified surface which has less affinity for metal accumulation. Whereas, the catalyst samples which use acid treated CNTs show higher amount of metal loadings.Catalyst samples prepared from CNTs which had received acid treatment at room temperature (Fig. 3(b)-(e)) show excellent metal loading with uniform particle size distribution,whereas the catalyst samples which used heat treated (90°C)CNTs showed slight particle aggregation (Fig. 3(f)-(i)). The average particle size measured directly from the TEM photographs at randomly selected regions was found in the range of 3.0 ~ 4.0 nm in diameter. However, Pt-Ru/CNTs(4.0 M H2SO4-reflux) prepared over 2 h shows slightly increase in the particle size and diminutive metal agglomeration which was sporadically found in the sample (Fig. 3(g)-(i)).The Pt-Ru/CNT (4.0 M H2SO4-0.5R) catalyst shows slightly decrease in the particle size which was intermittently found in the sample (Fig. 3(f)). Over all catalysts synthesized using CNTs obtained after reflux at 90°C show ample metal particle deposition on the CNT support, providing an additional evidence for abundant surface functionalization in refluxed samples.
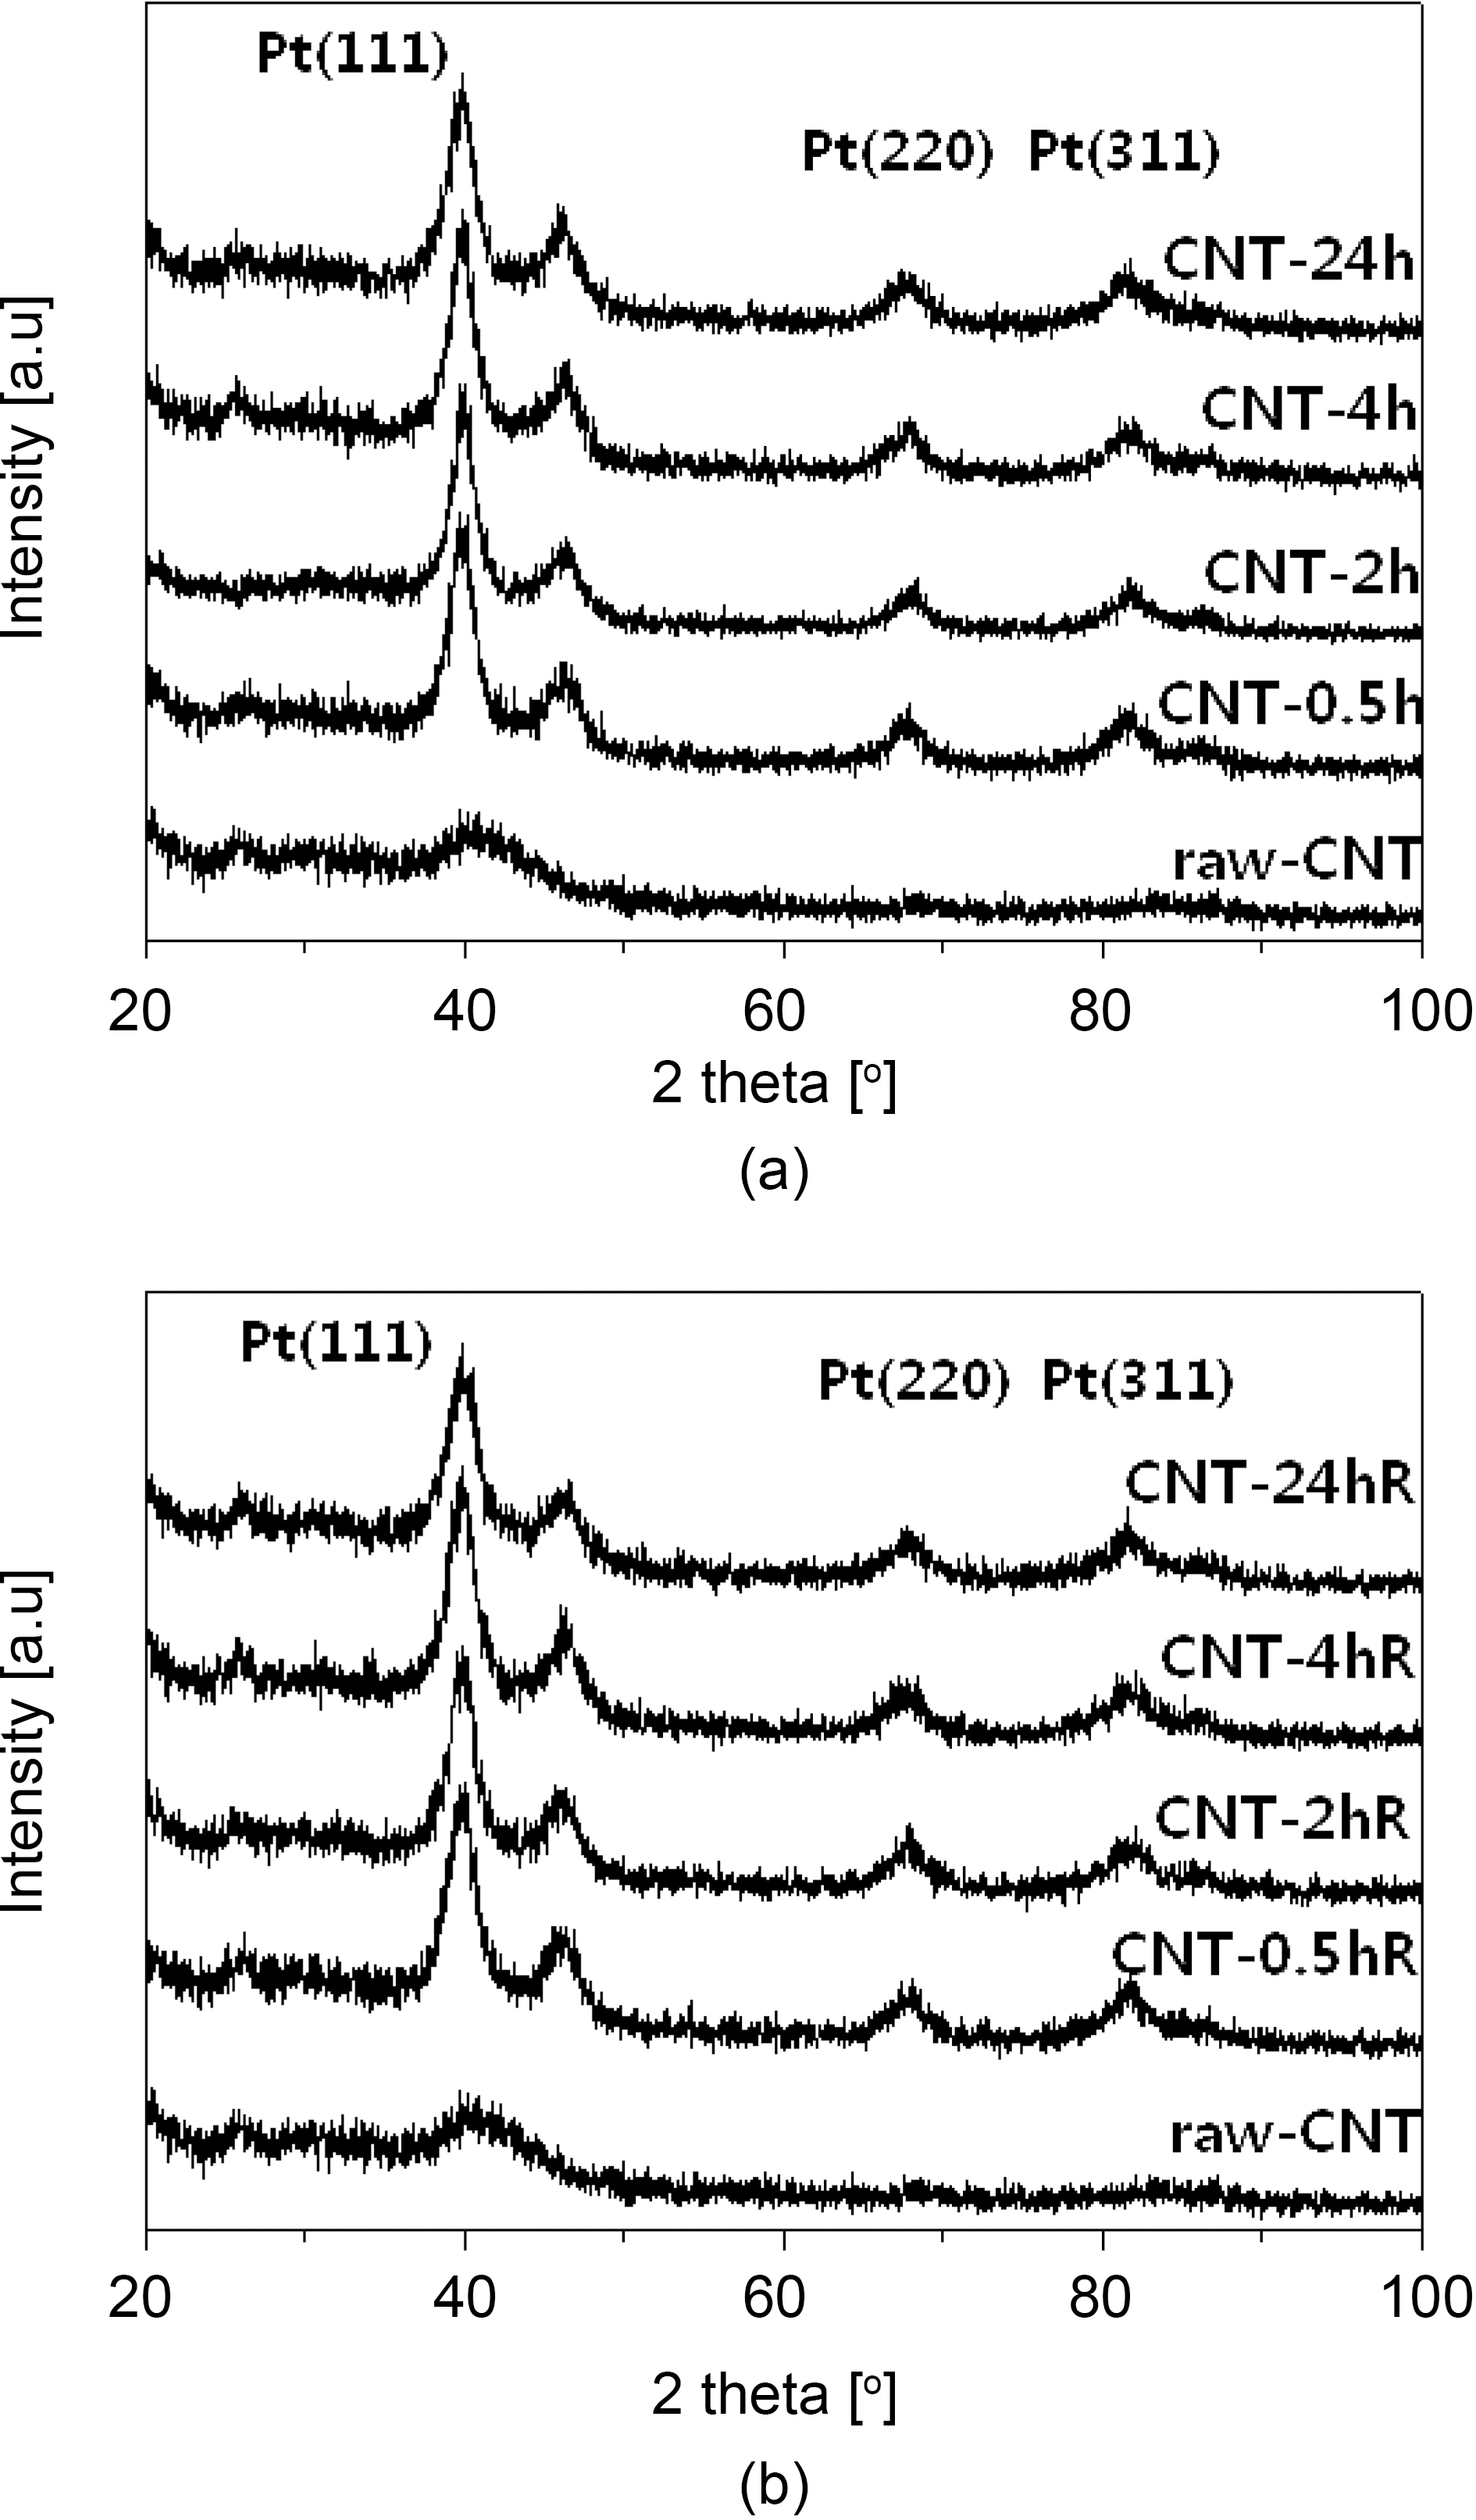
Fig. 4 shows the typical XRD patterns for the Pt-Ru/CNT catalysts synthesized at various conditions. The peak located at ca. 24.5° in the XRD pattern is associated with the CNT support. The other three peaks are characteristic of facecentered cubic (fcc) crystalline Pt (JCPDS-ICDD, Card no.04-802), corresponding to the planes (111), (220) and (311) at 2θ values of ca. 39.8, 67.8 and 81.2, respectively,indicating that the alloy catalyst is principally single-phase disordered structure. Relative to the same reflections in bulk Pt, the diffraction peaks for Pt-Ru alloy catalyst are shifted to higher 2θ values. The higher angle shifts of the Pt diffraction peaks reveals the formation of an alloy involving the incorporation of Ru atom into the fcc structure of Pt metal. The XRD patterns shown in Fig. 4 also suggest that the as synthesized catalysts exist as Pt-Ru alloy since the peaks are shifted to the higher angles as (111), (220) and(311) at 2θ values of ca. 40.5, 68.9 and 83.6, respectively.The average particle sizes calculated from (220) X-ray diffraction peak of Pt fcc lattice by the Scherrer equation [48] were found very close to the values estimated from TEM images. Data obtained from the XRD analysis is summarized in Table 1.
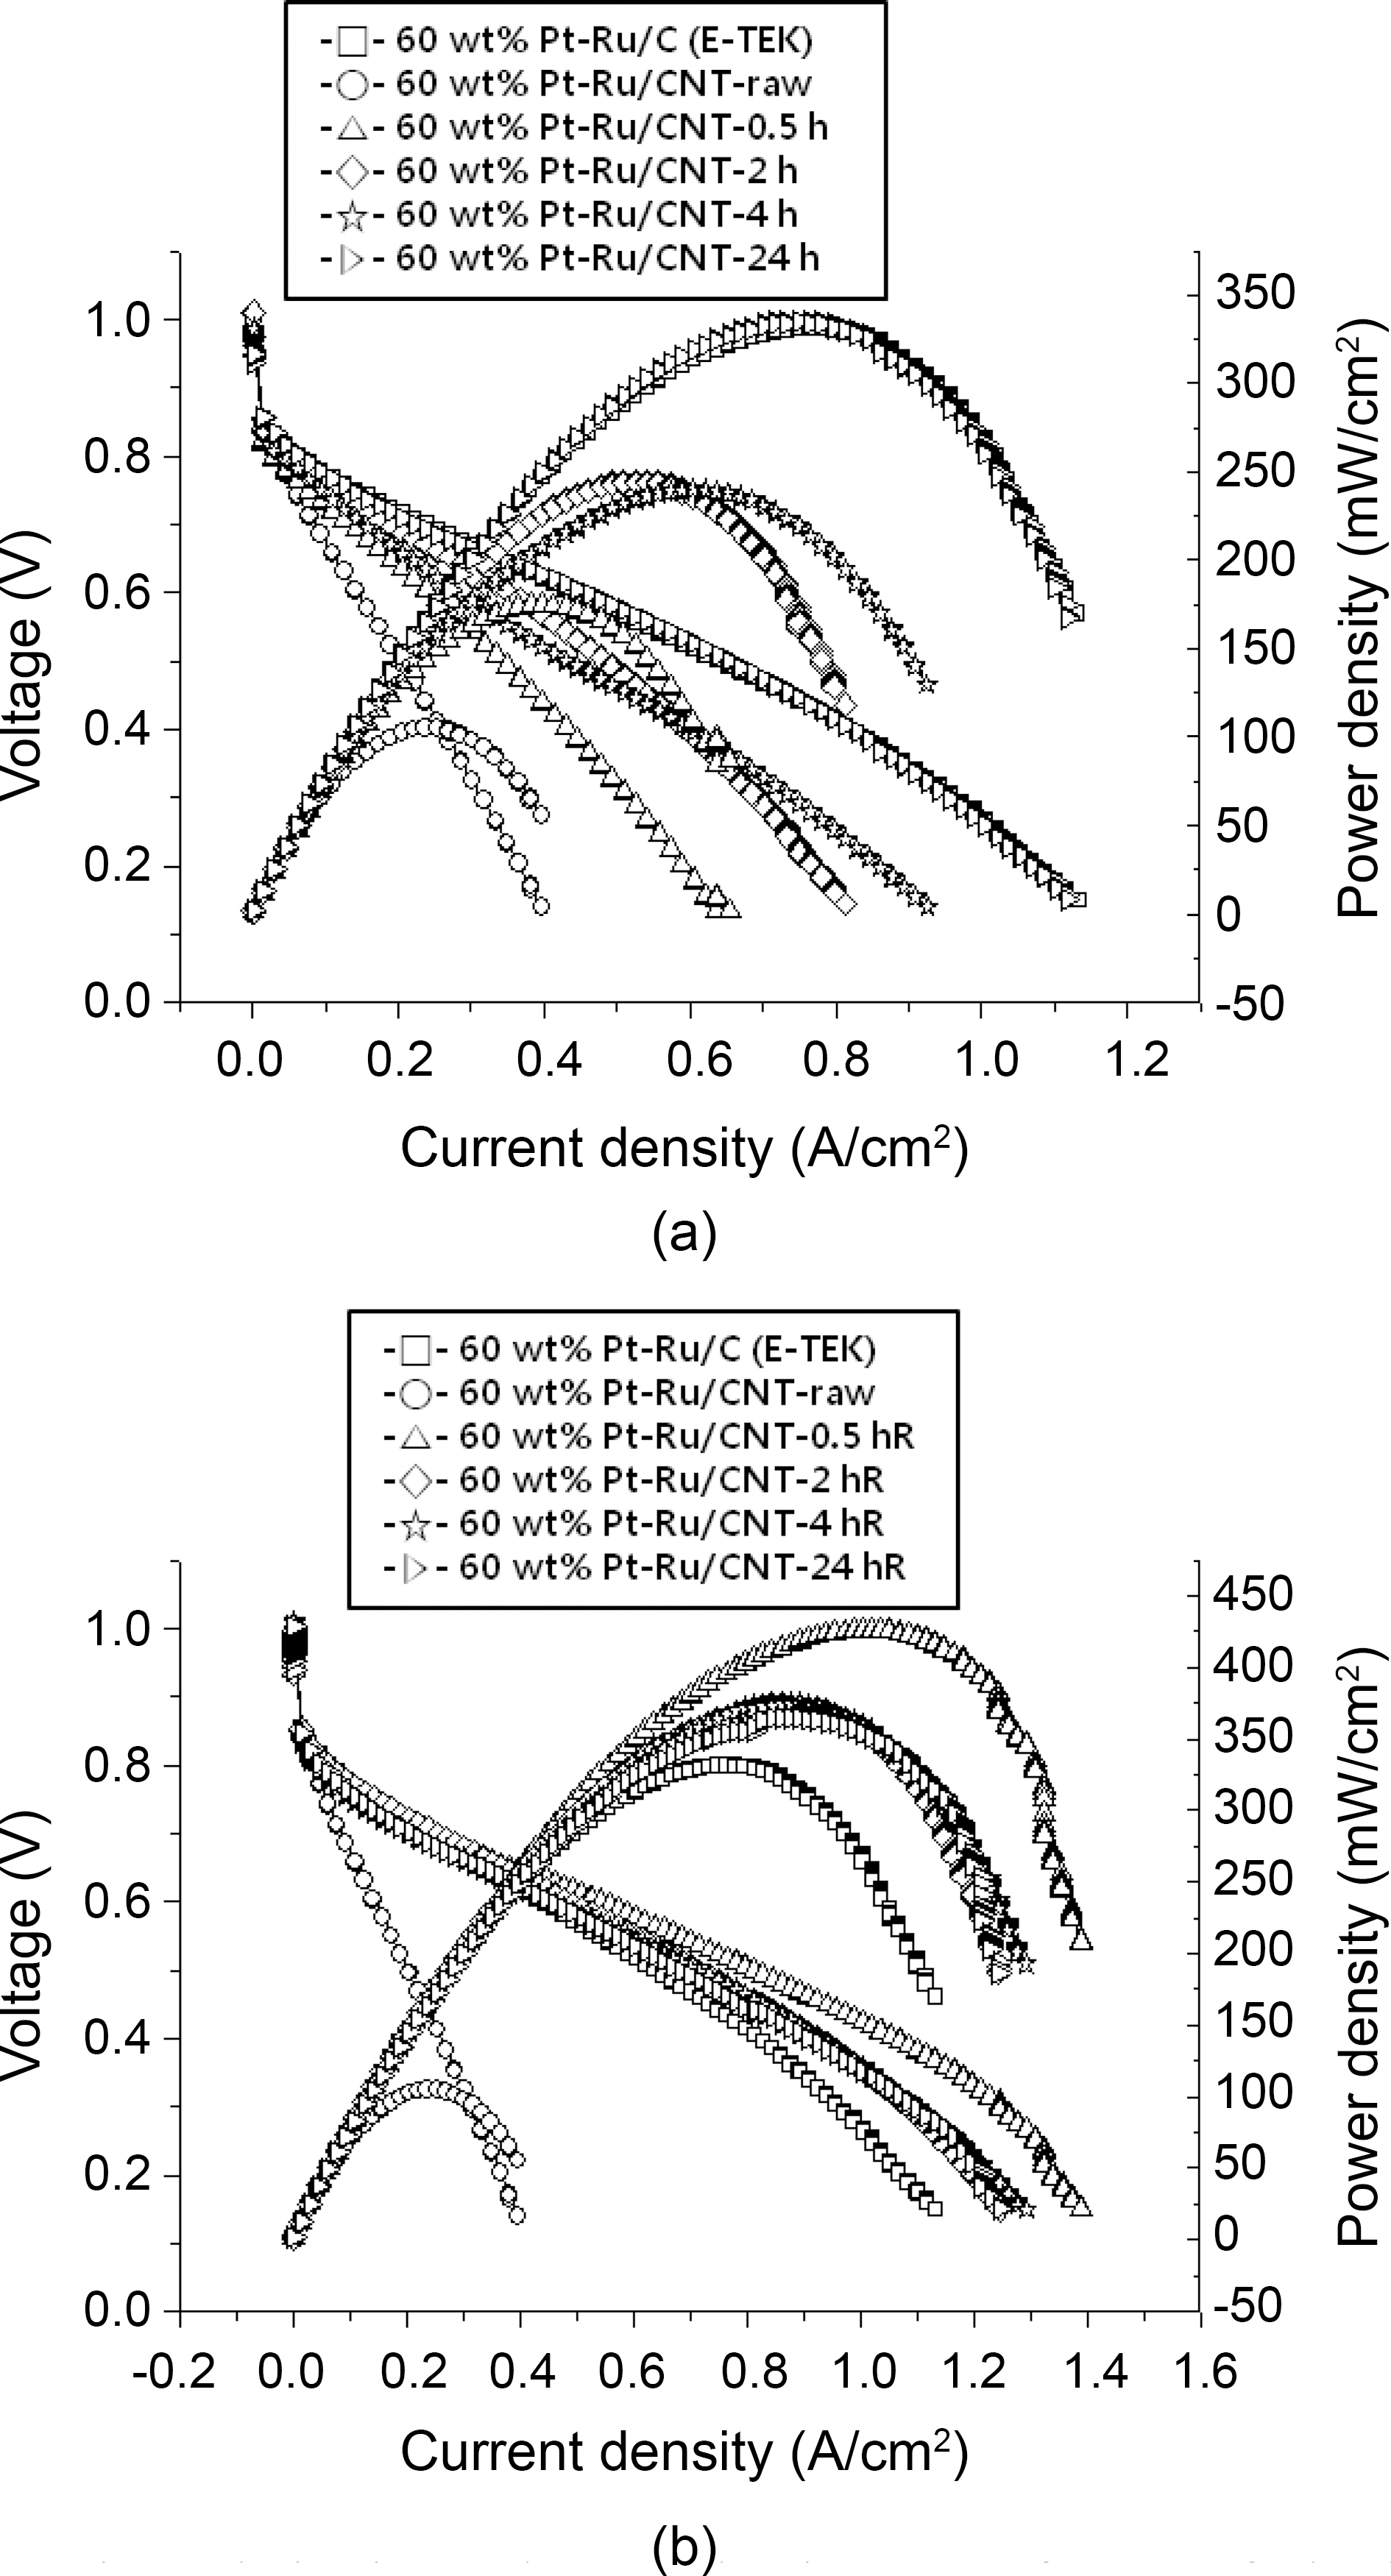
Fig. 5 shows PEMFC performances at 60°C for the Pt-Ru/CNT catalysts synthesized by employing various conditions.The maximum power density measured for Pt-Ru/CNT (raw)is 105 mW/cm2, while the respectively treated samples show 169mW/cm2 for Pt-Ru/CNT (4.0 M H2SO4-0.5hRT), 245mW/cm for Pt-Ru/CNT (4.0 M H2SO4-2hRT), 240mW/cm for Pt-Ru/CNT(4M H2SO4-4hRT) and 336mW/cm for Pt-Ru/C(4.0 M H2SO4-24hRT). Comparative account of power density for all the samples is summarized in Table 1, providing efficiency of acid treatment. Power output for the commercially available E-TEK based catalyst is provided in Fig. 5(a) which accounts for maximum power density of 332 mW/cm2. Maximum power densities measured for acid treated samples at 90oC reflux were 426 mW/cm2 for Pt-Ru/CNT (4.0 M H2SO4-0.5hR), 374 mW/cm for Pt-Ru/CNT(4.0 M H2SO4-2hR), 375 mW/cm for Pt-Ru/CNT (4.0 M H2SO4-4hR) and 365 mW/cm for Pt-Ru/C(4.0 M H2SO4-24hR) showing higher power density output than the commercially available control E-TEK catalyst(332 mW/cm2)provided in Fig. 5(b) with summary available in Table 1. It was seen that the efficiency of the control (commercial ETEK carbon) for the acid treated samples at room temperature is slightly higher. This may be due to unavailability of enough functional groups which in turn affects the anchoring of metal catalyst. Ru/CNT (4.0M H2SO4-0.5hR) shows the highest performance among the other samples treated at near boiling point temperatures. This can be attributed to higher metal loading which correlates with higher power output. While it was also seen that with increasing reflux times the CNT surfaces seem to get damaged due to prolonged contact with acid at higher temperature, resulting in decreased power outputs. A comparative assessment of Pt-Ru particle size and PEMFC performance at various conditions is summarized in Table 1, providing us with a correlation between the catalyst activity and various acid treatments.
The current work illustrates a comparative assessment of different acid treatments and their implications in development of efficient fuel cell catalyst. To mention here the Pt-Ru catalyst developed using CNTs roughened for half an hour at reflux temperatures provided the best fuel cell performance in terms of power efficiency, indicating the importance of roughening time and temperature. A clever combination of roughening time and temperature modifies the CNTs with ample anchoring groups which in turn result in higher metal loading, which influences the overall performance of the fuel cell catalyst.