Color is one of the most important quality criteria for sugar, the smaller the color values the higher the quality of the sugar. Color or colorants in sugar are of different origin;there are those derived from the plant (natural colorants) and those which are formed during processing (factory colorants). The natural colorants are: the chlorophyll (a and b), carotenes, xanthophylls and flavonoids (further break down into anthocyanes), as these are present in the sugar cane plant and arrive in the raw juice after extraction. Other “colorless” components (color precursors) include two main groups (polyphenols, amino compounds) [1].
On the other hand, the sugar processing colorants (or factory colorants) are reaction products between the different colorless precursors and are distinguished into four groups:melanines, melanoidines, caramels and hexose alkaline degradation products (HADP) [2].
Despite observing all the rules of avoiding color formation and assuming best practices not to generate any unnecessary color, colorants are present and conditions prevail for generating color during processing. Particularly in cane sugar factories the regular process is not able for removing sufficiently color precursors towards obtaining white sugar directly as finished product. Most of the sugar plant pigments are removed during sugar factory operations. Sugar processing colorants, however, end up in the finished product raw sugar and require the refining process for removing these colorants. There are two classical chemical syrup clarification systems in the refining industry which have different effects on decolorization and been modified over time [1]. Phosphatation, which is using milk of lime and phosphoric acid and is a flotation process (floating scum), and carbonation, uses milk of lime and carbon dioxide gas forming a precipitating mud. The color removing efficiency varies to a great extent, phosphatation achieves 23 to 32%whereas carbonation 57 to 60% [3].
A different approach is ultra filtration [4], fairly newly introduced into the industry. By selecting suitable membrane types, colorants and polysaccharides are removed from sugar melt. However, it is still not yet possible achieving by this method decolorization rates of 77 to 91% [5,6] required for crystallization of high quality (low color) refined sugar without further additional decolorization steps [7,8].
The classical removal of colorants by affination and clarification is insufficient for bringing the fine liquor color down for refined sugar decolorization. An additional decolorization by an adsorption processing step becomes necessary. Traditionally in use are bone charcoal and granular activated carbon (GAC), a flexible alternative is powdered activated carbon (PAC), which is a “throw-away” decolorant [9] other than granular products [10], which are thermally regenerated. Activated carbons are known since many decades to possess a high adsorption capacity because of its extended internal porosity. In addition to its efficiency for removal of gaseous odours, it exhibits also distinguished power for removal of odorous, colored and noxious solutes from the liquid phase. Decolorization of sugar syrup in the last stage before crystallization, is a well established process since around two centuries. Bone char has been currently in use in many sugar refineries for ages. Activated carbon replaced bone char in most sugar production plants due to its higher removal capacity.
Activated carbon was traditionally produced from three main sources: coal, wood and coconut shells [11]. However as these are not economically available in all countries, it became necessary to utilize abundant raw materials with high carbon content, as suitable sources for its production. The high cost of imported decolorizing activated carbon dictated the search for locally alternative low- cost feasible feed stocks for porous carbon production. This directed attention to a large number of agricultural by- products that are copious, regenerable waste materials. Among the most effective and commercially viable sources were found to be fruit pits (date, apricot, olive peach) [11-15], nut shells (hazel, almond, walnut, peanut, black and English walnut, macadamia and pecan nuts) [16,17], woods [18-21], cotton stalks [22,23], rice straw and husks,water hyacinth [24,25], bagasse [26], corn cobs [27] and giant reed (
For the production of good adsorbing carbons several activation schemes were devised and applied along the years; these are broadly divided into either physical (thermal) or chemical procedures [11]. During the last few decades,chemical activation with phosphoric acid proved to be an economically feasible as it involves a single thermal treatment process (pyrolysis/activation), tailors the properties of activated products, achieved at relatively low treatment temperatures (400~600℃), results in a high carbon yield (35~50%), and most unreacted activant was economically recovered [29,30]. The process was observed to be suitable for a large number of ligno-cellulosic materials as reported earlier [11-17,19-26,29,30].
Common reed (
These were obtained from the hand-picked stems of local common reed (
2.2. Characterization of porosity
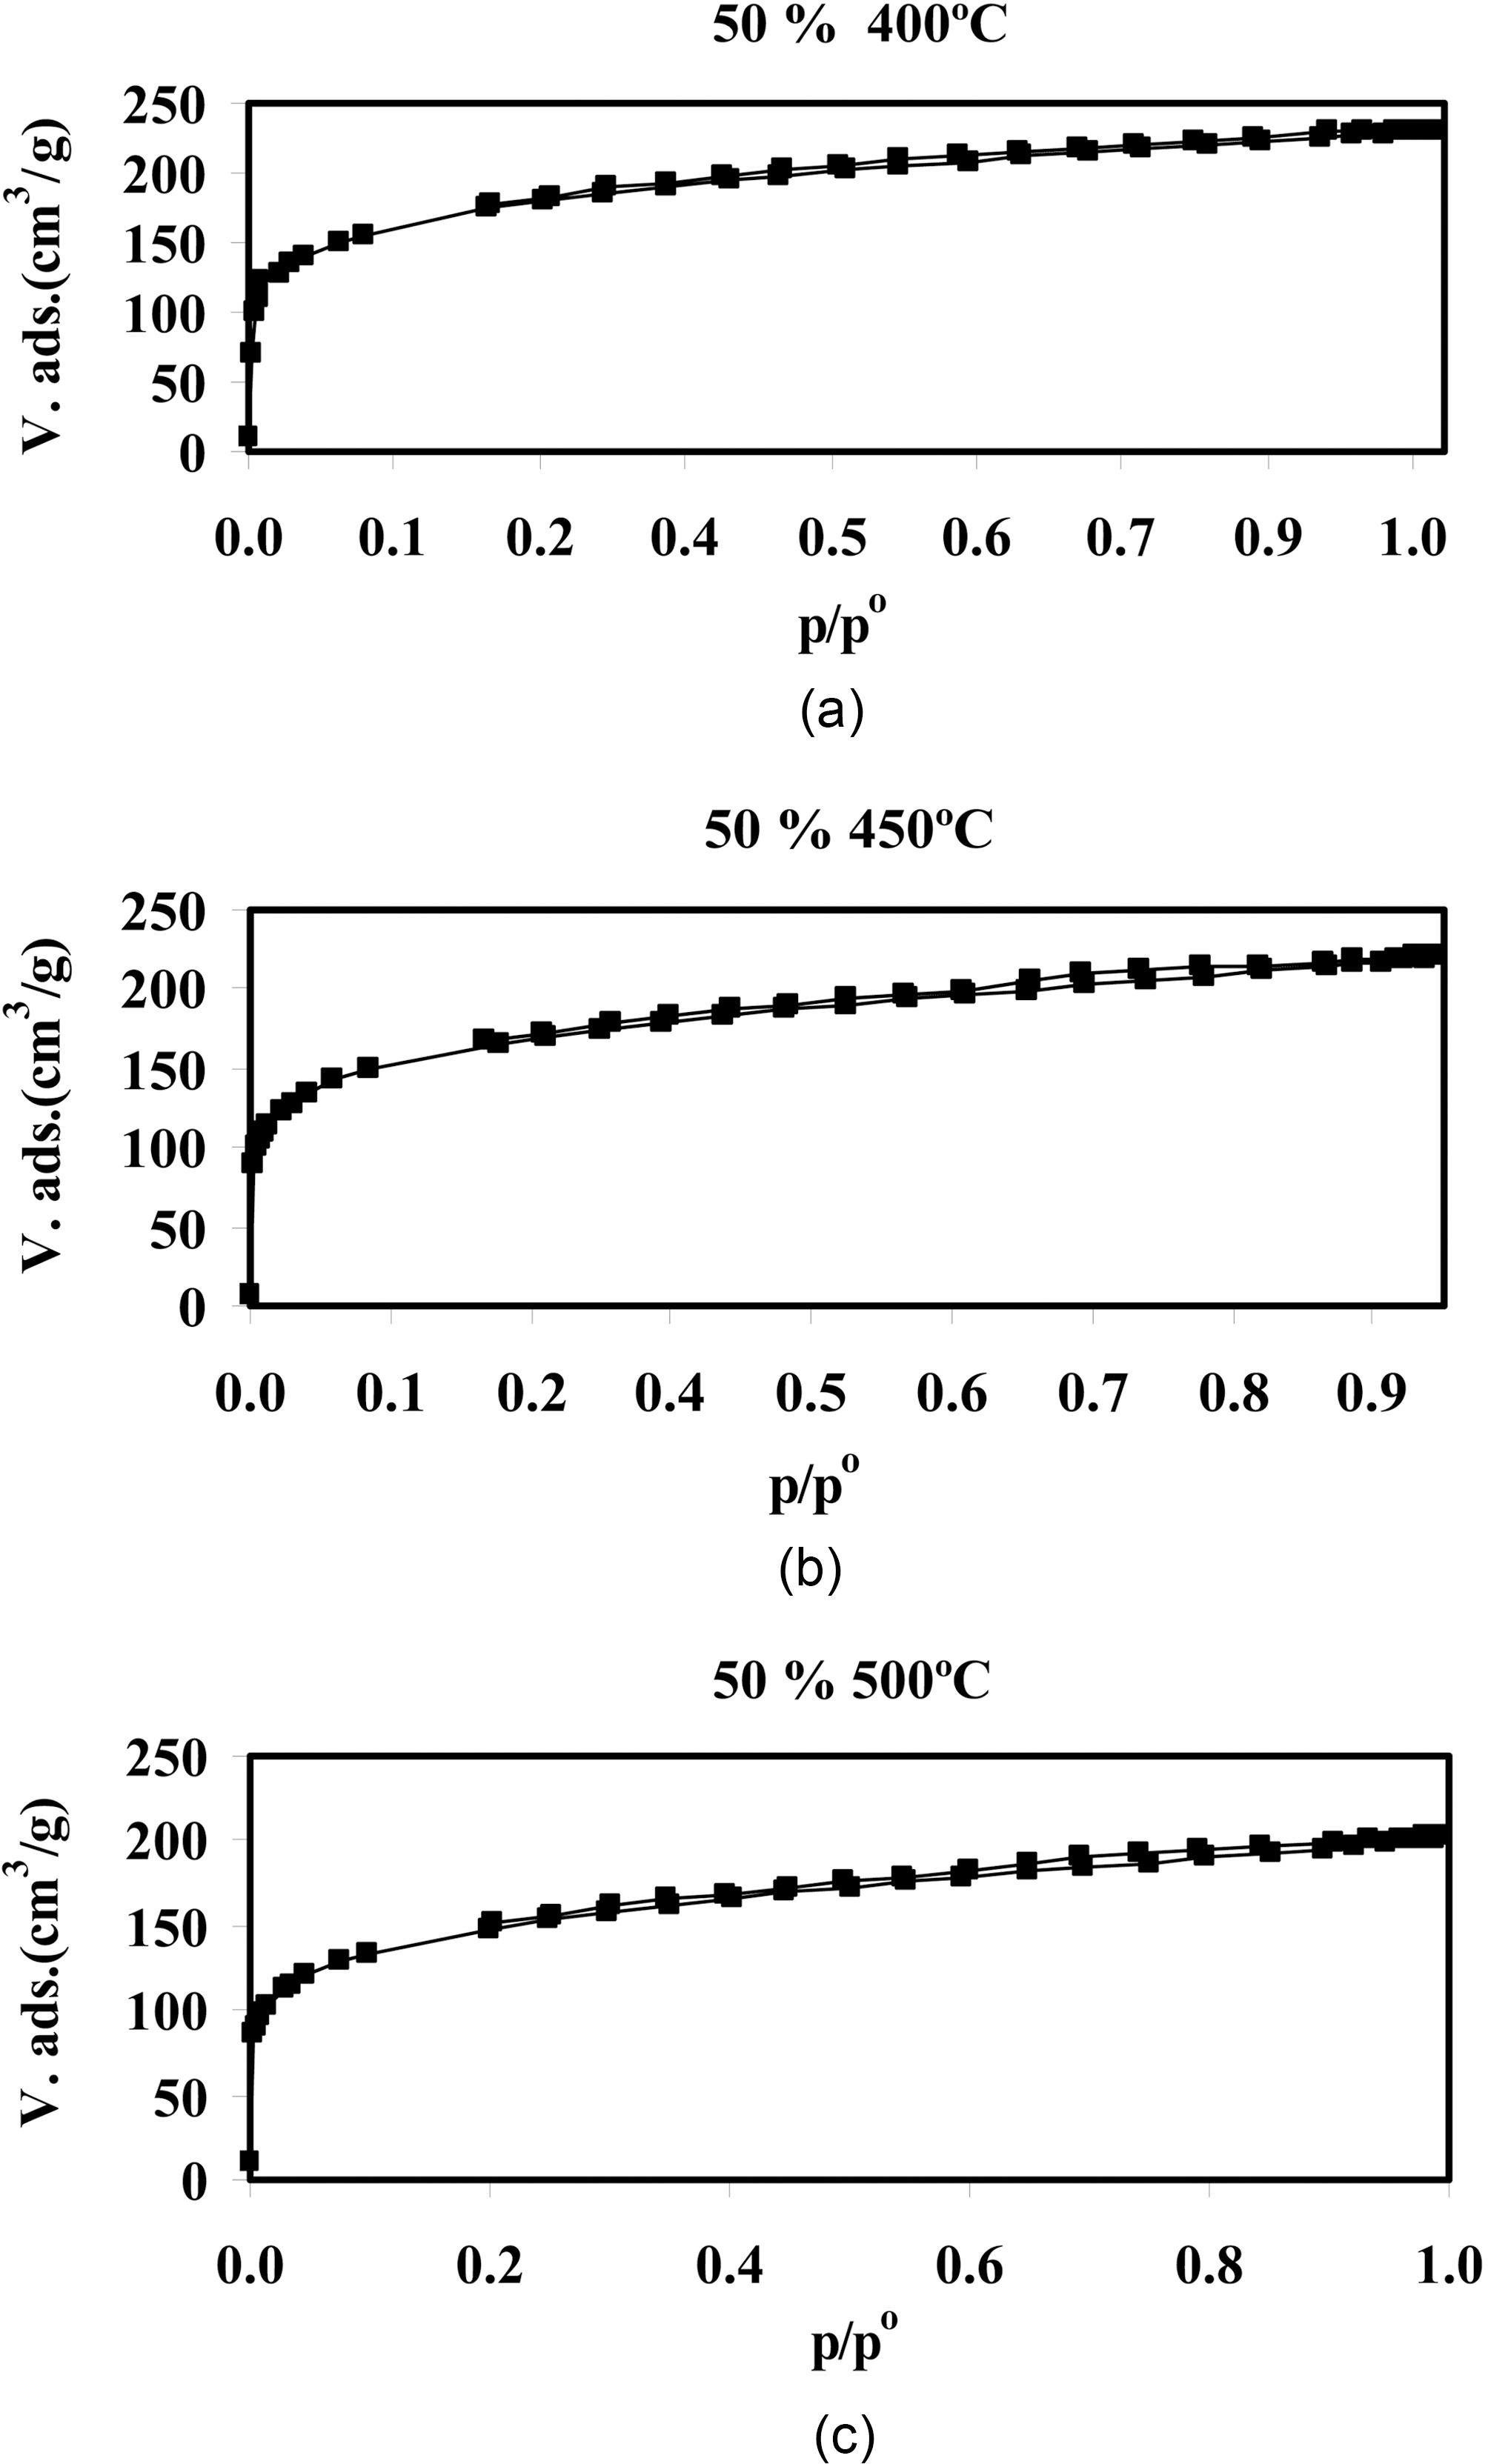
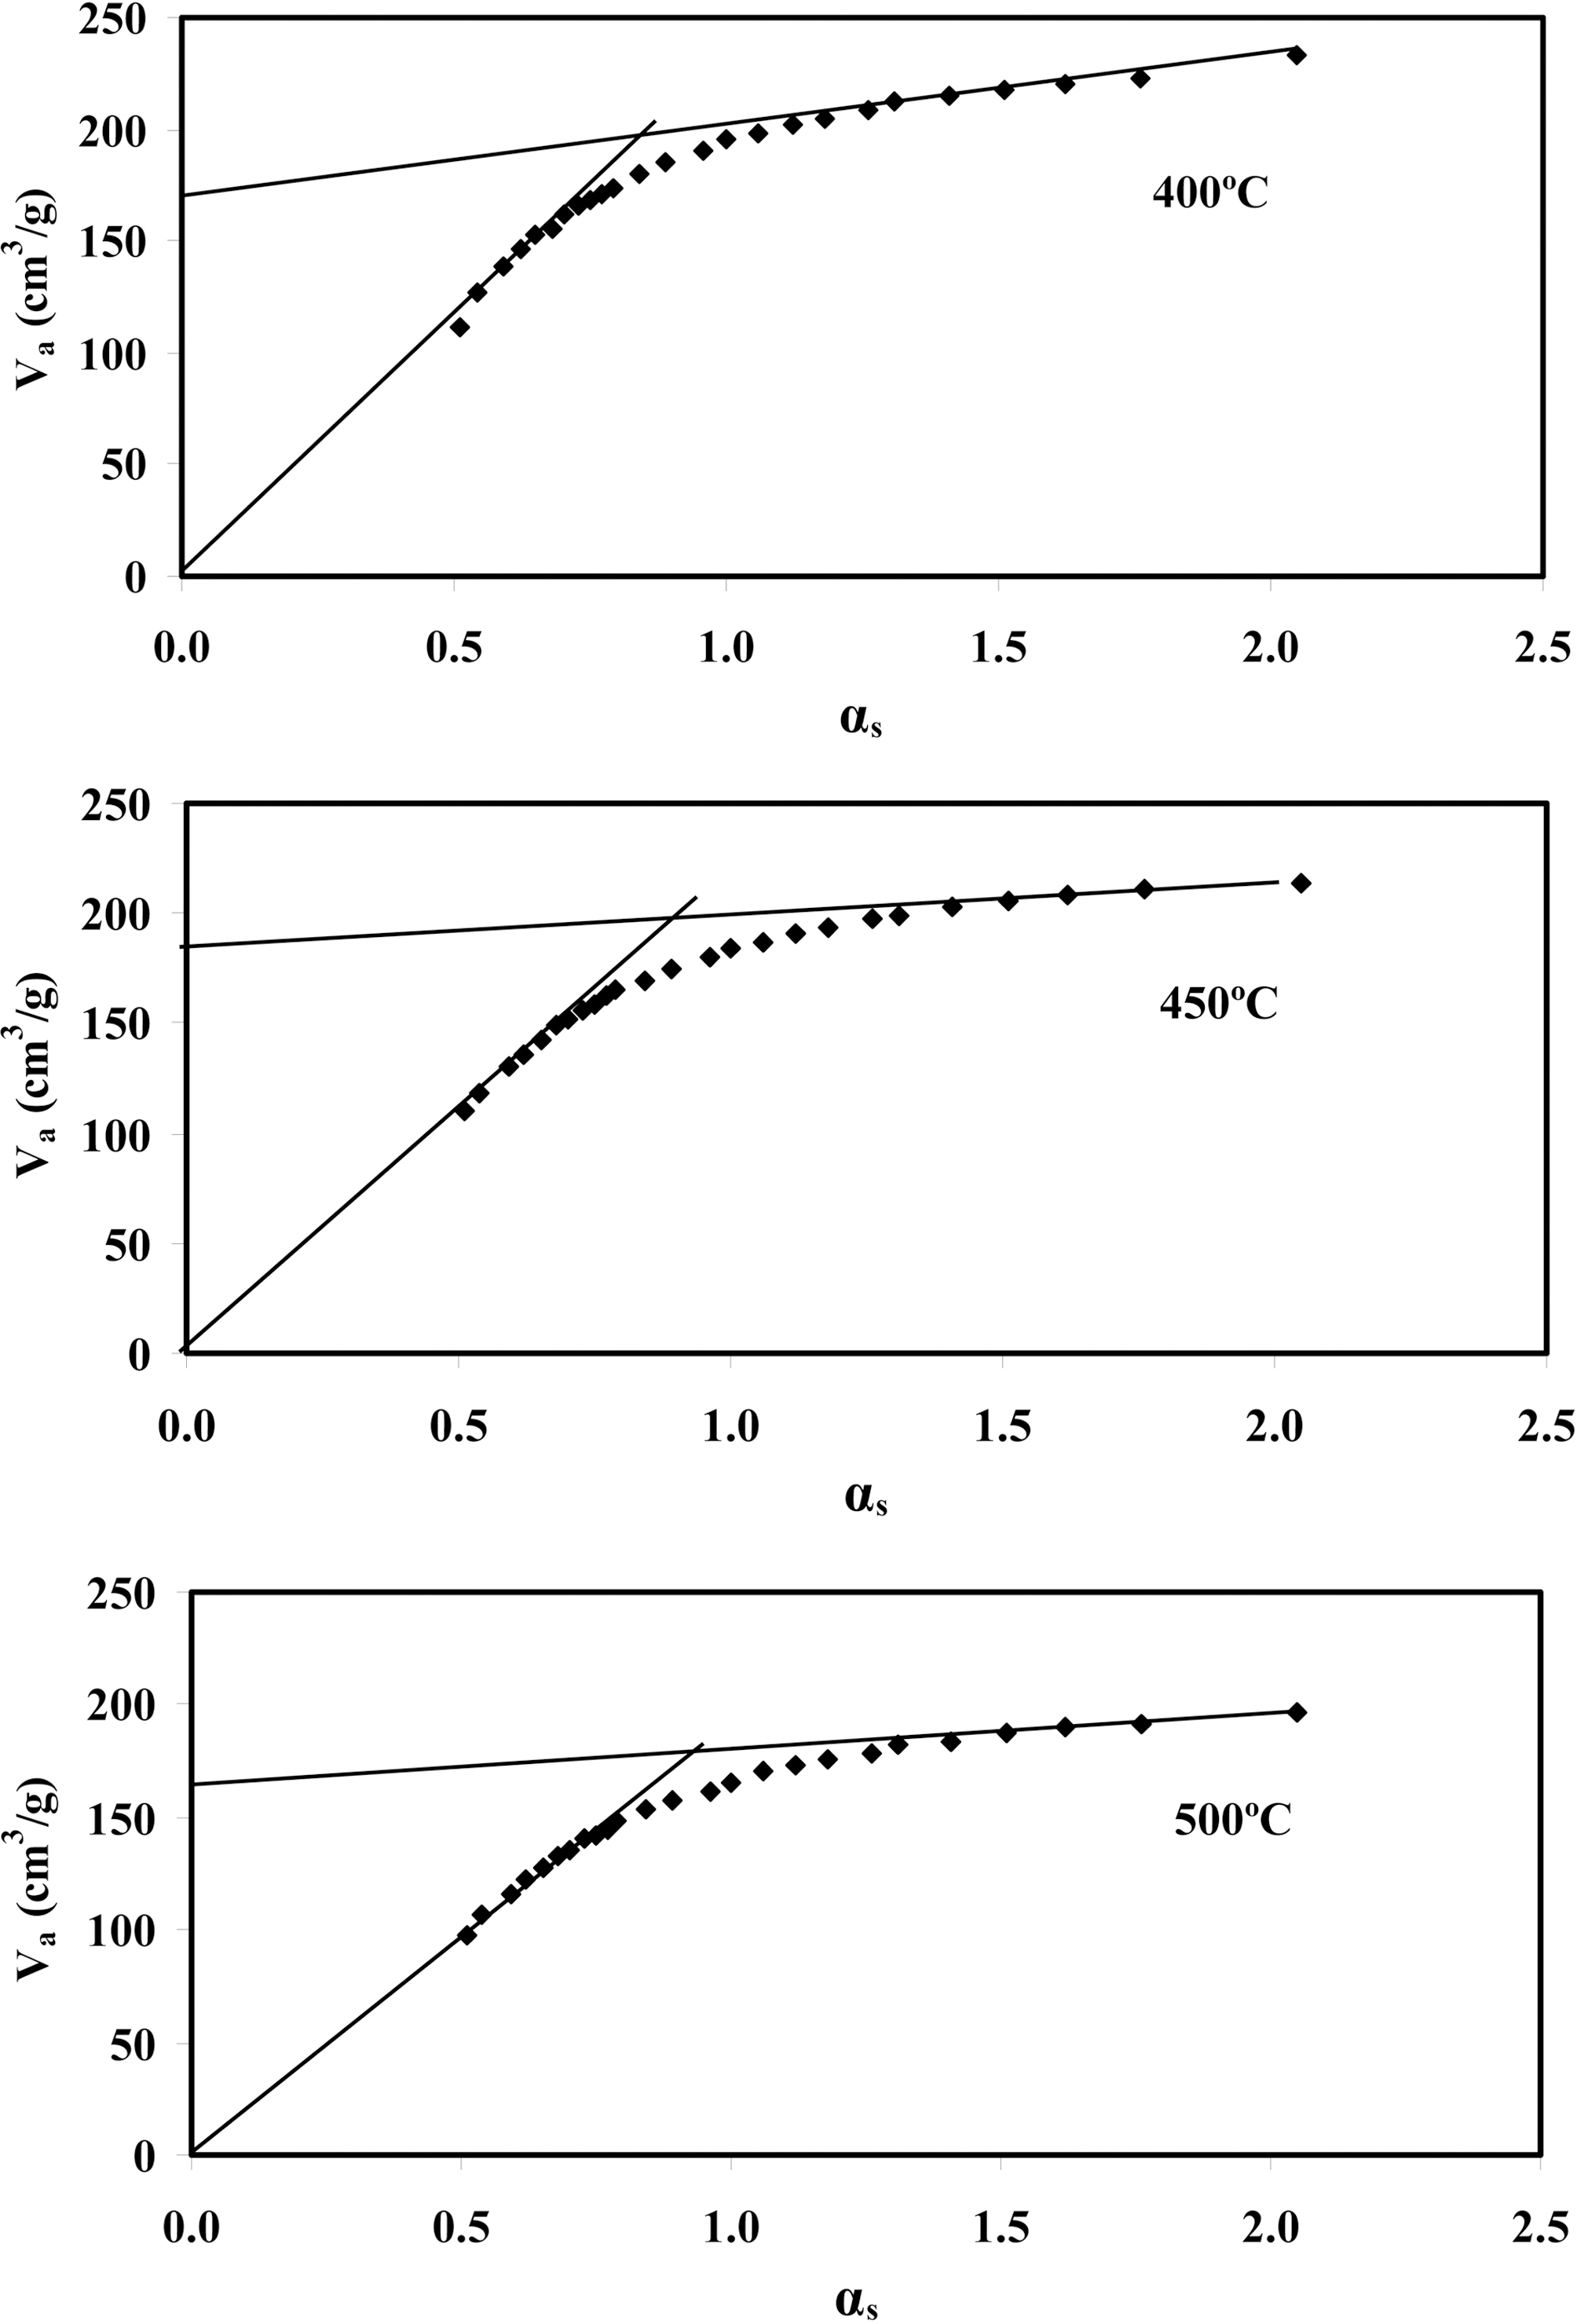
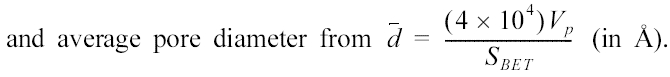
This was determined by the standard low temperature N2 adsorption at 77 K, recorded by a Sorptometer of the Type NOVA 3000 (Quantachrome Corp). Obtained adsorption isotherms (Fig. 1) were subjected to the IUPAC recommended analysis in comparison to a non porous carbon, as described by the αs- plot [31]. Standard data for αs-values were reported by Selles-Perez and Martin-Martinez [32]. Tested carbon adsorption data (Va, cm3/g) were, thus, plotted against the αs-values on reference material at the corresponding P/Po (Fig. 2). Three texture parameters could be obtained from the αs-plots: (1) the total surface area SA (Sαt) from slope of the first linear section connecting the adsorption points to origin, (2) the non-microporous surface area SA (Sαn) from slope of the rectilinear section connecting the later points (at αs 1.0) and (3) the micropore volume (Vαo) from intersection of the latter line extrapolated to meet the Va-axis (converted into cm3 of liquid nitrogen). Total pore volume (Vp) is currently obtained from volume of nitrogen adsorbed at P/Po = 0.95; also converted into cm3/g. Two other parameters are deduced:microporous SA = Sαt - Sαn , and mesoporous PV = Vp - Vαo,
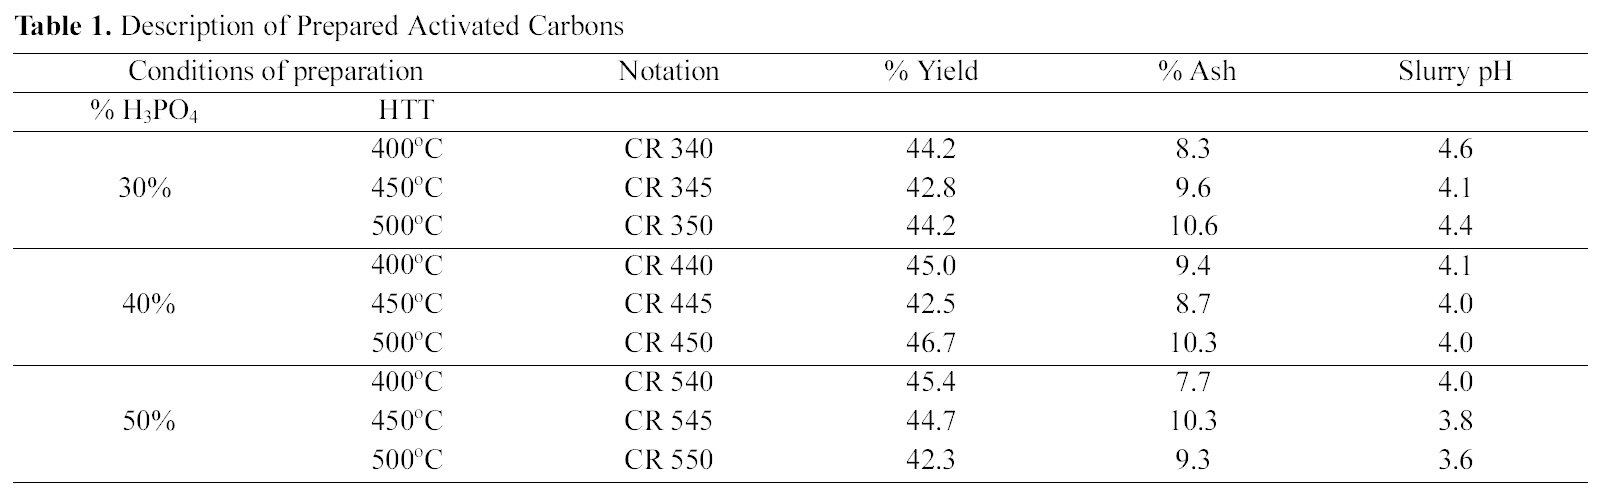
[Table 1.] Description of Prepared Activated Carbons

Description of Prepared Activated Carbons
These are collected in Table 2.
2.3. Decolorization capacity towards sugar liquor
Bach experiments were performed because it needs small amounts of the adsorbent w d hich was obtained as fine and
[Table 2.] Porous Characteristics of Activated Carbons Evaluated from N2-adsorption at 77 K
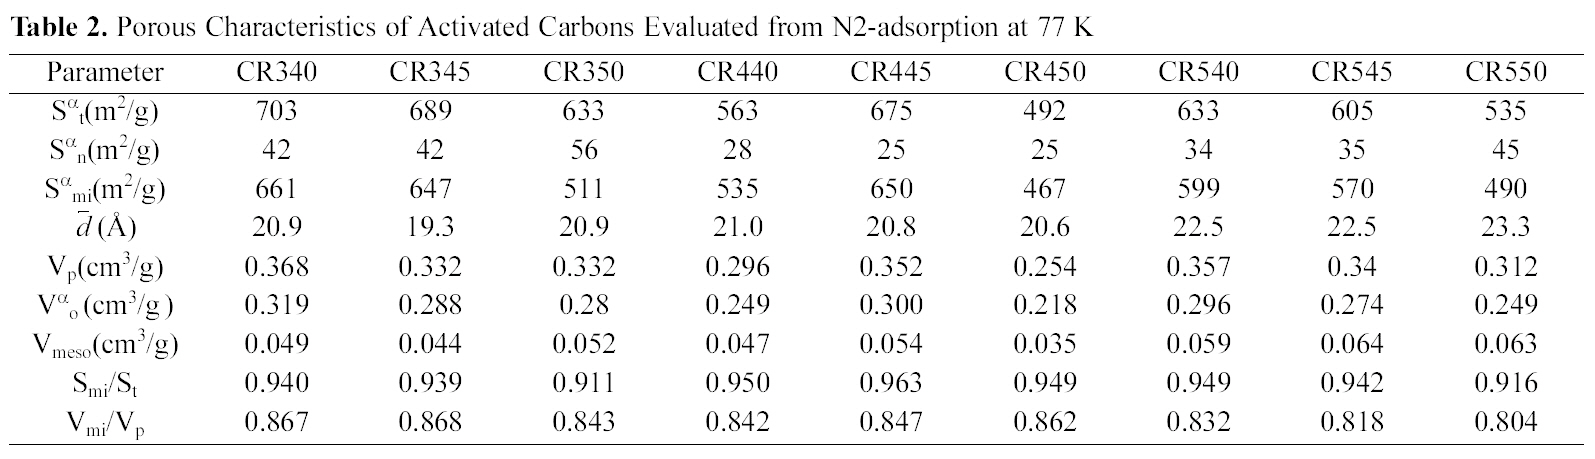
Porous Characteristics of Activated Carbons Evaluated from N2-adsorption at 77 K
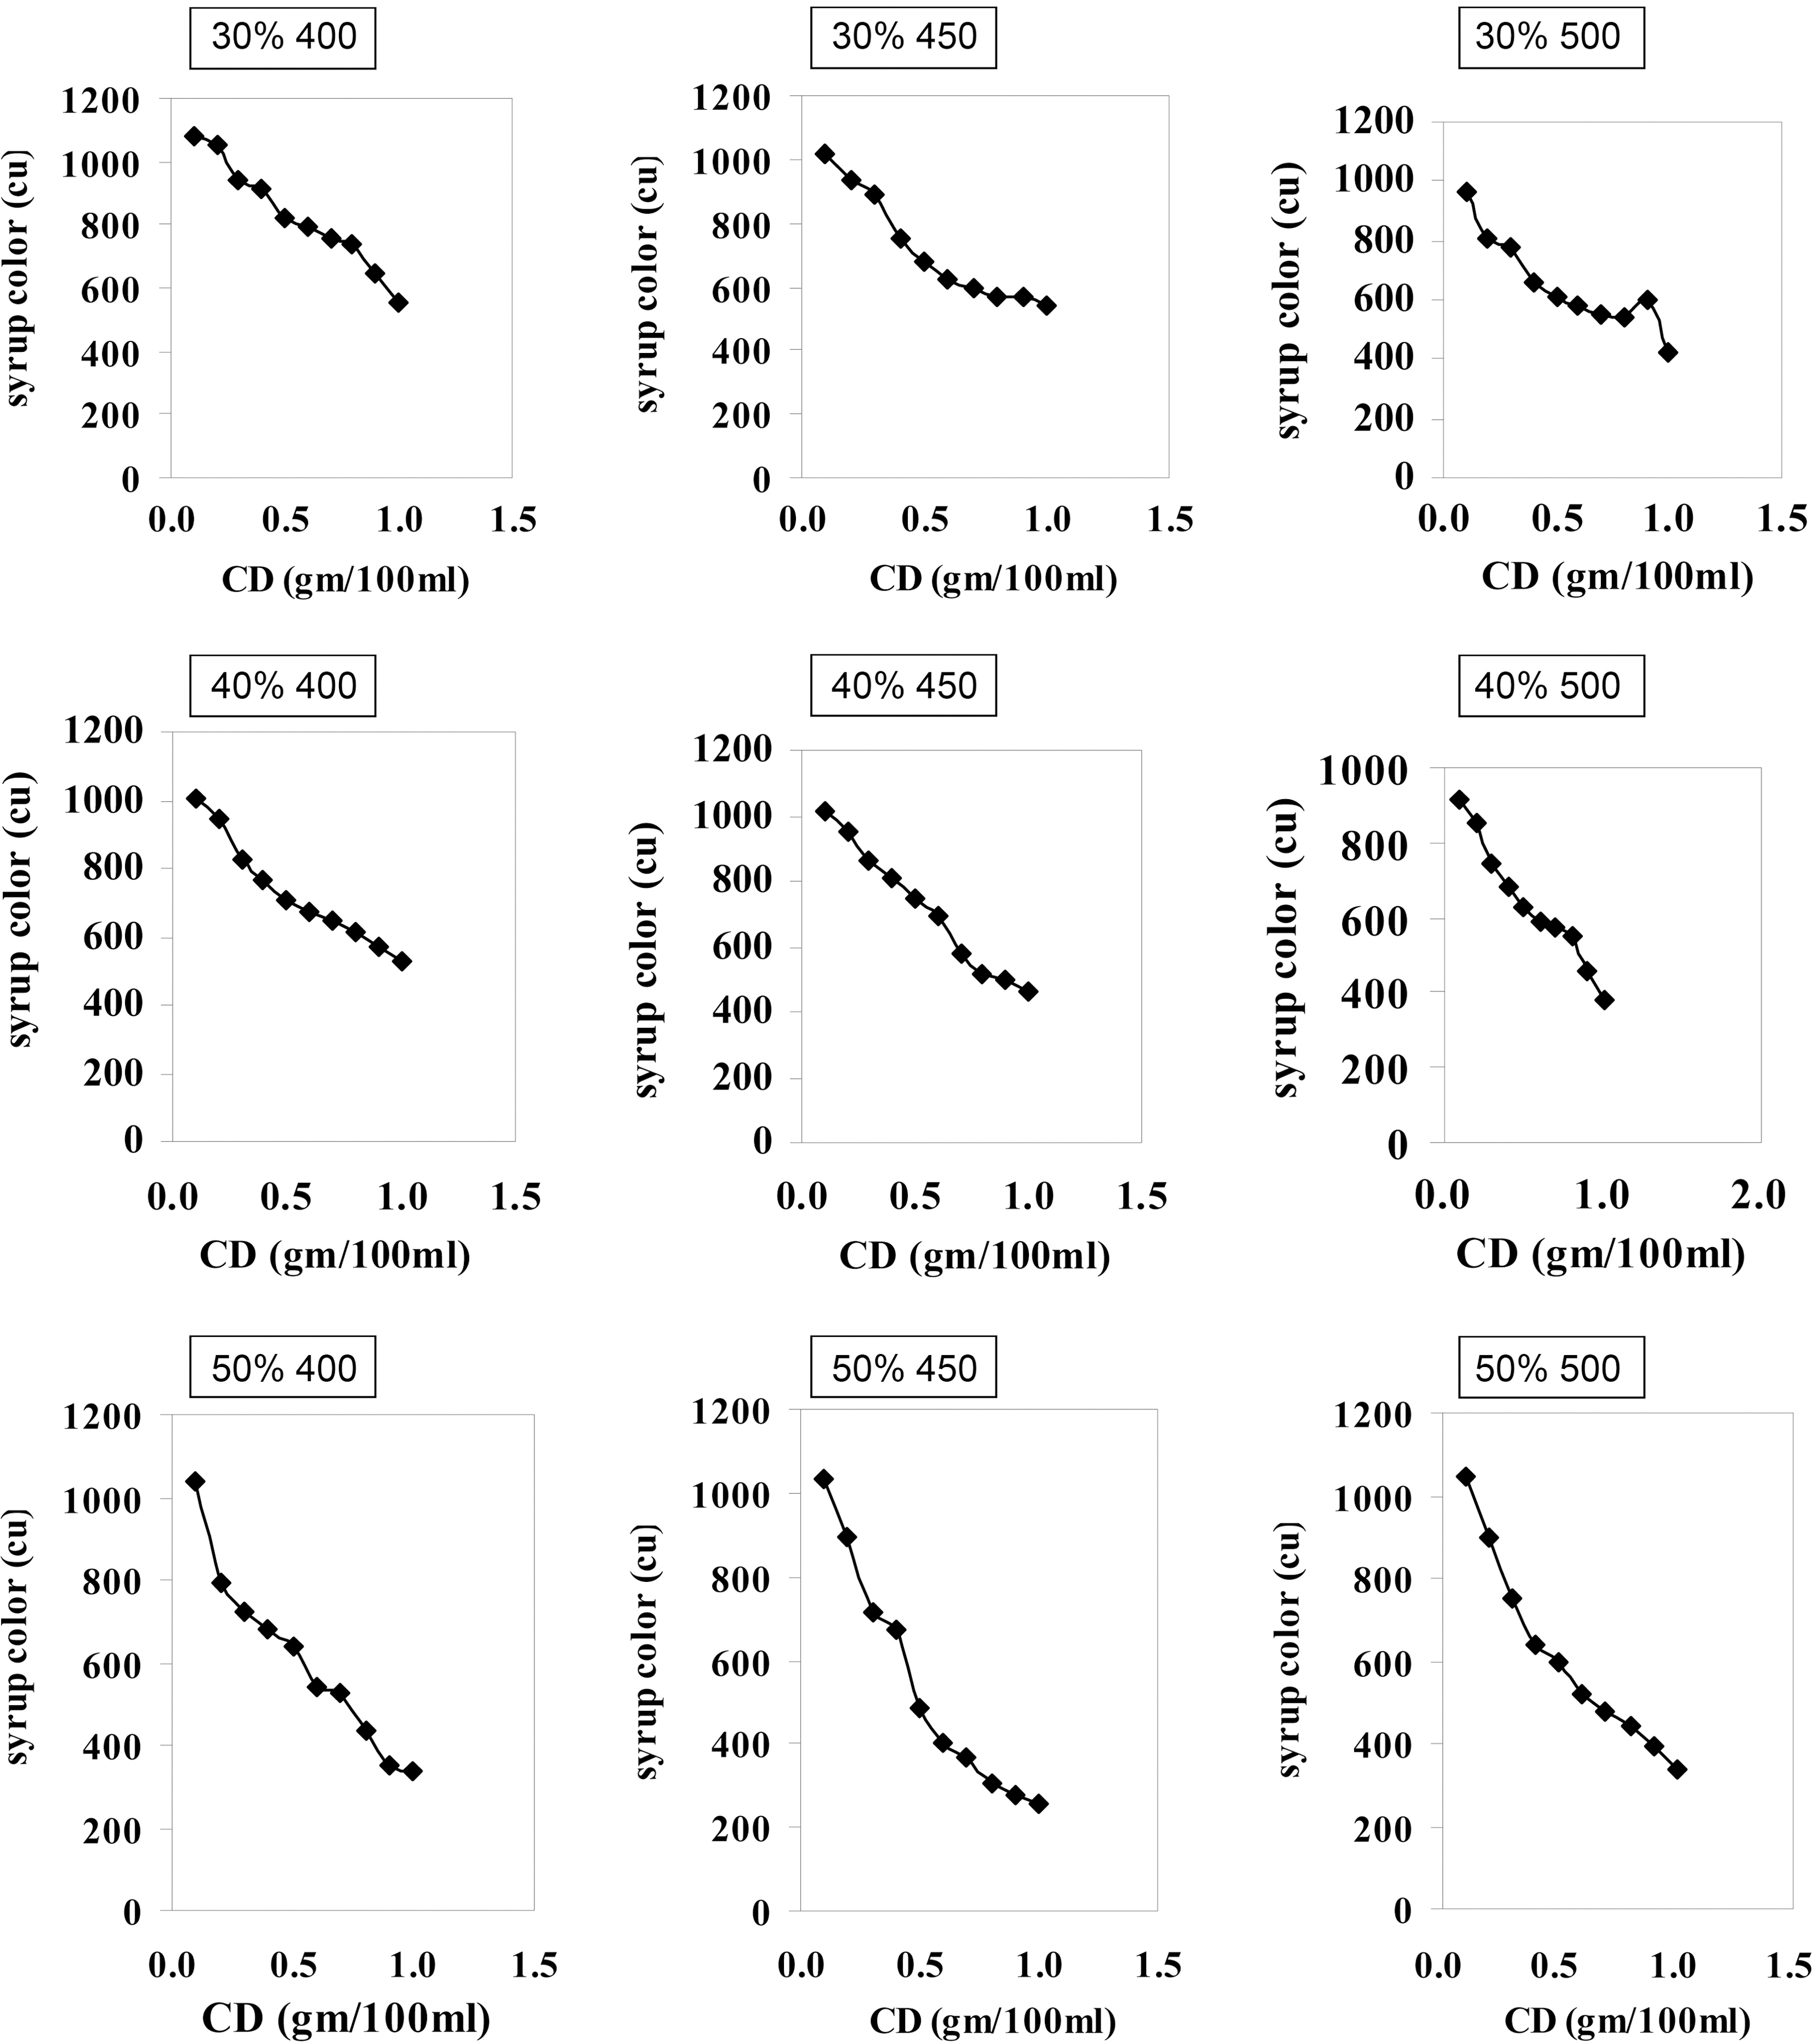
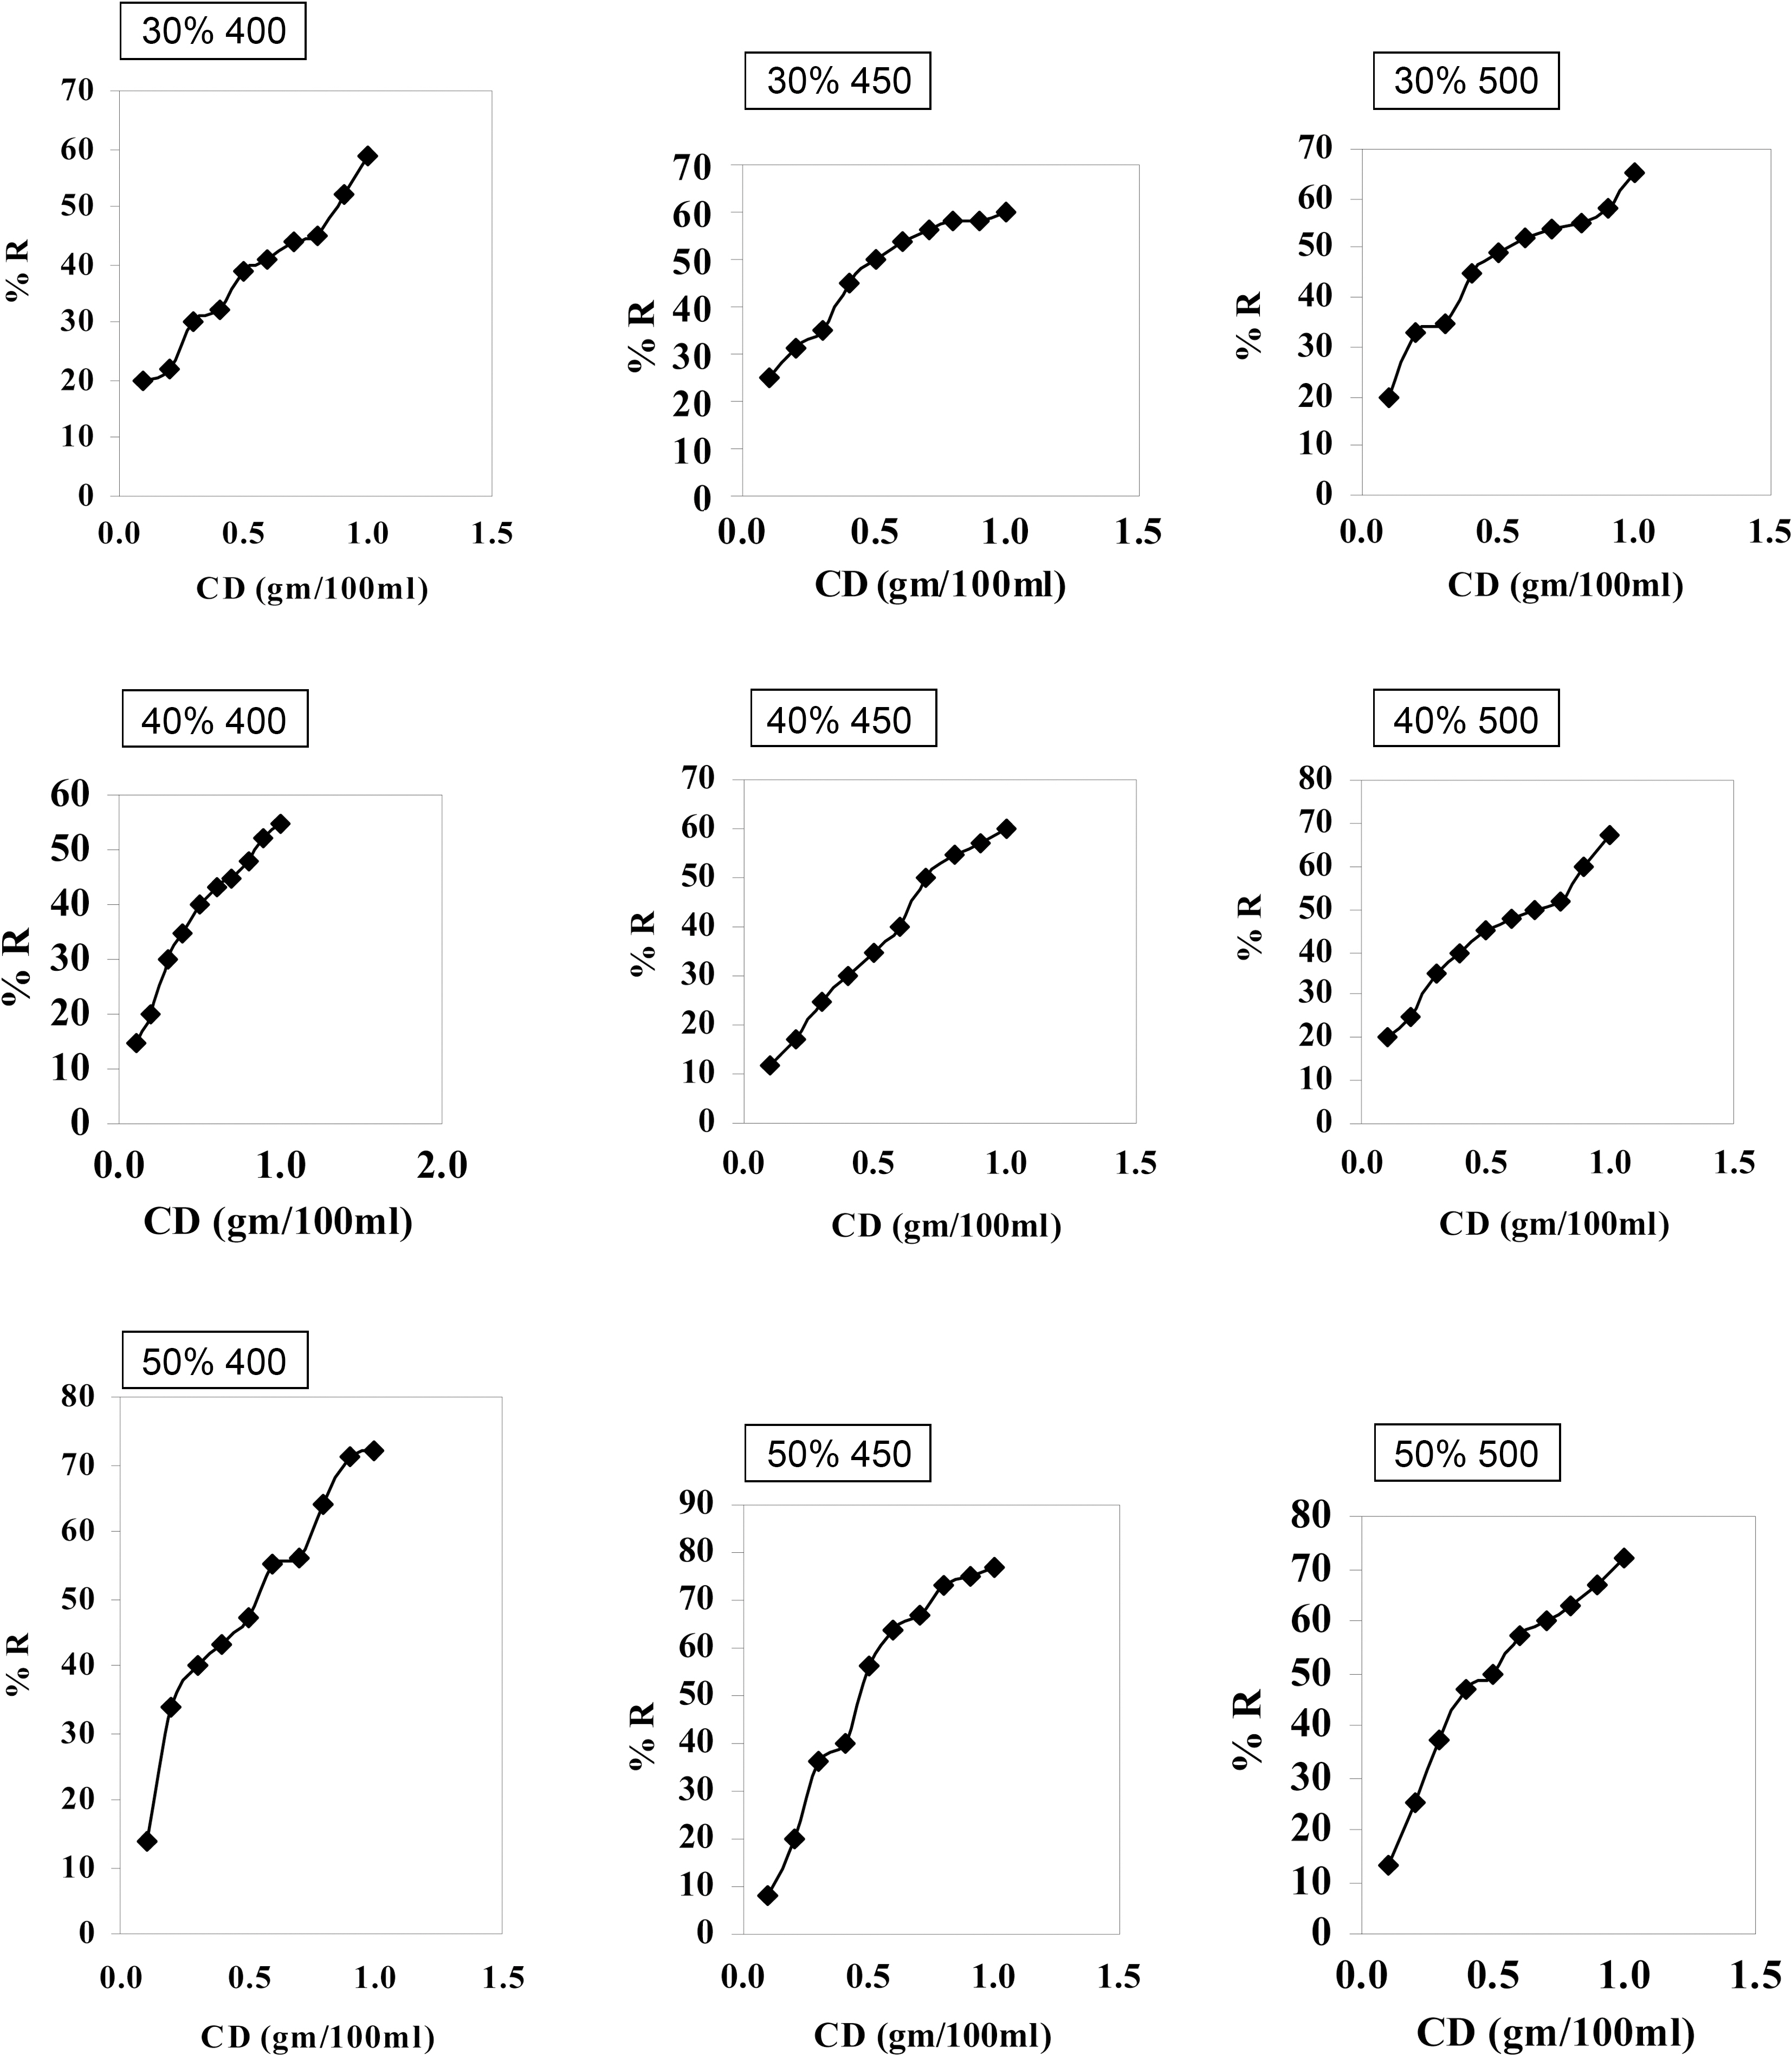
fragile particles. Single stoppered bottles were used where 100 ml of colored (factory-grade) sugar syrup were mixed with successively increased weights from 0.1 up to 1.0 g of the pre-dried, powdered AC, and slurry immersed in a hot water bath at 80℃. It was kept at this temperature for 15 min, with constant stirring filtered, and color of the cooled treated sugar liquor was measured using a Dr. Lang Spectrophotometer LP2 at λ max of 420 nm. The data are graphically presented either as residual color (in ICUMSA units), or percent removal (%R), as function of carbon dose (CD). Before each experiment the color intensity of stock syrup was measured before adding the adsorbent so as to obtain the degree of decolorization (%R).
3.1. Physico-chemical and textural characteristics of activated carbons
Nine activated carbons are developed here under mild conditions of phosphoric acid concentrations of 30~50 v/v% (% P) and heat treatment temperatures of 400~500℃ (HTT). The process seems feasible, as previously treated with other plant by-products. It gives an activated carbon yield of 42.3~

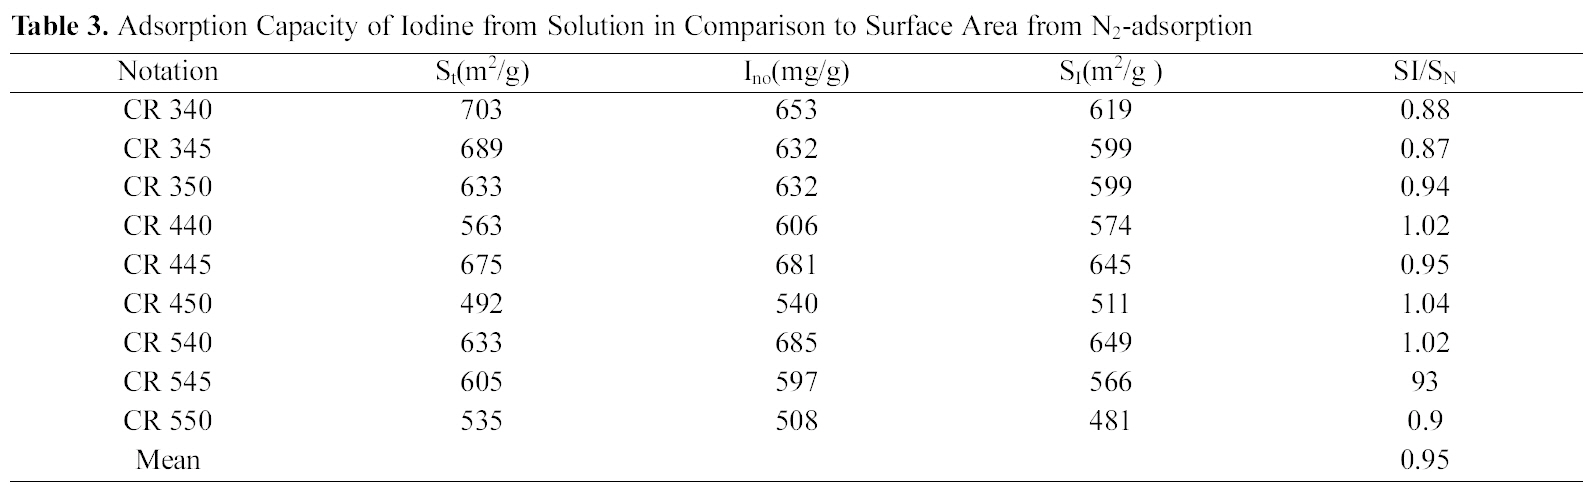
Adsorption Capacity of Iodine from Solution in Comparison to Surface Area from N2-adsorption
46.7% with ash contents ranging between 8.3 and 10.6% (Table 1). The origin of such inorganic matter could be ascribed to: (a) the inherited parent CR plant minerals (ash = 4.3%), and (b) additional inorganic minerals accumulated through dehydration of the activant medium (H3PO4) forming phosphate products (polyphosphates, as well as organic and inorganic phosphates). These are permeated in the intricate porosity, and some of them are not easily leached in the washing process. These compounds might explain the observed acidity character (slurry pH = 4.6~3.6) of these H3PO4-activated carbons, as recently postulated by Puziy
Prepared carbons exhibit moderate textural properties (Table 2) with total surface areas Sαt of 492 up to 703 m2/g, total pore volumes (Vp) of 0.254 up to 0.368 cm3/g, and average pore diameters (d = 19.3 - 23.3 A). They possess typically microporous character, as the evaluated external (or non-microporous) surface areas are only 25~56 m2/g, thus constituting only about 5 to 8% of total surface area. An estimation of microporosity, with respect to surface area or pore volume, is given in the last two lines of Table 2 where it appears that the hereby derived activated carbons are essentially microporous. The degree of (or fractional) microporosity in surface area (Smic/Sαt = 0.911 to 0.963) and in pore volume (Vmic/Vp = 0.818 to 0.868). Such microporous character is anticipated to provide moderate decolorizing power as will
be presented in next section.
Table 3 collects the estimated iodine number (Ino) currently mentioned in technical brochures of activated carbons. Determined values of Ino run parallel to the surface areas evaluated from the low-temperature N2-adsorption. Taking into consideration the established cross-sectional area of I2 to be 40 A2, the iodine numbers are converted into surface area accessible to iodine SI by multiplication with a factor of 0.948. Their ratio to N2-SA are found to range between 0.9 up to 1.04, which indicate that although iodine possess a small diameter (~10 A), part of the internal porosity (~10%) appears inaccessible to it. This might also implicate an expected difficulty of diffusion of the sugar colorants, with bulkier size, into the whole internal porosity of the derived activated carbons.
3.2. Sugar liquor decolorization capacity by the activated carbons
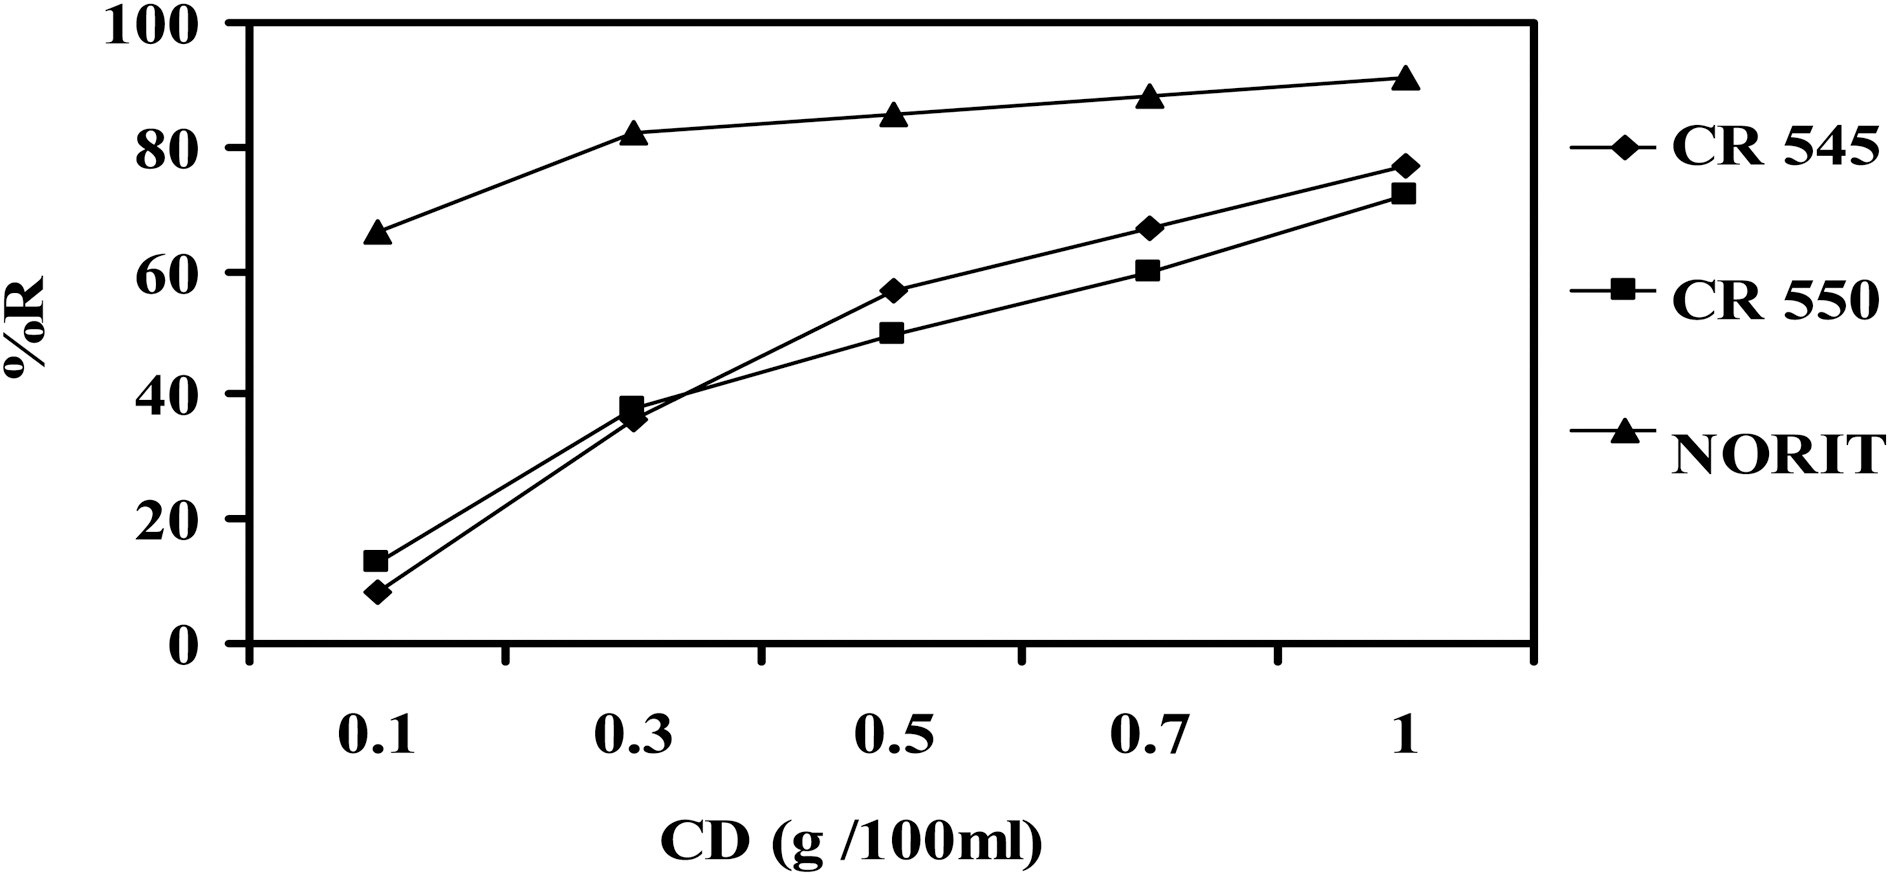
The decolorization experiments were performed under same standard conditions: bottles with 100 ml of sugar liquor (ICU = 1100~1360), temperature of 80℃, contact time = 15 min, and carbon dose (CD) per bottle = 0.1 up to 1.0 g. Obtained data are presented as: (a) filtrate color in ICU, and (b) degree of color removal in percent (%R), as function of carbon dose (CD) (Figs. 3 and 4). A decolorizing carbon (N), available in the factory, was tested under the same conditions for the sake of comparison. Table 3 gives
collective data for the activated carbons at selected CD values, and compared to
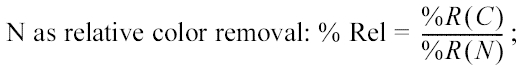
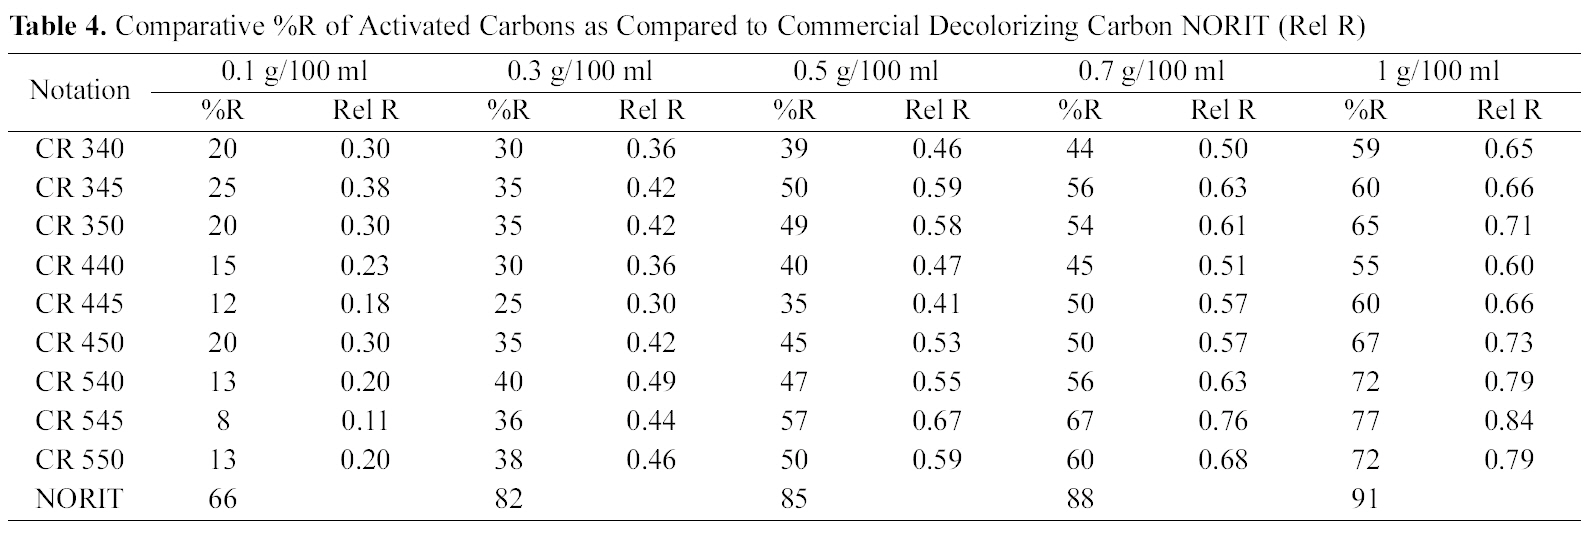
Starting with factory-grade raw sugar syrup with color intensity of 1120~1360 (ICU), we obtained a successive decrease in color (ICU), and increase in %R, as function of carbon dose mixed with the hot liquor. Optimum liquor color attained values (at maximum CD = 1.0 g) ranged between 553 and 252 ICU, corresponding to removal capacity of R =55 up to 77%. Such values appear to be much lower than decolorization by carbon N whose color appears at CD 1.0 g as 95 (ICU) and R = 91%. Relative color removal capacity of our carbons (Rel R) appears as 0.6 up to 0.84, at the optimum carbon dose of 1.0 g/100 ml. This might anticipate that in order to reach acceptable color around 100 ICU, and color removal of 90%, higher carbon doses should be required. Interpolated values of CD to attain comparable values were estimated by approximate extrapolation, are found to vary from 1.52 up to 2.32 g/100 ml. The lowest efficiency belong to carbon 40/400℃, whereas the best decolorization carbon is the CR 50/450℃, this is confirmed by Rel R = 0.84 and recommended CD of 1.5 g/100 ml (Table 4). Thus, a laboratory prepared activated carbon from

Comparative %R of Activated Carbons as Compared to Commercial Decolorizing Carbon NORIT (Rel R)
common reed by 50% P (450℃) seem to be a promising decolorizing carbon useful in refining factory-colored sugar liquor to get acceptable refined sugar suitable for the next crystallization process.
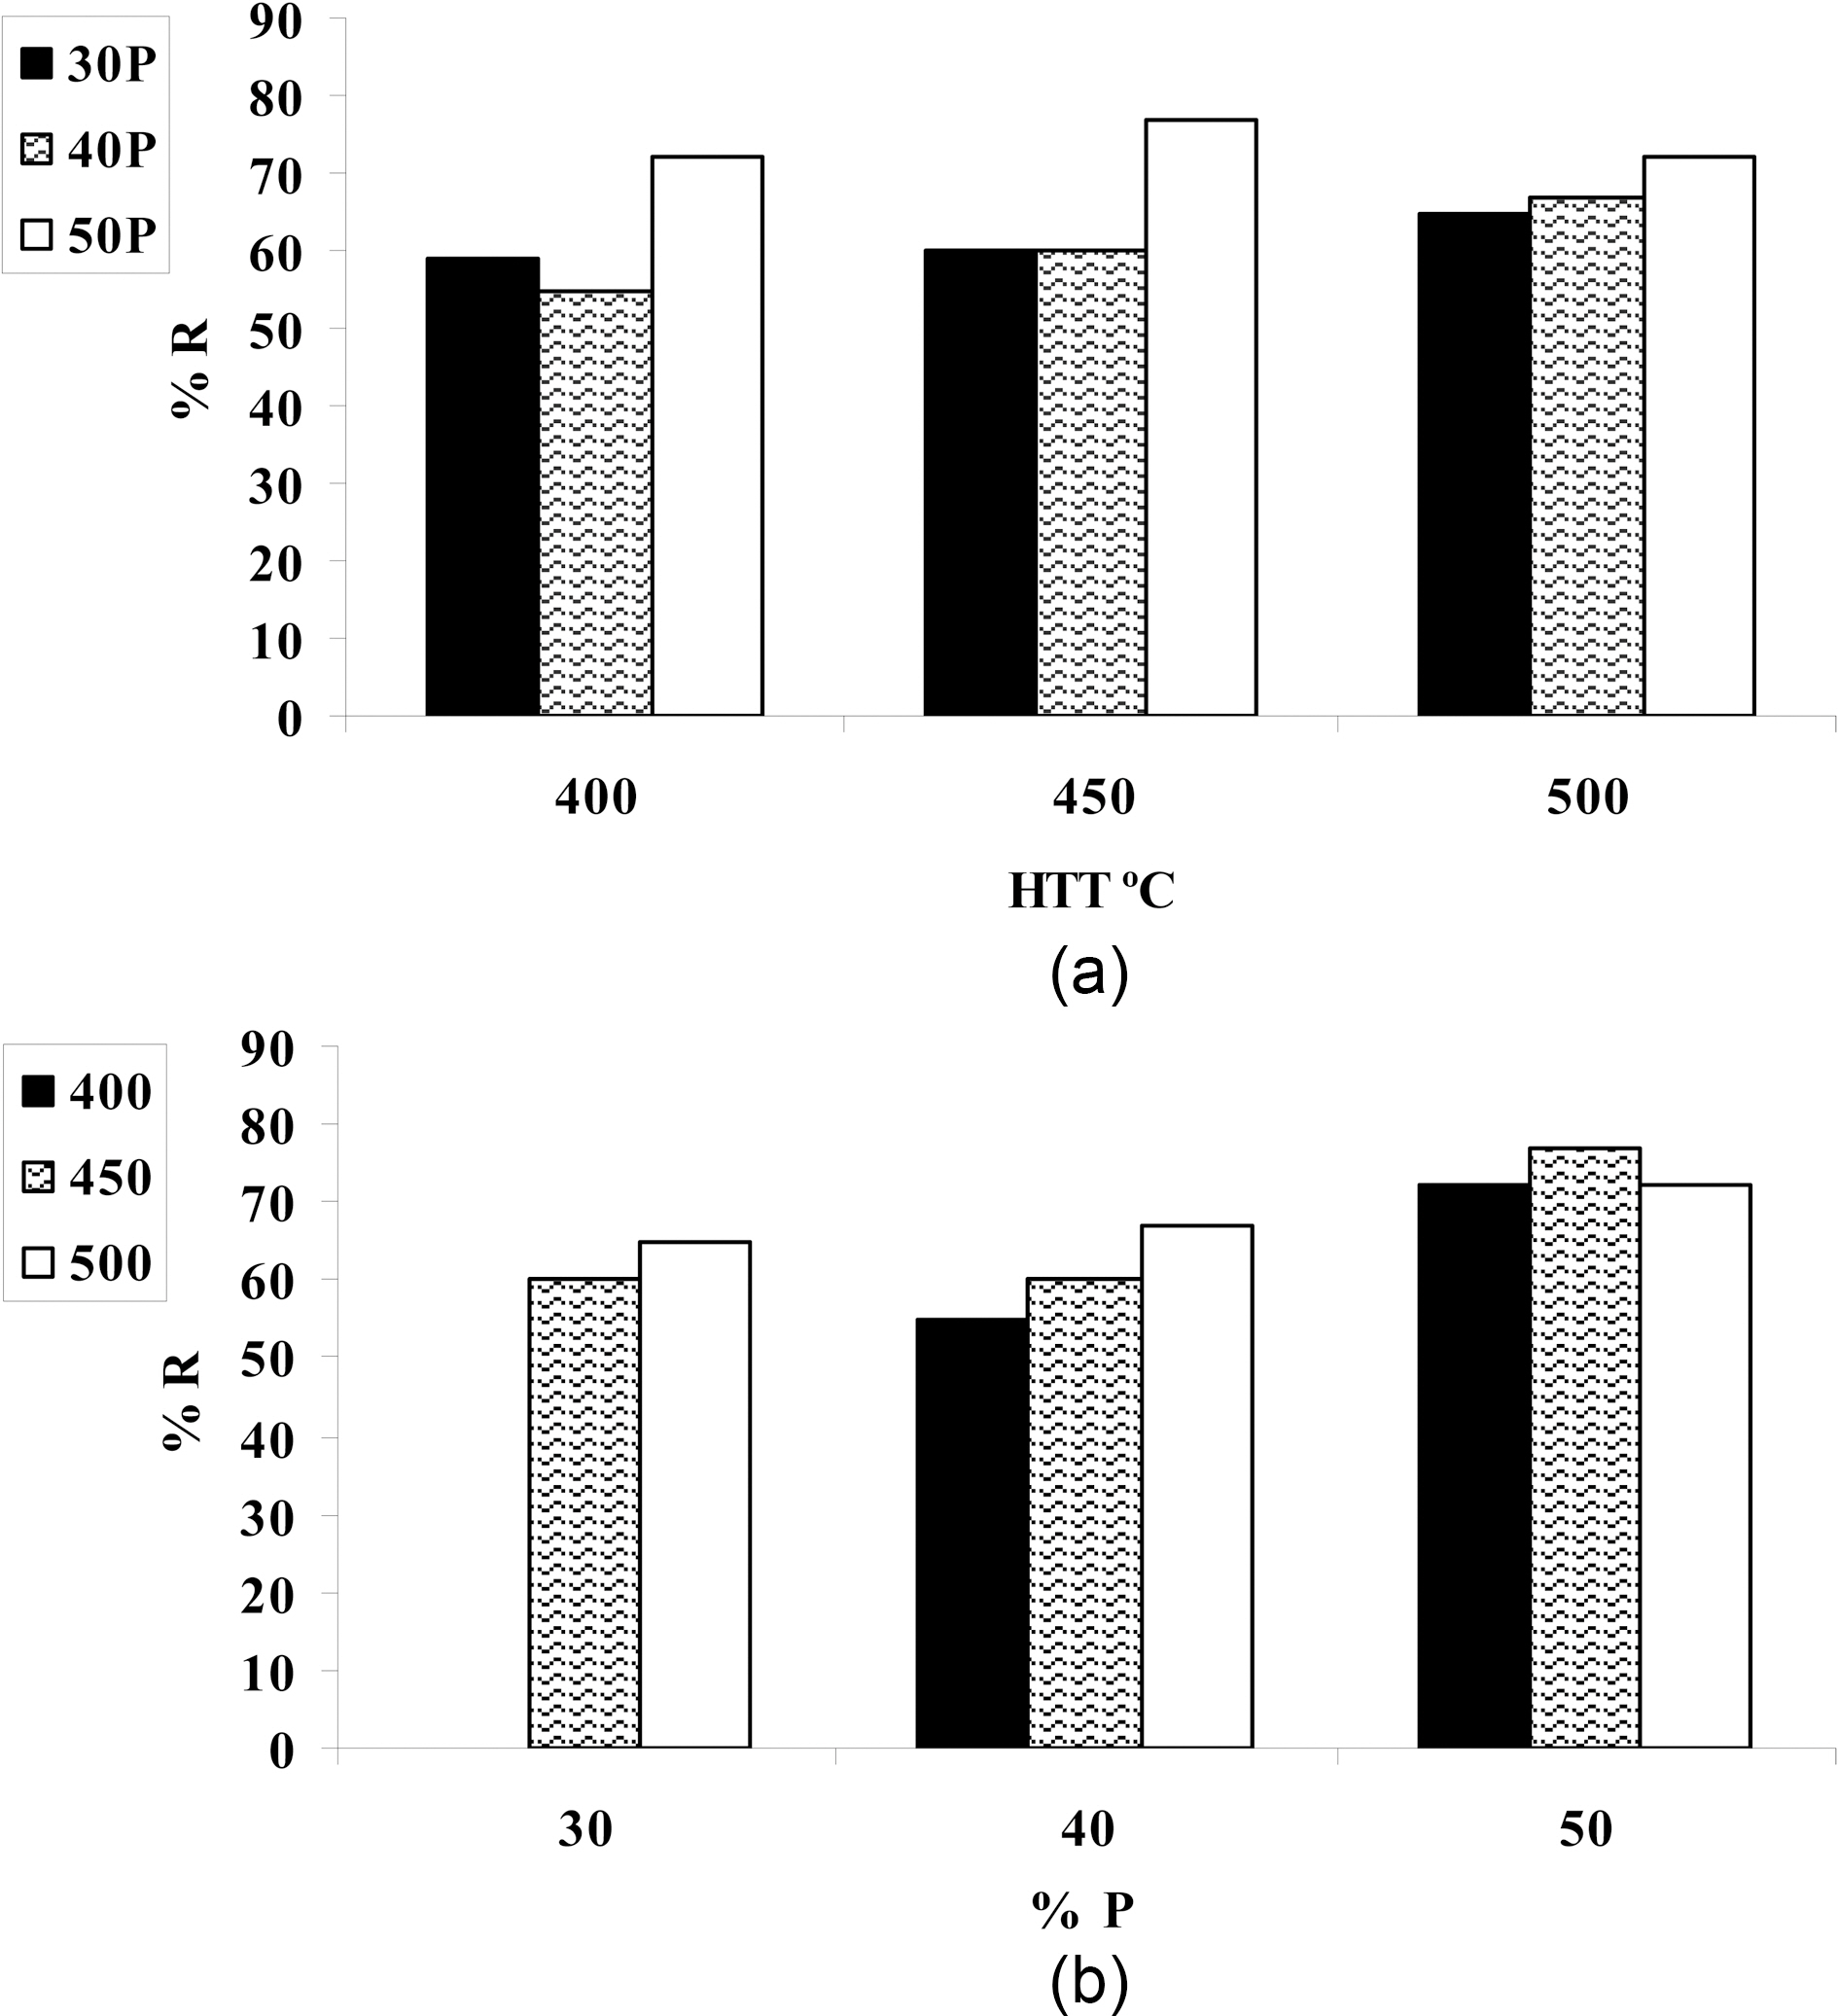
3.3. Impact of activation factors on the decolorizing power
The two processing factors considered here were: the impregnant strength (v/v% H3PO4) and the heat treatment temperature (HTT). Their consequent effect on the decolorization capacity towards sugar liquor is important in order to optimize the conditions of preparation for this specific purpose and to assess the feasibility of local common reed as
a prospective raw material for production of adsorbing carbon. Fig. 5 displays a correlation between maximum decolorization capacity for sugar liquor and the two variables of carbon preparation. Thus, raising the HTT (Fig. 5(a)) seems to inflict very small promotion in % R, especially at 30 and 40% P. At the highest activant concentration of 50%P, a temperature of 450℃ appears as the most effective with %R = 77%. On the other hand, Fig. 5(b) displays that raising the % P enhances, generally, %R the strong effect appears at 450℃. Pyrolysis at 400℃ does not show a regular effect on % R whereas a drop followed by a raise at the highest activant concentration occurs. Generally, the color removal capacity for sugar liquor appears to be a function of % P, although a moderate HTT of 450℃ seems to be appropriate.
3.4. Comparison of decolorization capacity to the carbon - N
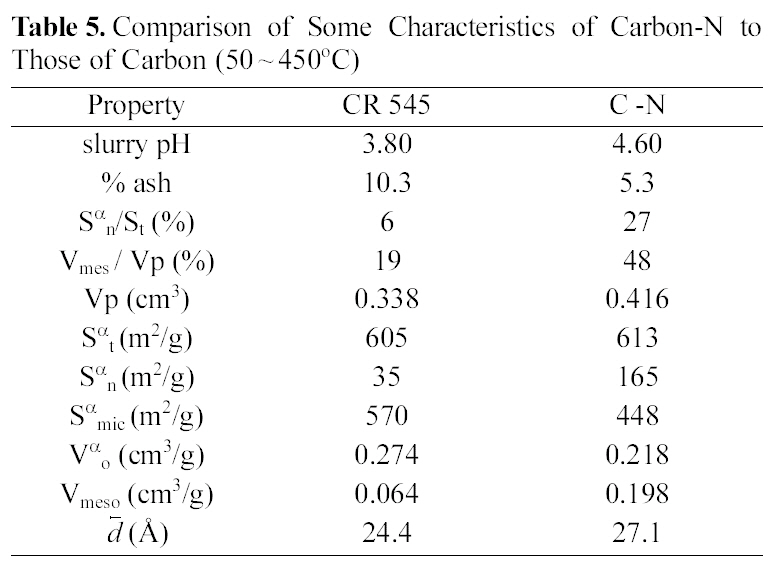
In order to understand the cause of difference, Table (5) collects some characteristics of C-N as compared to the best decolorizing carbon (CR 50/450℃). The most striking difference appears at the low carbon doses, between 0.1 and 0.5, where the commercial carbon achieves distinguished decolorization capacity (from around 6 to 1.5 fold higher). At a maximum carbon dose of 1.0 g/100 ml liquor, the two
carbons approach each other where the laboratory-prepared activated carbon AC attains 84% the capacity of carbon N. Searching for the origin of this difference between the physico-chemical and textural properties reveals the following: (1) both carbons measured same total SA (~600 m2/g), however the external (or non-microporous) SA of N is around 5- times higher than carbon CR 50/450 (viz 165 and 35 m2/g, respectively). Micropore SA and PV are much lower in carbon N (viz 448 and 570 m2/g, and 0.218 and 0.274 cm3/g) (3) degree of mesoporosity (Sme/St and Vme/Vp) is clearly higher in N than in (CR 50/450) viz 27 vs. 6, and 48 vs. 19%, respectively. It appears, thus that the developed mesoporosity character in the technical decolorizing carbon promote its color removal capacity, as an essential property for this process. Other properties may bring about minor effects, such as the low ash content and relatively higher slurry pH (Table 5). Extrapolation of the decolorization curves proved that to attain the commercial capacity, 1.5 g/100 ml liquor is needed to achieve the removal capacity of N (to reach an ICU of 100, or 90% R) (Table 6). Nevertheless, this amount will over compensate by far the much higher price of the imported carbon, as the hereby derived product is locally obtained from a cheap copious undesirable feedstock under a cost-effective activation process.
[Table 5.] Comparison of Some Characteristics of Carbon-N to Those of Carbon (50 ~ 450℃)

Comparison of Some Characteristics of Carbon-N to Those of Carbon (50 ~ 450℃)
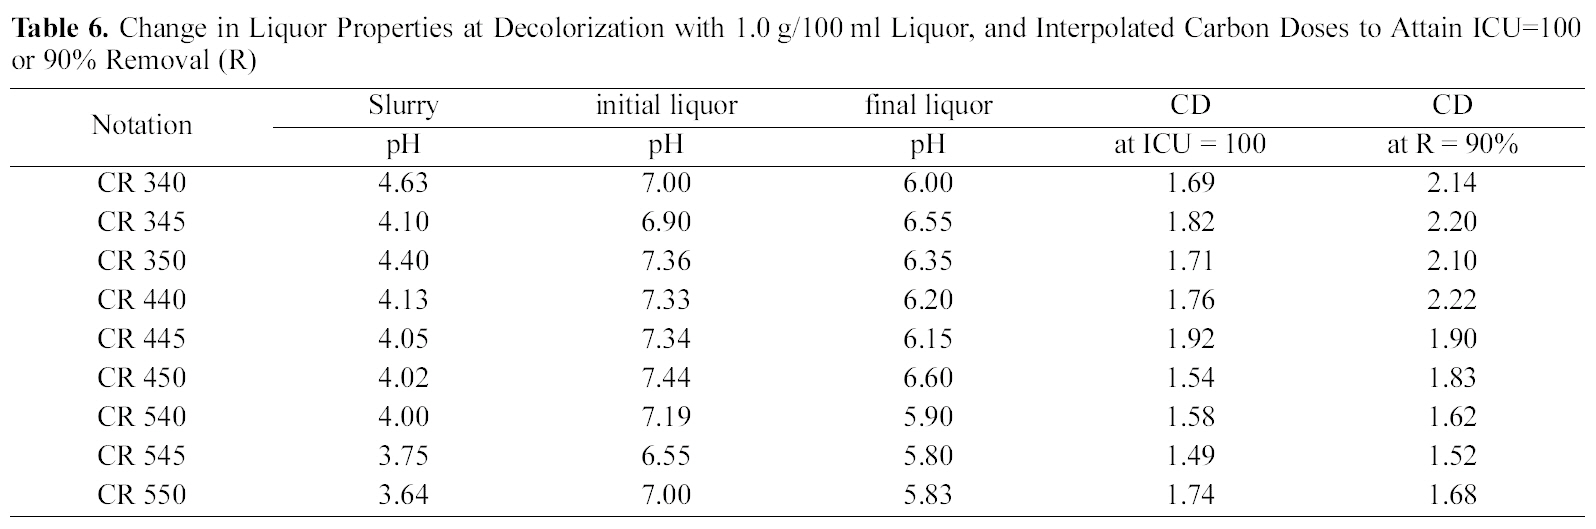
Change in Liquor Properties at Decolorization with 1.0 g/100 ml Liquor and Interpolated Carbon Doses to Attain ICU=100 or 90% Removal (R)
Common reed (