

In the present study, the removal of Pb (II) ions on oxidized activated carbons (ACs) was investigated. ACs were derived from activation of indigenous cotton stalks waste with potassium hydroxide (KOH) in two-stage process. The KOH-ACs were subjected to liquid-phase oxidation with hot HNO3 and one untreated sample was included for comparison. The obtained carbons were characterized by Fourier transform infrared (FTIR), slurry pH and N2-adsorption at 77 K, respectively.Adsorption capacity of Pb (II) ions on the resultant carbons was determined by batch equilibrium experiments. The experimental results indicated that the oxidation with nitric acid was associated with a significant increase in mass of yield as well as a remarkable reduction in internal porosity as compared to the untreated carbon. The AC-800N revealed higher adsorption capacity than that of AC-800, although the former sample exhibited low surface area and micropore volume. It was observed that the adsorption capacity enhancement attributed to pore widening, the generation of oxygen functional groups and potassium containing compounds leading to cation-exchange on the carbon surface. These results show that the oxidized carbons represented prospective adsorbents for enhancing the removal of heavy metals from wastewater.
Growing awareness and concern from the impact of water pollution by heavy metals (HMs) on the aquatic life and environment is considered a serious problem to urge the attention of researchers. Natural waters can be contaminated by metal ions as a result of residual discharges from industries or mining activities [1]. HM ions such as Co (II),Cu (II), Ni (II), Cr (VI), Zn (II), and Pb (II) are detected in the waste streams from mining operations, electroplating and metal finishing industries, and metallurgical industries. Lead is an important compound used as an intermediate in processing industries such as plating, paint and dyes, glass operations and lead batteries [2]. The permissible limit of Pb(II) ions in drinking water and surface water intended for drinking, as set by European Union, US Environmental Protection Agency and World Health Organization are 10,15, and 10 ppb, respectively [3-5]. In Egypt, the primary drinking water standard from lead is 10 ppb. The presence of excess lead in drinking water causes diseases like anemia,encephalopathy, and hepatitis [6].
Various techniques such as chemical precipitation, ion exchange, membrane filtration, reverse osmosis or adsorption have been applied to remove Pb (II) ions from wastewater discharges [1,2,6-8]. Among these methods, adsorption onto activated carbon (AC) is considered quite attractive in terms of its efficiency of HMs removal from aqueous solutions.This feature is due to porous characteristics of activated carbons such as high surface area, high adsorption capacity,specific surface reactivity and adequate surface chemistry(surface functional groups) [9-11]. Thus, the surface chemistry and porous structure of carbons determine their applications;whatever used as adsorbents, catalyst/catalyst supports, energy storage materials, etc. The surface chemical functional groups mainly derived from activation process, precursor, heat treatment, and post chemical treatment [12]. Moreover,modification of the surface chemistry of ACs was recognized as an attractive route toward novel application of these materials [2].
For this purpose, some oxidative (acid) treatments have been investigated to obtain oxidized ACs with different distribution of oxygen containing groups (acidic, basic or neutral) either is in gas or liquid phase. In the liquid phase,the most familiar oxidation media include nitric acid,perchloric acid, sodium perchlorate, potassium permanganate,hydrogen peroxide, or potassium persulfate [13]. Nitric acid oxidation (HNO3) has been the most extensively used in pretreatment of ACs during the last decade [14-17]. In general, acid treatment enhanced the acidic property, removed the mineral elements and improved the hydrophilic nature of surface; thus, rendering the surface more accessible to the aqueous phase [12,18]. In this connection it is relevant to
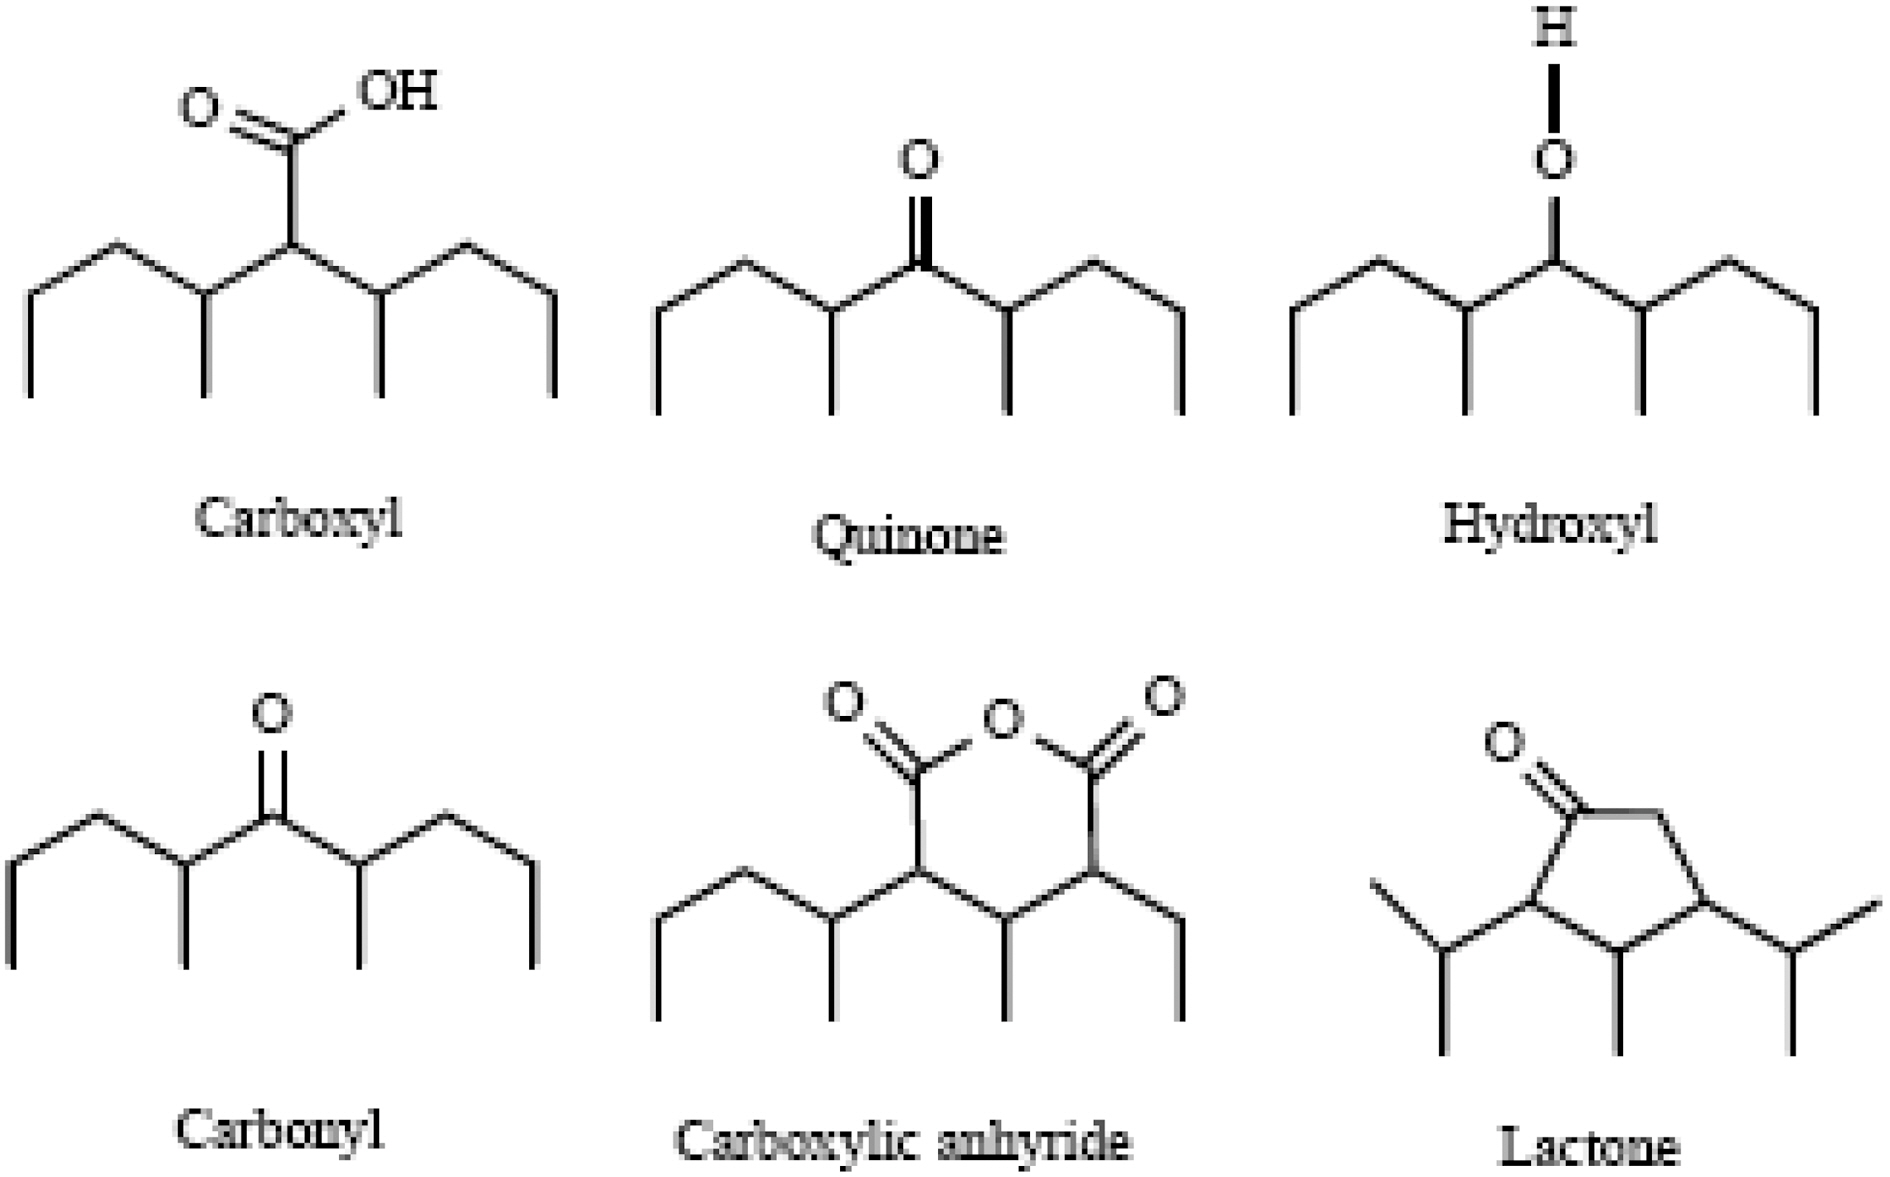
indicate that the treatments of ACs with HNO3 solutions produced mass and surface changes, depending on the solution concentration, outgassing and contact conditions [19].Also, it originates oxygen containing functional groups such as carboxylic, carboxyl, carbonyl, phenol, and quinone and lactone groups on carbon surfaces as shown in Fig. 1 [20].
Despite a variety of commercially available carbons,advanced carbon adsorbents for enhanced performance and lower cost are presently requested [21]. Basically, ACs are manufactured by the pyrolysis of carbonaceous materials of vegetable origin, such as wood, coal, peat, fruit stones and shells, or synthetic polymers such as viscose rayon, PAN, or phenolics, followed by activation of the chars obtained from them. This route is known as the “physical (or thermal)scheme” of activation, as it involves two thermal treatment stages in the presence of gas such as CO2,air, or steam. An alternative route, also a well-established and old as well, is denoted by the “chemical activation scheme” and involves only one thermal treatment stage comprising both decomposition and activation steps in the presence of activating agents such as ZnCl2, H3PO4, KOH, NaOH,…etc. [22]. However, it has been reported recently that ACs with high surface area can be developed by potassium hydroxide (KOH) activation of pre-carbonized cellulosic biomasses [23]. It has been pointed out that the chemical reactions between KOH/or NaOH and carbon occurred during the activation process as follows [24]:
Obviously, =CH2 species is necessarily required to react with KOH to produce the precursor K2CO3 and K2O species.These species on the surface of the precursor played a key role in the chemical activation. Also, the formation of K2CO3 on the carbons was accompanied by a simultaneous evolution of CO2 and CO. Thus, C-O-K species formed at the carbon surface which act as “active sites” in the gasification [25]. In fact, there are few studies on the preparation and characterization of ACs derived from activation of cotton stalks (CS) with KOH [26]. Accordingly,the present study reports on the HNO3-oxidation of pretreated KOH ACs. Recently, there is a growing interest in the production of ACs from agricultural wastes because of them are renewable and cheaper, high carbon content, low ash content and reasonable hardness. The cotton is the main crop in Egypt, and the planting area is approximately 3 million ha, and the estimated amounts of CS are more than 1.6 million tonnes are generated annually [27]. Therefore,indigenous-low-cost CS-ACs with plenty of surface oxygencontaining functional groups were prepared by KOH activation of semicarbonized CS as described in previous investigation [28]. In this paper, a mild concentration of acid was used with KOH-ACs, in order to improve the adsorption capacity of these carbons for removal of Pb (II) ions from aqueous solution by batch method. Overall, the surface treatment with less concentration of acid leads to an improvement in the adsorption capacity and this reduces the cost in wastewater treatment.
In brief, air-dried CS were crushed and sieved to be in particle size of 0.1 to 3 mm. A simple semi-carbonization process was conducted into the crushed CS as follows: the dried granules of CS were semi-carbonized at 200oC for 30 mins, then followed by raising the temperature up to 400oC and kept for another 30 min under its own atmosphere to produce char. The char was well mixed with water and KOH pellets in a pyrex dish with the weight ratio of KOH per char 1 : 1. The mixed char was dried in an air-oven at 120oC for 4 h to obtain the dried mixture consisting of char and KOH. This mixture was admitted into stainless steel reactor and heated at different heat treatment temperatures of 700, 750 and 800oC. At each activation temperature, the sample was kept for 30 min in a self-generated atmosphere.Then the obtained ACs were thoroughly washed with 1 N HCl solution, followed by hot water washing for several times until pH 6 and dried at 100oC overnight [28].
2.2. Preparation of oxidized carbons
The obtained KOH-AC was then treated with 1 N HNO3 solution (6.4 v/v %), followed by heating at 100oC for 1 h and drying at 200oC, consecutively. The treated carbon was cooled and then washed thoroughly with distilled water until all unreacted nitrates were eliminated. The washed sample was dried at 100oC overnight. Finally, four carbon samples
[Table 1.] Preparation Conditions of the Prepared Carbons in this Study

Preparation Conditions of the Prepared Carbons in this Study
[Table 2.] Textural Properties of the Obtained Activated Carbons

Textural Properties of the Obtained Activated Carbons
including untreated KOH-AC at 800oC and three oxidized carbons are described in Table 1. One untreated carbon of highest surface area and total pore volume was chosen for comparison with other treated carbons to explore the change in their adsorption capacity.
2.3. Characterization of the prepared carbons
The pore structures of selected carbons were investigated by N2 adsorption at 77 K using a Sorptometer of the Type NOVA ver. 2.1 (Quantachrome Instrument, USA). The specific BET surface area (SBET, m2/g) was calculated by BET equation, and the total pore volume was obtained by converting the nitrogen adsorption amount at a relative pressure of 0.95 (VP, cm3/g). The micropore volume (Vm 0.1,cm3/g) was deduced at P/Po =0.1[29] in order to calculate mesopore volume from Vmeso=VP -Vm 0.1 (Table 2). Also,the average pore diameter was evaluated using equation; RP= 4V
Qualitative analysis of the surface functional groups was detected by recording their Fourier transform infrared spectroscopy (FTIR) spectra (FTIR-6100 JASCO, Japan) in the range 4000-400 cm-1. In addition, slurry pH of the carbons was determined by soaking 0.1 g of the powdered derived ACs with 25 mL of distilled water, shaking with a magnetic stirrer for 1 h, then leaving for 24 h and finally filtered. The pH value of filtrate was measured with a pHmeter of HANNA Type.
2.4. Equilibrium adsorption of Pb (II) ions from aqueous solution
A stock solution was obtained by dissolving appropriate amount of lead nitrate in 1 L to get concentration of 1000 mg/L by using distilled water. For this purpose, initial concentrations of 16, 33, 50, 66, 83, and 100 mg/L were prepared. Batch mode adsorption studies were carried out by using the selected adsorbents in a 250 mL stopper conical flask containing 50 mL of test solution at a desired pH value,contact time and adsorbent dosage level at room temperature(30oC). A 50 mg of dried finely powdered carbon was then added into 50 mL of these concentrations and shaken for 2 h to reach adsorption equilibrium conditions. The contents in the flask were filtered and the concentrations of Pb (II) ions were determined using atomic absorption apparatus of the Type (Atomic absorption spectrometer, model 210; Varian,USA). The amount of adsorbed lead (II) ions was calculated from the mass balance expression given by:
where
3.1. Surface chemical characteristics of the prepared carbons
The adsorptive capacity of the ACs is influenced by their surface chemical structure. The functional groups suggested most often in AC are carboxylic, phenolic hydroxyl,carbonyl and lactone groups [30-32]. It is well-known that FTIR spectrum can describe the most functional groups on
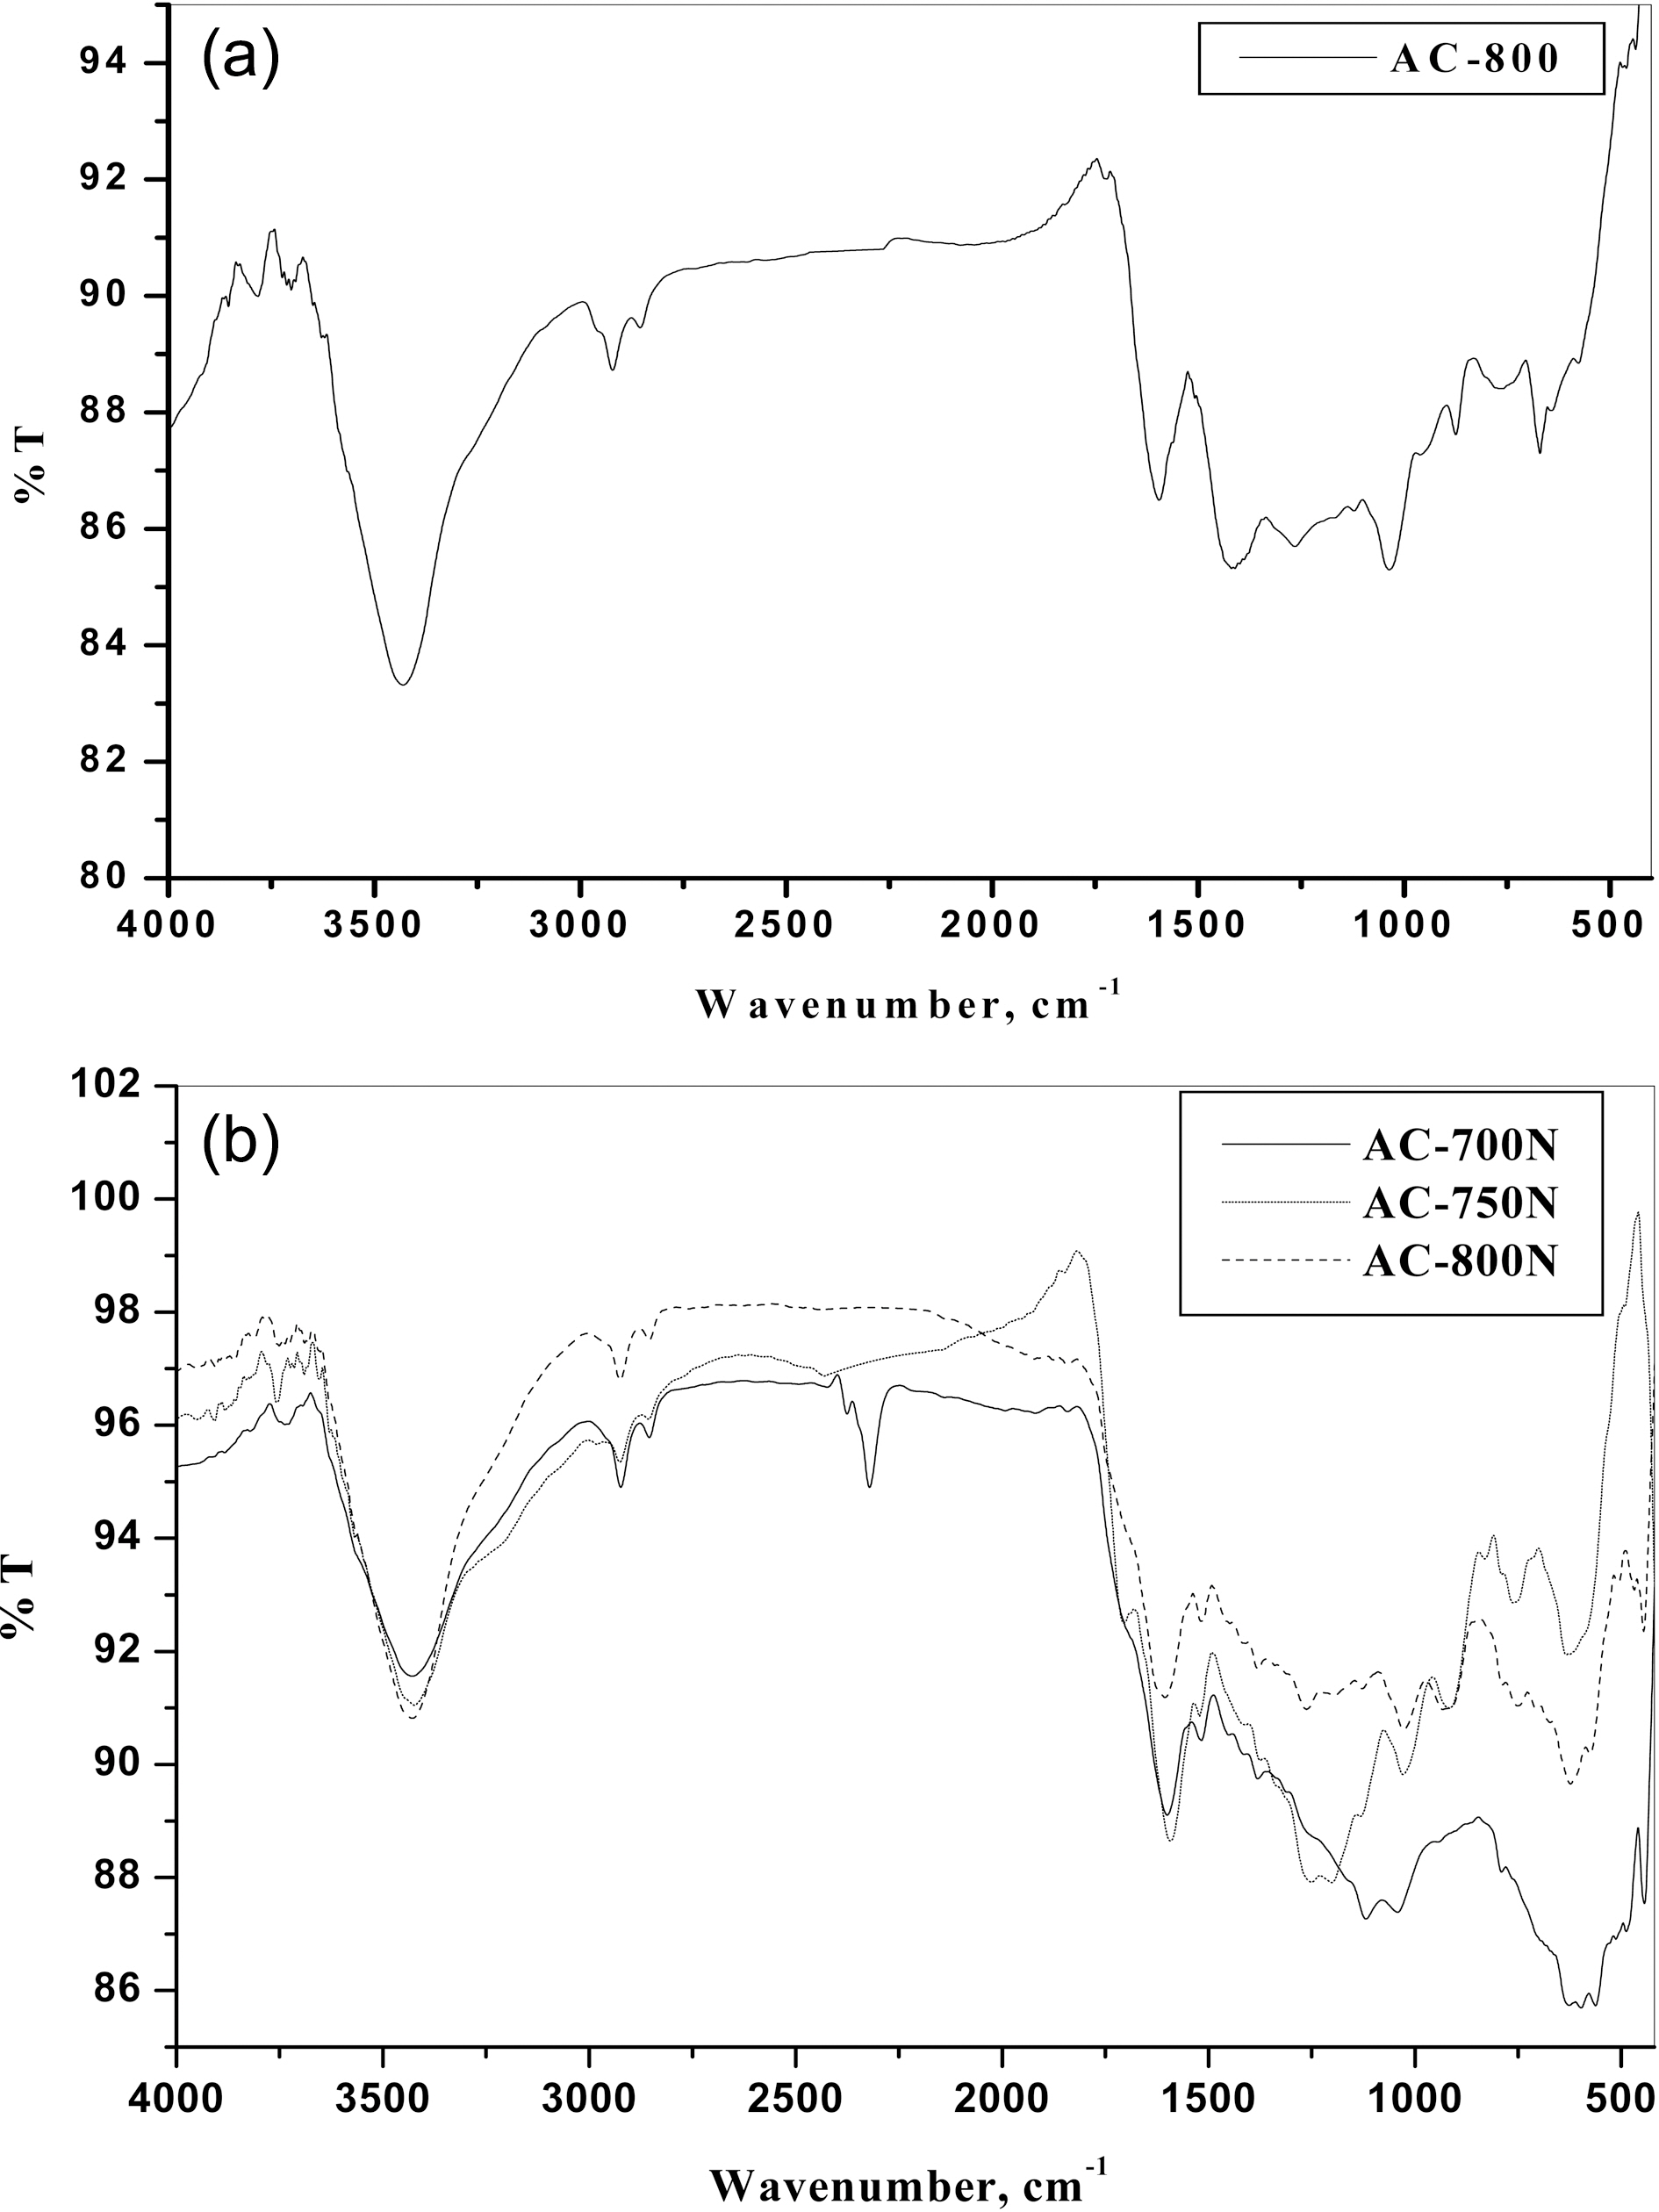
the porous carbon surface. Thus, the FTIR spectra of obtained ACs were performed and shown in Figs. 2(a) and (b) for untreated (AC-800) and treated carbons with HNO3(AC-700N, AC-750N and AC-800N), respectively. It can be seen that the general absorption bands in their FTIR spectra as follows:
1) Absorption in the 3600-3780 cm-1 range, has been assigned to stretching of free O-H groups on the surface. In addition, hydrogen bonded OH groups can be assigned to broad peak in the 3350-3430 cm-1 range and a broad peak around 3300-3400 cm-1 is likely due to adsorbed water.
2) A small intense peak in the range 3000-2800 cm-1 region is due to C-H stretching modes. The band at 2925 and its shoulder at 2855 cm-1 were ascribed to C-H symmetric and asymmetric stretching of residual methylene groups on the surface.
3) It is observed on the FTIR spectrum of untreated AC-800 that the peak at 1625 cm-1 is increased in the intensity and shifted to the lower wavenumber at 1600 cm-1 for treated carbons with HNO3 (AC-800N). This peak has been attributed to C=O stretching in carboxylic and lactone [31].The peaks at 1620-1520 cm-1 region were ascribed to the skeletal C=C stretching in aromatic rings. It has been reported that the peaks centered at 1800-1600 cm-1 range were attributed to the presence of oxygen structures and NO-containing structures [31].
4) A band at 1380-1370 cm-1 was ascribed to the formation of carboxyl-carbonate or carboxylic salt or metal carbonate as well as to the vibration of C-O in carboxylate groups.Also, the appearance of bands between 1300 and 900 cm-1 could be assigned to C-O stretching vibrations in acids,alcohols, phenols, ethers and esters [30-32]. Shoulder absorption bands occurred between 776 and 590 cm-1 are ascribed to C-H and O-H bending in aromatics, respectively[30,31]. In brief, it can be deduced from the FTIR spectra,that most of the acid sites were developed as a result in the formation of phenolic, carboxylic and carbonyl groups as well as of nitrous groups. Therefore, the treated carbon adsorbents have higher contents of surface functional groups than that of untreated ones. Also, the presence of acidic groups can be evident by the decrease in slurry pH values of the present carbons as shown in Table 1.
3.2. Effect of acid treatment on porosity in modified carbons
Table 2 gives the porous textures of the modified carbons and untreated carbon for comparison. In most of the previous studies on nitric acid treatment of AC, the total surface area, total pore volume and micropore volume are decreased apparently with widening in pore diameter[32,33]. This finding may be attributed to the formation of new oxygen groups at the entrance and on the walls of micropores. Formation of this oxygen groups leads to constrictions and blocking of the micropores; thus, it reduces micropore volume and total surface area. Similar observation was shown in this study, that the total specific surface, SBET(m2/g) and micropore volume, Vm 0.1 (cm3/g) are decreased considerably by 28.6 and 40.0%, respectively, for the treated carbon as compared to untreated carbon at 800oC (AC-800 and AC-800N). On the other hand, the oxidation with HNO3 enhances the average pore diameter from 17.8 to 19 A in micropore range, whilst the total pore volume reduces from 0.423 to 0.322 cm3/g. Thus, it can be observed that severe oxidation at extreme conditions practically destroys the porous structure of the original ACs due to the erosion of the pore walls. Accordingly, the HNO3 oxidation is not only changed the chemical properties of the untreated carbon surface but also its pore texture.
3.3. Removal of Pb (II) ions from aqueous solution
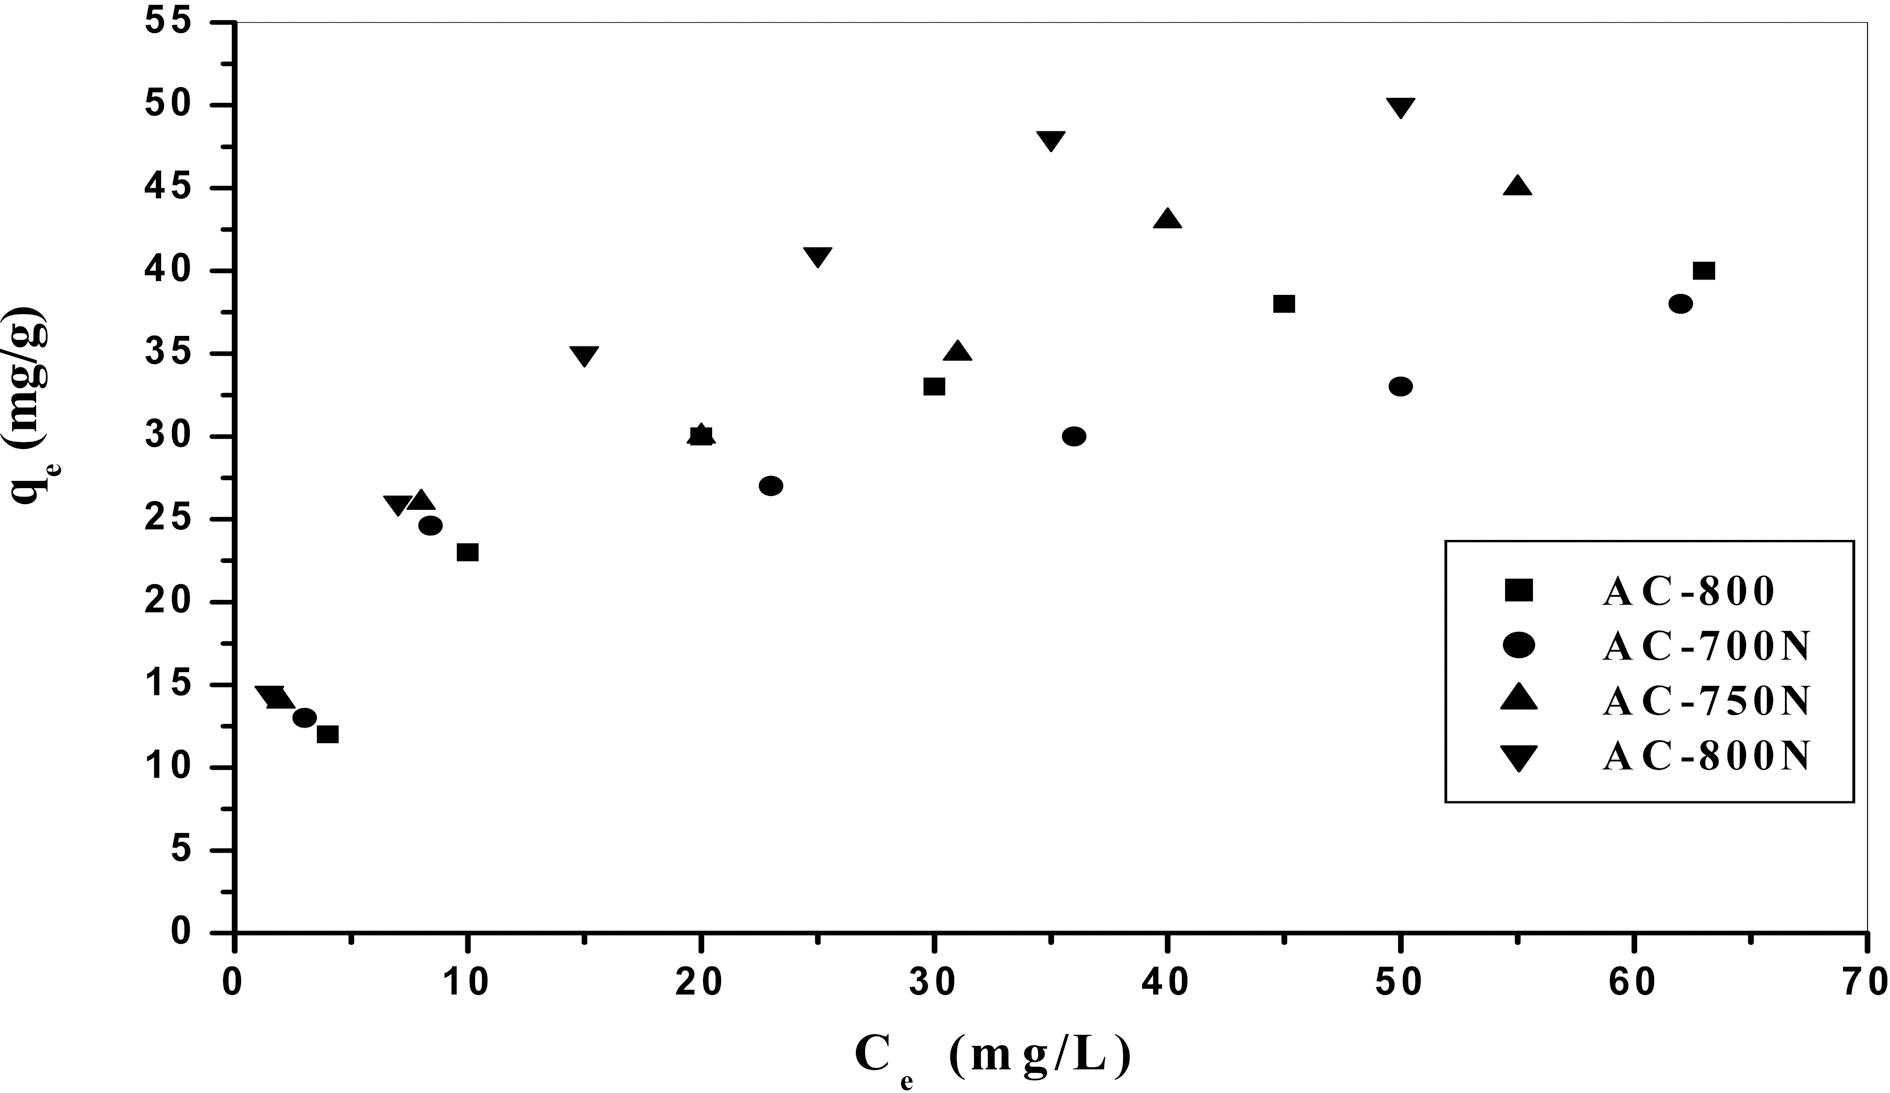
In order to evaluate the removal capacity of Pb (II) ions on the obtained carbons, the adsorption isotherm was applied.Practically, the adsorption isotherm indicates how the adsorbate molecules distribute between the liquid phase and the solid phase when the adsorption process reaches an equilibrium state. Lead (II) ions adsorption isotherms of treated and untreated carbons are presented as a function of
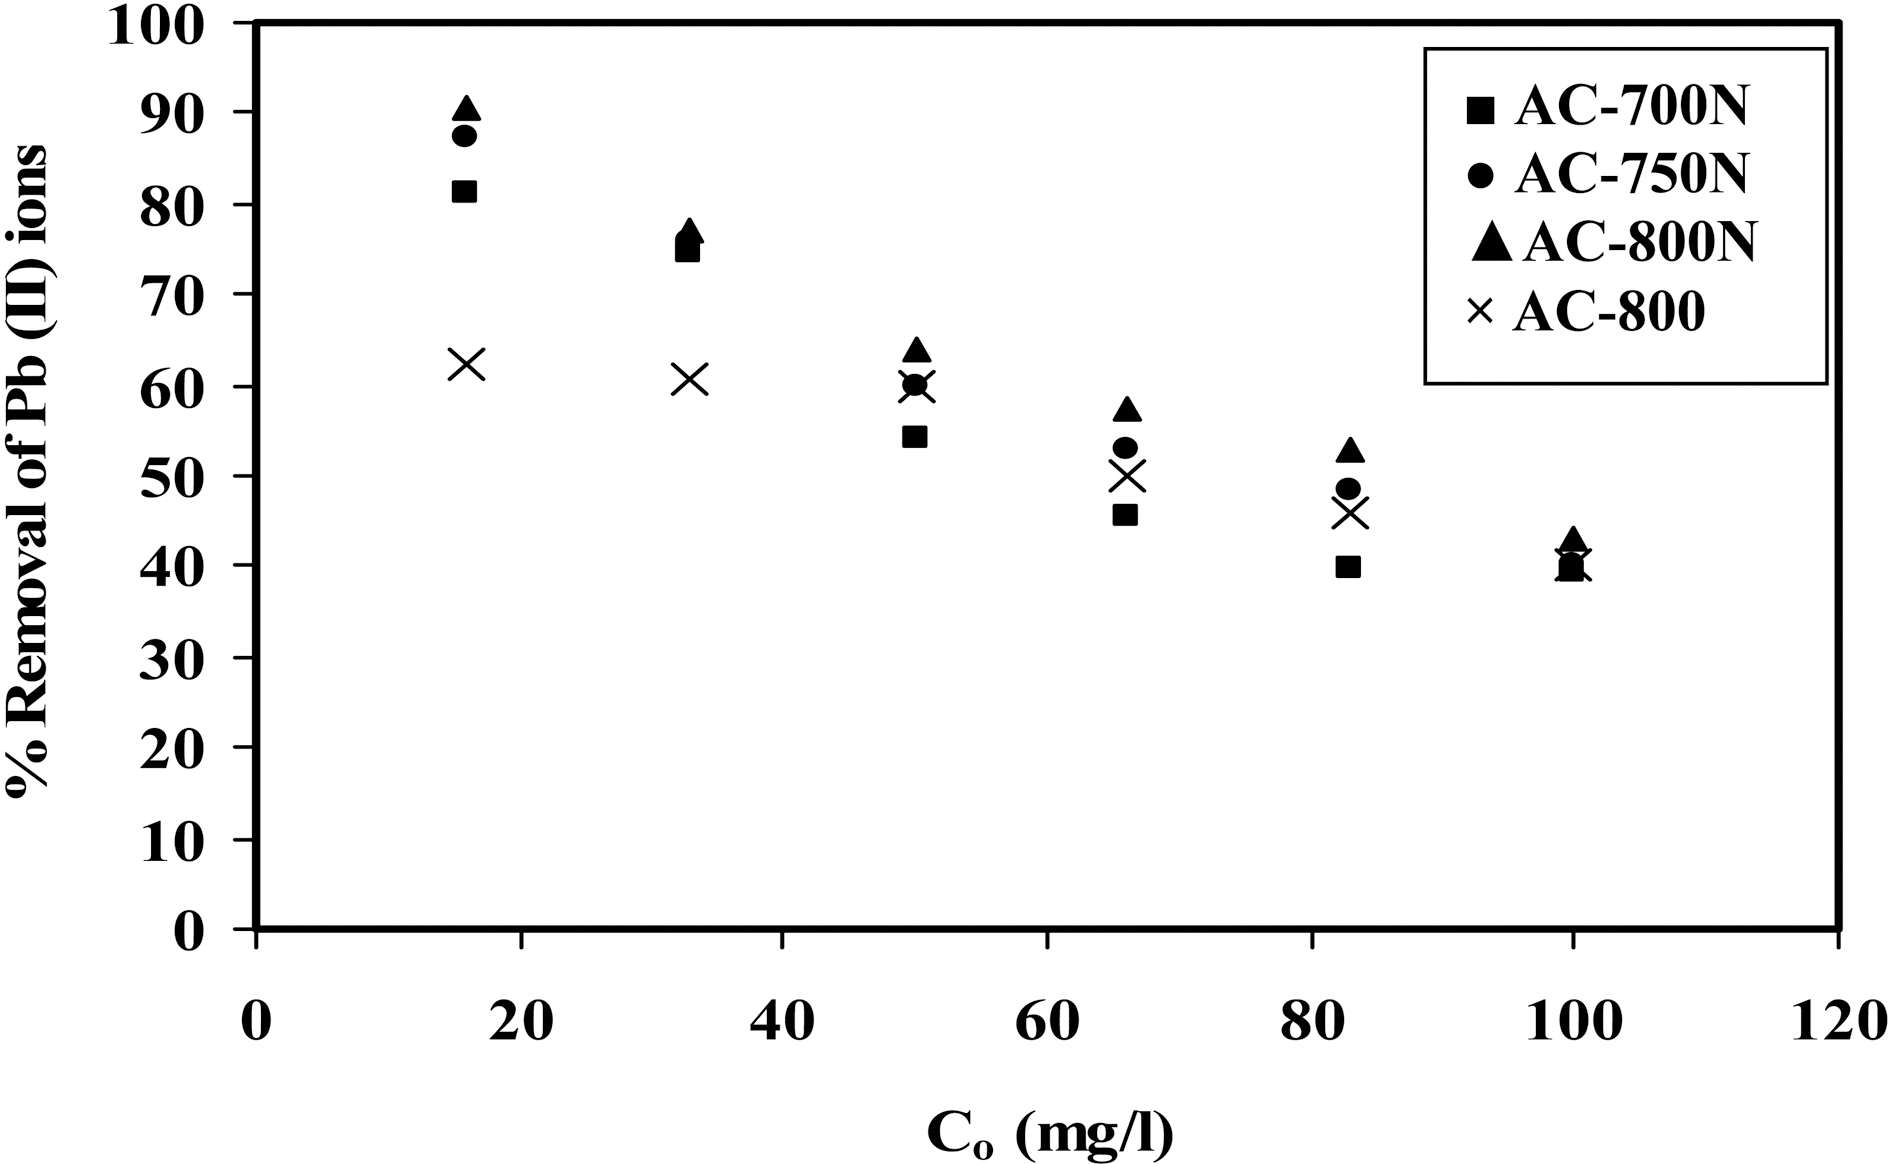
the equilibrium concentration of metal ions in the aqueous medium as in Fig. 3. The amount of metal ions adsorbed per unit mass of adsorbent (i.e. adsorption capacity) increased with the initial concentration of metal ions as expected [34].Adsorption isotherms shown in Fig. 3 might be included the type H (3) of Giles classification [35], which indicates that solute ions has much high affinity towards adsorbent surface.On the other hand, adsorption percentage decreases with increasing in initial concentration of Pb (II) in the solution(16-100 mg/L) [36] as shown in Fig. 4. At a low level of Co=20 mg/L of Pb (II) ions, AC-800N removes most of the metal ions (~90%), whilst the untreated sample removes almost 62% of Pb (II) ions. Upon raising the initial concentration, the removal capacity of all carbons decreases to reach almost 38% at Co =100 ppm of lead ions. This can be interpreted by the decrease in density of adsorption sites to total Pb (II) species with increasing in initial concentration.This observation confirms that adsorption of Pb (II) ions is significantly concentration dependent. It can also conclude that the presence of generated C-O groups on the carbon surface (i.e., carboxylic and phenolic groups) intensifies the metal uptake capacity.
The distribution of metal ions between the liquid and solid
phase can be described by the Langmuir and Freundlich isotherm models. These models are frequently used since they are classical, simple and have an ability to describe the experimental results in wide range of concentrations as well as the equilibrium metal ions adsorbed onto adsorbent and metal ions in solution.
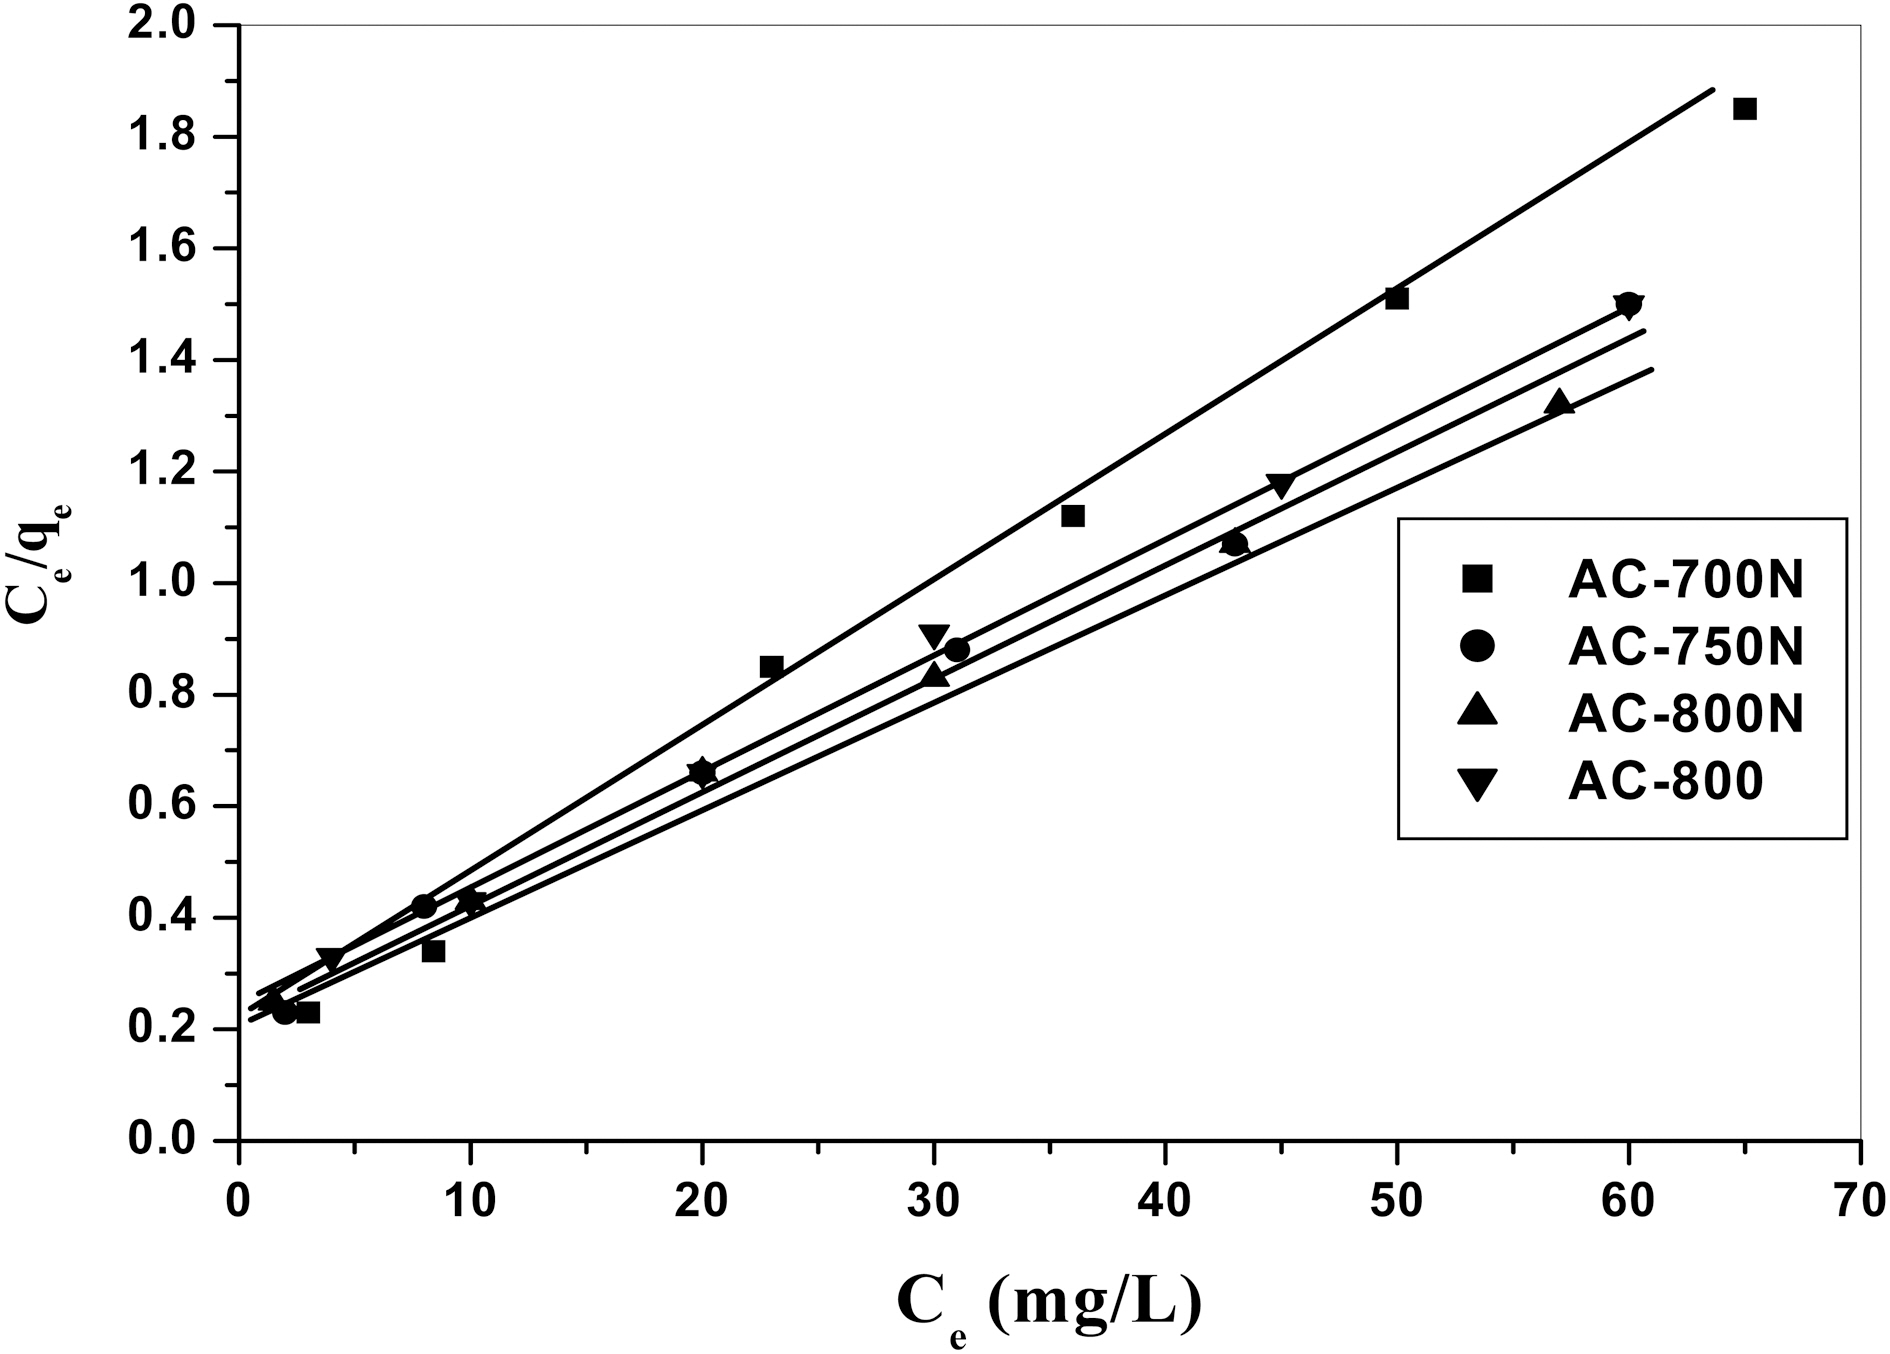
Langmuir isotherm model suggests that uptake occurs on homogeneous surface by monolayer sorption without interaction between adsorbent molecules. The model assumes uniform energies of adsorption onto the surface and no transmigration of adsorbate in the plane of the surface.The linear form of Langmuir isotherm equation is represented by the following equation:
where
[Table 3.] Langmuir and Freundlich Parameters for Pb (II) Ions Adsorption on the Prepared Carbons

Langmuir and Freundlich Parameters for Pb (II) Ions Adsorption on the Prepared Carbons
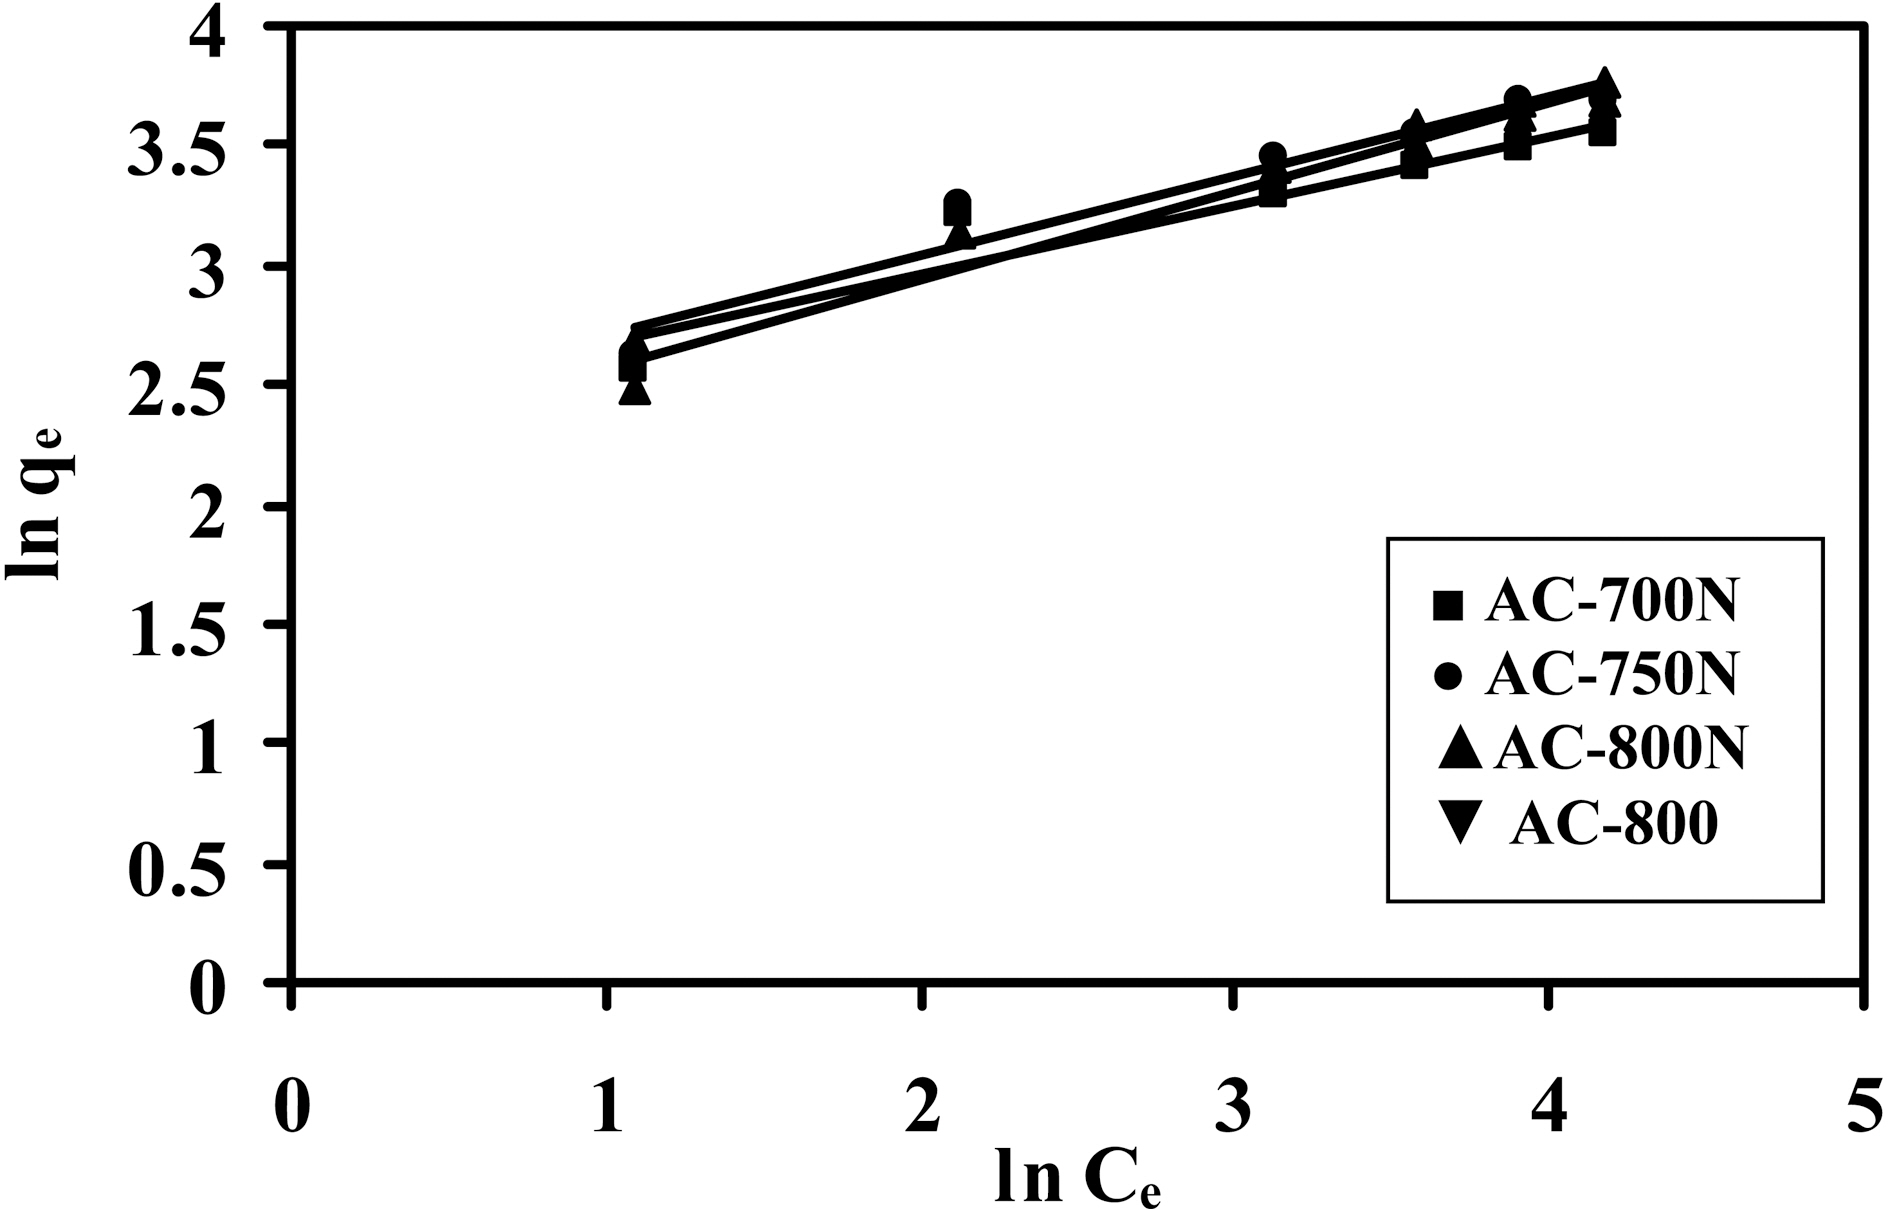
AC-800, which should be due to the higher contents of carboxyl, lactonic and phenolic groups on the former carbon than AC-800, although AC-800N sample exhibited low surface area and micropore volume. The adsorption capacities were found to follow the sequence; AC-800N>AC-750N>AC-700N>AC-800.
The essential features of Langmuir adsorption isotherm can be expressed in terms of a dimensionless constant called separation factor or equilibrium parameter (RL), which is defined by the following relationship:
where
The Freundlich isotherm is the earliest known relationship describing the sorption equation. This fairly satisfactory empirical isotherm can be used for non-ideal sorption that involves heterogeneous surface energy systems and is expressed by the following equation:
where
The fit to the linear form of the two models was examined by calculation of the linearity coefficients (R
The amounts uptaken of the metal (in mg/g) were converted to corresponding area occupied by the adsorbed metal ions. Under the experimental conditions, the Pb (II)ions should be hydrated, having a hydration number between 4 and 7.5, the diameter of Pb2+aq might be equal to 0.802 nm, which means that ultramicropores should be inaccessible to Pb (II) ions [38]. According to some authors[2,39], carbon surface areas occupied by Pb (II) as Sad Pb (II)were evaluated by using a factor of 1.467 and consequently the percentage of this to the surface area by the BET-method, was determined (% SPb 2+/SBET) in same table. Upon evaluating the surface occupied by the adsorbed lead ions(36.6-73.4 m2/g), it appears to cover a low fraction of the extensive surface area of present carbons (SPb 2+/SBET = 3.86-17.3%). It shows that about ~ of surface area is involved in the removal of the strongly hydrated ions. This means that most of the narrow microporosity is inaccessible to the Pb species. Nevertheless, the presently developed carbons are better in this respect than previously reported untreated carbons [35-37]. It can induce from these results that the suggested mechanism for Pb (II) adsorption by the hereby carbon adsorbents could be explained on the bases of pore diffusion and surface chemical nature of adsorbent.
In the present study, KOH ACs, derived from local CS,were oxidized by HNO3 solution. The obtained modified carbons were tested for the removal of lead (II) ions from aqueous non-buffered solutions. The results of adsorption capacity show that the treated carbons exhibit high uptake of Pb (II) ions from 37.7 to 50 mg/g as compared to 25 mg Pb(II)/g AC-800. It was found that adsorption of lead ions was governed by three factors; porosity characters, acidic oxygen functional groups and active surface sites (potassium containing compounds). The treated carbons with nitric acid brought a considerable loss in the specific surface area and total pore volume resulting in formation of oxygen surface groups as widening in ultra- and super-micropores. Finally,the order of increase removal of Pb (II) ions were seemed to be AC-800N>AC-750N>AC-700N>AC-800. Overall, the oxidized carbons proved to be highly recommendable for the efficient adsorption of the HM ions from the contaminated effluents such as wastewater.
