Titanium dioxide (TiO2) has been widely investigated for as a photocatalyst due to its electronic and optical properties, nontoxicity, long-term stability, and low cost [1]. The phases of TiO2 are anatase, rutile, and brookite. Their functional characteristics highly depend on their phases. TiO2 is well known to have photocatalytic activity under ultraviolet (UV) light (band gap of 3.0-3.3 eV). However, it is desirable to develop a photocatalyst that efficiently absorbs visible light [2], which occupies the main part of the solar spectrum.
Various attempts, such as sol-gel method [3], thin film method[4], microwave hydrothermal method [5], have been made to develop those catalysts. Dopings of various transition metal ions or rare earth ions in TiO2 have been intensively investigated for photocatalytic decomposition of organic compounds. It has been recently announced that the visible light active photocatalysts of TiO2 can be obtained from substitution of Ti by transition metals, such as Cr, Ni or Fe [6-8], or even by doping with nonmetal atoms [9-13], such as nitrogen. Few of these studies investigated the mixed valence state [14] of Ti and its effects on the electrical [15] and photocatalytic properties. Thus, in this paper, those properties of each sample, such as crystal symmetry,unit cell volume change, mixed valence states of Ti, variations of oxygen amounts with temperature change, electrical resistivities,and photocatalytic degradation profiles, were examined after synthesizing the anatase type solid solutions (x = 0.01, 0.02, 0.03 and 0.04) of Ti1-xWxO2-y in air at 1,073 K (800℃).
Four different samples of the Ti1-xWxO2-y system with the compositions of x = 0.01(TW-1), x = 0.02(TW-2), x = 0.03(TW-3) and x = 0.04(TW-4) were synthesized from analytical reagents,TiO2 (anatase, 99.9%) and WO3 (99.99%) using standard ceramic techniques in air, after stoichiometric calculation. The starting materials were dried at 673 K for 2 hours to eliminate the water content before weighing. All materials were mixed and ground into fine powders for 2 hours using automatic mortar equipment (03-083-03, Samhwa, Seoul, Korea) to synthesize homogeneous solid solutions [16]. Then, they were stirred and dispersed in polyethylene beakers containing distilled water (200 mL), ethyl alcohol (10 mL), and ceramic beads (Cenobeads, CZC-1.2 mm,Cenotec Co., Changwon, Korea) for 72 hours to get the powders as fine as possible. Each mixture was reacted at 1,073 K in air for 24 hours and then slowly cooled with reactor after leaching and drying. The weighing, grinding, and heating processes were repeated three times under the same conditions to obtain homogeneous solid solutions. The pellets and the residual powder samples with respective compositions were sintered at 1,073 K in
air for 24 hours and cooled with the furnace, after pressing each powder sample into pellets with 10 mm diameter and 1~2 mm thickness under a pressure of 800 kg/cm2.
Each powder sample was analyzed by X-ray powder diffraction (PW1710 [Philips, Almelo, Netherlands], 2θ range: 20°~70°) to assure the homogeneous phase of the solid solution and to determine the related parameters. The observed d values were compared to the theoretical d values calculated from the leastsquare method [17]. Crystal systems, lattice parameters, and lattice volumes of the unit cells were determined, after miller indices of each line were reasonably confirmed (JCPDS data, #21-1272).
The mixed valences of titanium and oxygen nonstoichiometries of calcined powder specimens (Ti3+(1-x)tTi4+(1-x)(1-t)W6+xO2-y (y = -x+(1-x)t/2), x = 0.01(TW-1), 0.02(TW-2), 0.03(TW-3) and 0.04(TW-4)) at room temperature were determined by oxidationreduction titration (Ti3+→ Ti4+ + e-) using 0.01N-KMnO4 solution in micro-burette. The mole ratio (t values) of Ti3+ ion to total Ti ion (t value) was calculated using the following formula.
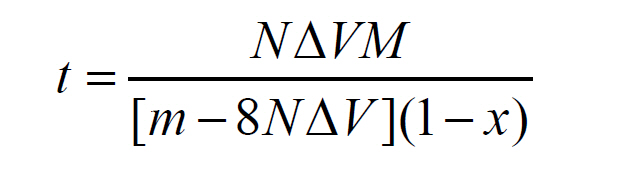
where, N: normality of KMnO4 solution, ΔV: volume difference between blank test and sample test, M: formula weight of each sample excluding x × t/2 from oxygen 2-y value, and m: sample weight). The results allowed determinations of the nonstoichiometric formulas of the specimens combined with electroneutrality and mass balance conditions.
The electrical resistivities of the pellet-type samples were measured using 236 SMU instrument (Keithley Co., Cleveland, OH,USA). Maintaining constant current, voltages were measured at room temperature (24℃) under atmospheric air pressure
[Table 1.] X-ray powder diffraction data of the Ti1-xWxO2-y system.
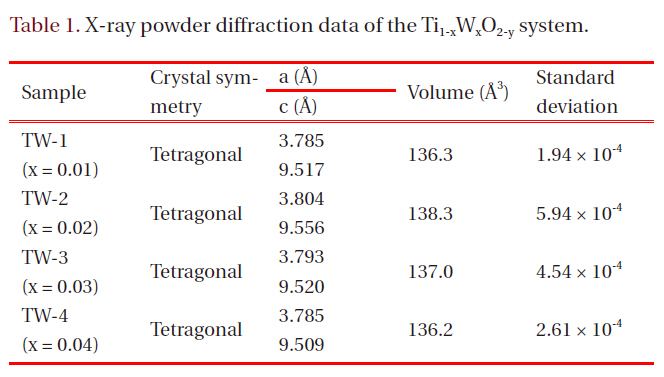
X-ray powder diffraction data of the Ti1-xWxO2-y system.
(relative humidity ≥60%). A special 4-probe apparatus (probe distance: 1.6 mm) fabricated with quartz and platinum wire was used in this resistivity measurement. Four sharp platinum wires were contacted on the shallow holes on the pellet surface. Two springs made of platinum wire were also used to prevent the contacts from working loose. Resistivity data were processed applying Valde's method [16,18].
TG/DTA experiments were conducted by referring to some studies [16, 19] on perovskites. The instrument model was TG/DTA 220 (Seiko Instruments Inc., Chiba, Japan) and reference material Pt wire (15.520 mg) in the TG/DTA study. The study temperature was raised at 40℃/min in the range of 50-400℃ in this TG/DTA. The weight change data were converted into percentage values for reasonable comparison.
Absorbance spectra were recorded for the samples anatasetype TiO2 (TiO2-A), TW-1 and TW-2 with UV-vis spectrophotometer (Scinco S-3100, LabPlo plus) with a water-jacketed 8-position multi-cell holder for their absorbance in the range of 200-600 nm. Each 4 mL of the emulsion was taken, excluding precipitated solid materials, after vigorous shaking of solutions with each 1 g sample in 40 mL water, leaving them for 4 hours.
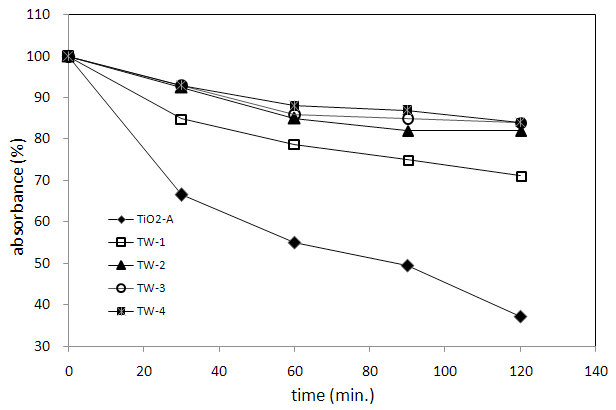
Methylene blue (MB) was chosen as the probe material to test the activity [2,20] of the five catalysts (TiO2-A, TW-1, TW-2, TW-3, and TW-4). The experiment was carried out simultaneously for the catalysts in a quartz-glass reactor (4 mL) in sunlight for 120 minutes, between 12:00 noon and 02:00 pm. The MB aqueous solution (10-4 M) with each emulsified catalyst in a quartz-glass cylinder was exposed to sunlight during the experiment. Absorbance was recorded every 30 minutes at 665 nm wavelength against appropriate blanks.
The prepared specimens of each composition can be written as follows; TW-1: Ti3+0.99tTi4+0.99(1-t)W6+0.01O2-y (x = 0.01), TW-2:Ti3+0.98tTi4+0.98(1-t)W6+0.02O2-y (x = 0.02), TW-3: Ti3+0.97tTi4+0.97(1-t)W6+0.03O2-y (x = 0.03), and TW-4: Ti3+0.96tTi4+0.96(1-t)W6+0.04O2-y (x = 0.04). Colors of the synthesized specimens gradually changed from white to very weak yellow, denoting some absorption in the visible region [2].
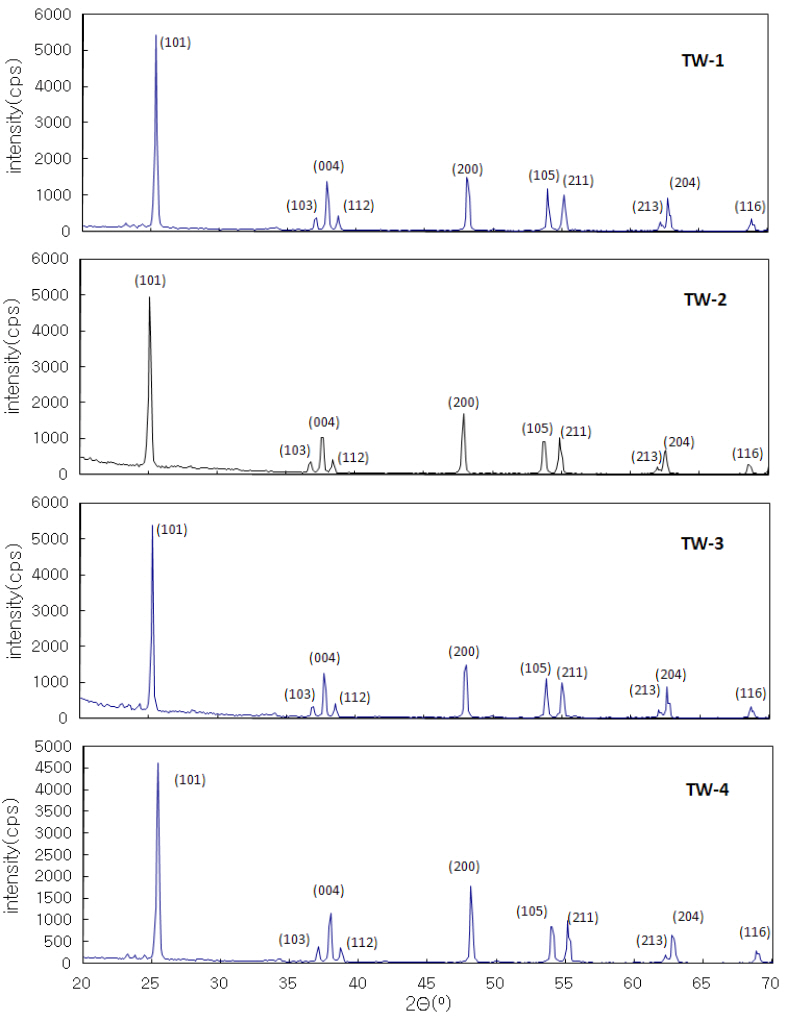
Figure 1 shows the X-ray diffractograms (XRD) with compositional changes from x = 0.01 to 0.04, which approximated to the tetragonal structure. Not all the XRD patterns exhibited peak splitting or broadening beyond the instrumental resolution. The indexations of the synthesized samples were performed by referring to the JCPDS data (21-1272, space group: I41) of TiO2-anatase system.
Other patterns of TiO2, such as rutile (JCPDS: 21-1276), were not observed. It was concluded that the materials with compositional range x = 0.01-0.04 were monophasic compounds with tetragonal symmetry. Table 1 presents related parameters.
When x = 0.1 and 0.2 (not presented in this paper) unreacted

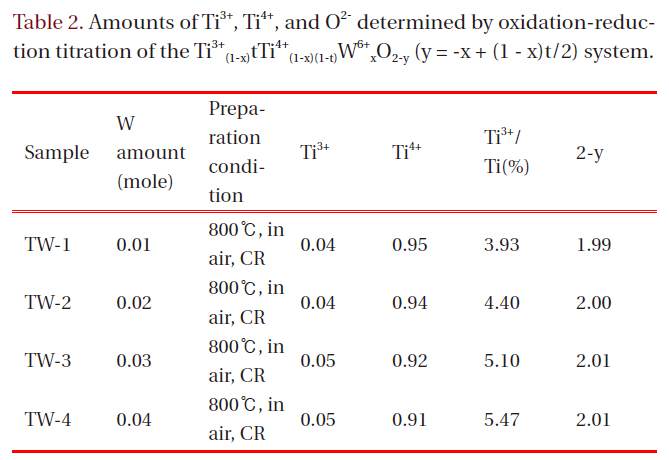
Amounts of Ti3+ Ti4+ and O2- determined by oxidation-reduction titration of the Ti3+(1-x)tTi4+(1-x)(1-t)W6+xO2-y (y = -x + (1 - x)t/2) system.
tungsten oxide peaks appeared, depending on their composition.It was expected little difference would exist in lattice volume,when we consider the similar ionic radius of Ti4+ (0.745 nm)and W6+ (0.740 nm). The results of the oxidation-reduction titration performed later showed that the amounts of Ti3+ (0.810 nm)and O2- ions did not vary markedly. As shown in Table 1, the unit cell volumes did not distinctly change.
It was possible to measure the amounts of Ti3+ and Ti4+ ions in each sample and finally to determine the nonstoichiometric chemical formulas, applying the oxidation-reduction titration method using 0.01N-KMnO4 solution and assuming that W ion would maintain its oxidation state of 6+. Table 2 lists the nonstoichiometric data of the products from the chemical analysis,where y refers to oxygen deficiency.
It was expected that the partial substitution of W would cause both the formation of Ti3+ and excessive oxygen (negative y value),considering the electroneutrality condition.
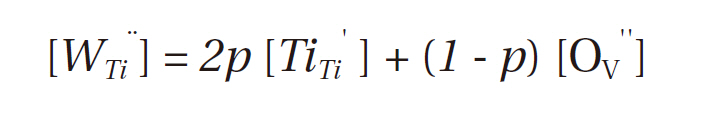
where, Ti and TiTi' denote Ti ion sites and Ti3+ at Ti ion site, respectively.It turned out that the partial substitution of the higher valenced W ions resulted mainly in the formation of Ti3+ ion, not in oxygen excess, in this system. That is, increasing the amount of W ion, the ratio of Ti3+(Ti3+/Ti(%)) increases steadily, but 2-y retains almost the same values.
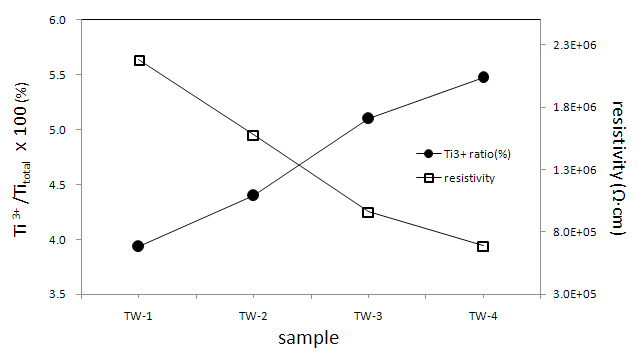
A relationship exists between Ti3+/Ti(%) ratio and resistivity (Fig. 2); increasing the amount of W, the resistivity values decrease. This kind of tendency was also observed later in the catalytic activity experiment using methylene blue. The resistivity data were obtained from each pellet-type specimen (dia. = 10 mm, probe distance: 1.6 mm) at room temperature (297 K) with relative humidity ≥60%. These values were highly sensitive to hu
midity. That is, supply of heat from an electrical dryer instantly made the resistivities of all the pellet samples infinite; they needed considerable time to regain their resistivity values. These results posit that all the emulsified powder samples in water will have considerable conductivities and that will affect the photocatalytic activity of this W-doped TiO2 system.
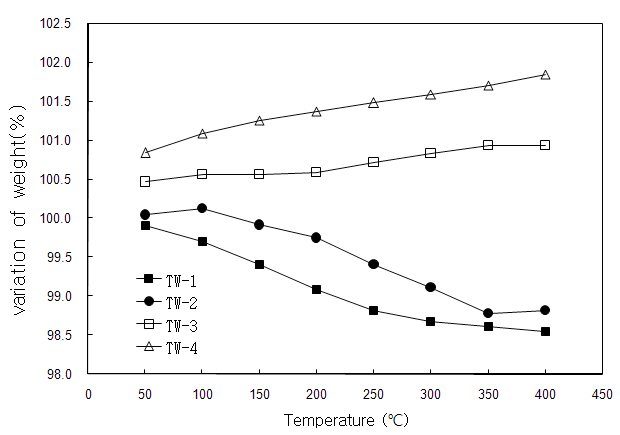
Thermogravimetry (TG) experiments were performed with increasing temperature from 323 K (50℃) to 673 K (400℃) to check the changes of oxygen content with temperature change. The conversions of TG raw data into weight percentages (Fig. 3) and in the nonstoichiometric expressions (2-y values) based on the data from the oxidation-reduction titration method (Table 2), assuming that the weight changes were caused only by oxygen content with temperature change. TW-1 and TW-2 exhibited gradual decrease of weight with increasing temperature; 2-y values of TW-1 changed from 1.989 (99.91%, 323 K) to 1.962 (98.55%,673 K) and the amount of Ti3+ was nearly zero over the entire temperature range.
TW-2 showed a similar tendency (2-y = 1.999 [100%, 323 K] and 1.974 [98.82%, 673 K]) to TW-1. TW-3 and TW-4 showed a slight increase in weight. 2-y values of TW-3 changed from 2.014 (100.47%, 323 K) to 2.024 (100.93%, 673 K). Mole ratios of Ti3+ (0.11) and Ti4+ (0.86) at 400℃ could be calculated from these values. Nonstoichiometric values of TW-4 are as follows; 2-y = 2.031(100.84%, 323 K) to 2.051 (101.84%, 673 K), Ti3+ (0.18, 673 K) and Ti4+ (0.78, 673 K).
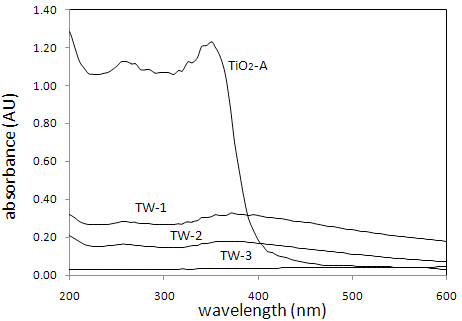
UV-vis absorption spectra of the catalysts, TiO2-A, TW-1, TW-2,and TW-3 are shown in Fig. 4.
While TiO2-A has the strongest absorption below 400 nm, the
absorbances of TW-1 and TW-2 are much smaller than those of TiO2-A. The sample TW-3 and TW-4 (not shown in Fig. 4) exhibited almost zero absorbance in the entire wavelength range. However, it can be seen from Fig. 4 that TW-1 and TW-2 have significant absorbance above 400 nm in the visible region compared to undoped TiO2-A. Figure 5 shows the MB degradation with five different catalysts. It is noticeable that the photocatalytic activity of W-doped TiO2 is considerably reduced with composition change. TW-2, TW-3, and TW-4 have almost no photocatalytic activities.
In this study, the control of particle size was difficult, because all the samples were prepared by traditional solid reaction (not by sol-gel method). It is worthwhile to point out here that even though only a small portion of prepared samples can be emulsified in water, possible uses as a photocatalyst may exist. This study concluded that the increase in the amount of W causes an increase of the portion of Ti3+, decrease of resistivities (increases of conductivities) and ultimately degradations of photocatalytic activities.
Ti1-xWxO2-y solid solutions with compositions of x = 0.01(TW-1, Ti3+0.04Ti4+0.95W6+0.01O1.99), x = 0.02(TW-2, Ti3+0.04Ti4+0.94W6+0.02O2.00), x = 0.03(TW-3, Ti3+0.05Ti4+0.92W6+0.03O2.01) and x = 0.04(TW-4, Ti3+0.05Ti4+0.91W6+0.04O2.01) were synthesized at 1073K in air under atmospheric pressure. XRD study showed that all the solutions had tetragonal symmetries and the unit cell volumes did not distinctly change. The resistivity values decreased with the increase of x value (amount of W). TG analysis showed that while, with increasing temperature, TW-1 and TW-2 exhibited a gradual decrease in weight, TW-3 and TW-4 showed a slight increase in weight. While TiO2-A had the strongest absorption below 400 nm, the absorbances of TW-1 and TW-2 were much smaller than those of TiO2-A. The photocatalytic activities of W-doped TiO2 varied considerably with composition. TW-2, TW-3, and TW-4 had almost no photocatalytic activity.