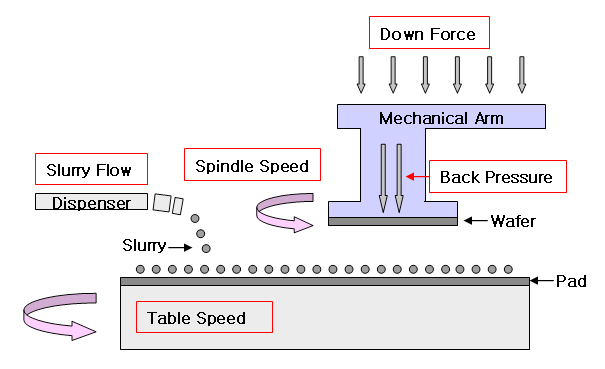
The characterization of the chemical mechanical polishing (CMP) process for undensified phophosilicate glass (PSG) film is reported using design of experiments (DOE). DOE has been used by experimenters to understand the relationship between the input variables and responses of interest in a simple and efficient way, and it typically is beneficial for determining the appropriatesize of experiments with multiple process variables and making statistical inferences for the responses of interest. The equipment controllable parameters used to operate the machine consist of the down force of the wafer carrier, pressure on the back side wafer, table and spindle speeds (SS), slurry flow(SF) rate, pad condition, etc. None of these are independent ofeach other and, thus, the interaction between the parameters also needs to be understoodfor improved process characterization in CMP. In this study, we selected the five controllable equipment parameters the most recommendedby process engineers, viz. the down force (DF), back pressure (BP), table speed (TS), SS, and SF, for the characterization of the CMP process with respect to the material removal rate and film uniformity in percentage terms. The polished material is undensified PSG which is widely used for the plananization of multi-layered metal interconnects. By statistical modeling and the analysis of the metrology data acquired from a series of 25-1 fractional factorial designs with two center points, we showed that the DF, BP and TS have the greatest effect on both the removal rate and film uniformity, as expected. It is revealed that the film uniformity of the polished PSG film contains two and three-way interactions. Therefore, one can easily infer that process control based on a better understanding of the process is the key to success in current semiconductor manufacturing, in which the size of the wafer is approaching 300 mm and is scheduled to continuously increase up to 450 mm in or slightly after 2012.
With the continuous scaling down of device technology and complicated integration of multi-layered integrated circuits (ICs), planarization at each level of the inter-layer dielectric has become more significant in current system IC manufacturing.The level of complexity for system IC integration, such as microprocessors and digital signal processors, in general, is more complex than that of memory devices. In the era of mid-size integration, which may contain less than a hundred thousand devices, planarization was not a required process step in IC fabrication. However, the need for aplanar surface for improving the depth of focus and photo-patterning resolution in multi-level IC integration requires each level of the surface to be planar, and this planarization has become a critical step in terms of process integration [1].
For the planarization of the wafer surface, numerous methods has been developed, such as doped glass reflow, hydrophobicity,spin etch planarization, spin on deposition, reactive ion etch etch-back, spin on deposition etch back, and chemical mechanical polishing (CMP) [2]. CMP is a widely used planarization method for global planarization in the semiconductor industry, because it provides compatability with various materials ranging from dielectrics to metals. It is also useful for the planarization of multi-material surfaces and reduction of the severe topography.
Although CMP, compared to other suggested planarization methods, provides increased throughput in manufacturing, the
[Table 1.] Factors and their ranges in the experiment.
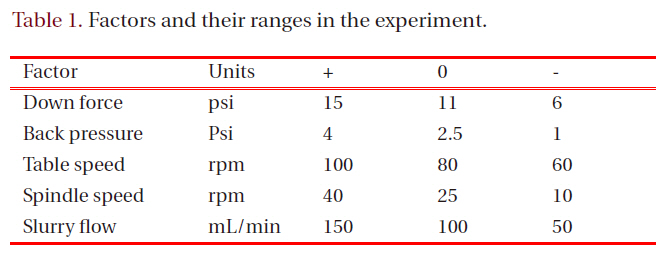
Factors and their ranges in the experiment.
control of the process becomes more complicated with increasing device integration density and the introduction of newer materials, which significantly narrows the process latitude with the development of device fabrication technology. The need to control the process parameters to achieve certain levels of process yield cannot be over-emphasized. There are a large number of tool or process parameters, but they can be grouped into the following three classes: 1) tool operating related, such as the pressure, velocity, and temperature; 2) slurry related, such as abrasive, slurry and fluid; and 3) pad related.
The separate consideration of each group of parameters for the analysis of the process may not justifiable since it is not independent with respect to the results or outputs of interest, but the correlation and interaction with each other to some degree. In this paper, we employed the statistical design of experiments (DOE) to investigate the statistical inference of the individual parameters and their interactions for the figure of merit of the CMP process, removal rate and uniformity. Employing a fractional factorial design with five process parameters, a series of CMP experiments was followed by the DOE, and the measured wafer metrology was statistically modeled and analyzed to draw objective conclusions.
The data employed for the statistical analysis were acquired from a set of CMPs processes of phosphosilicate glass (PSG) that are frequently used in the back end of line process in system IC integration. PSG not only provides a lower dielectric contact over silicon oxide, but also reduces the depth of the steps created by metallization.
The thickness of the PSG thin film, as deposited on prime grade
DOE is a statistically driven experimental design method which provides the systematical determination of experiment and enables statistical analysis to be conducted via analysis of variance (ANOVA) and regression modeling. It also allows the main effects of the parameters employed and interactions be-
tween the parameters to be visualized for the given responses of interest, herein the removal rate and calculated percent uniformity.
The benefit of DOE also extends to the maximization of the data analysis with the least number of experiments. If a process has more than just a few steps whose possible values have a large range, the number of experiments needed for process characterization can be prohibitively large. In addition, the role of each step in determining the final outcome is generally not clear.The traditional method of collecting large quantities of data, by holding each factor constant in turn until all possibilities have been tested, is an approach that quickly becomes impossible as the number of factors increases. Statistical experimental design is a systematic and efficient alternative methodology for characterization and modeling using a relatively small number of experiments. The statistical data analysis was performed by investigating the DOE data from a 25-1 fractional factorial design with multiple center points.
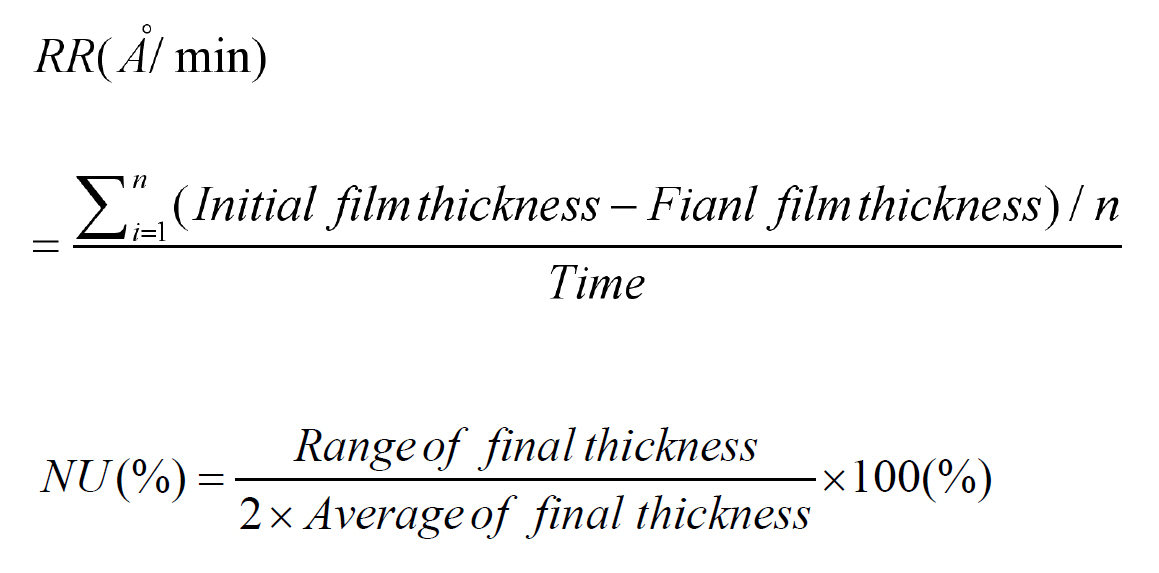
A randomized experimental run order was strictly followed in order to avoid any experimenter bias or tool condition associated with time. Two responses of interest, the removal rate (
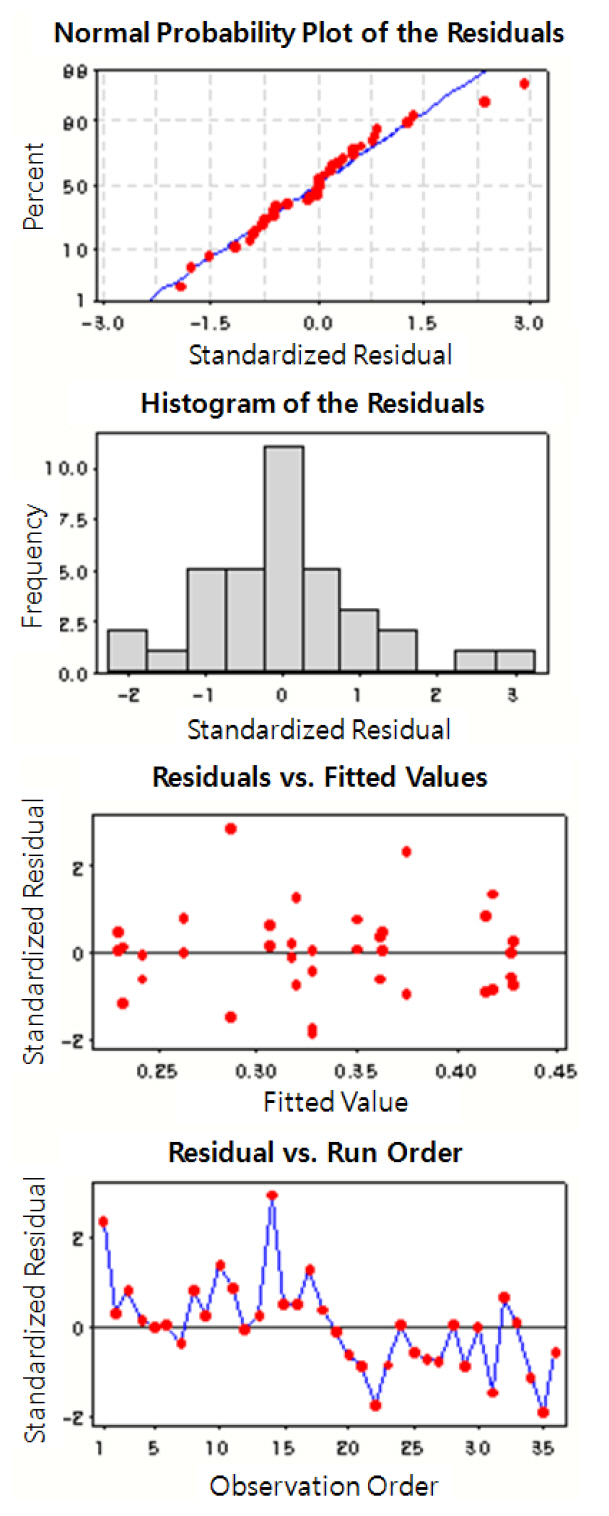
While the statistical analysis of a given data set, we found that the percent non-uniformity does not follow a normal distribution and, thus, a Box-Cox transformation was initially taken before any further statistical data analysis, which will be described in detail in the following section.
A key underlying assumption in statistics is that the given data follows anormal distribution, and checking the normality before any statistical analysis is highly recommended. Otherwise, misleading conclusions may be drawn. We checked the data normality for both responses, and the percent non-uniformity
(
The transformed
that the transformation of the NU data is necessary for further analysis.
Once the statistical requirement for further analysis was satisfied, we performed a qualitative analysis for the purpose of understanding the relationships between the parameters. Statistical analysis and regression modeling certainly provide a great amount of specific information, but sufficient background knowledge of statistics is required to interpret the result However, this paper focuses on qualitative analysis to provide insight into first level equipment engineers in their operation.
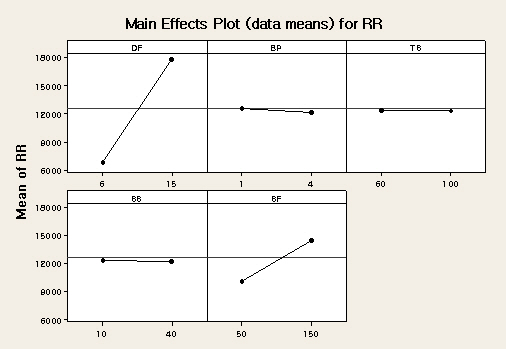
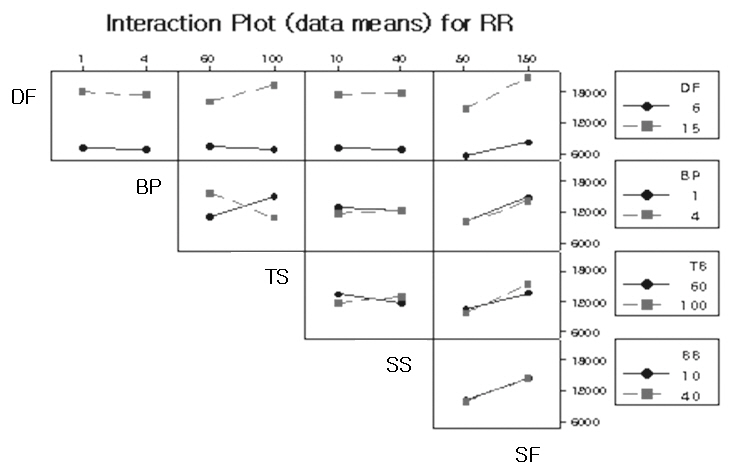
At first glance, the factors having the most influence are the down force (DF) and slurry flow (SF), and it is therefore not surprising that the mechanical polishing mechanism is dominant for phosphosilicate glass. The initially considered variables, viz.the back pressure (BS), spindle speed (SS), and table speed (TS), were found to be insignificant factors from the main effect plot, as shown in Fig. 3. The interactions of BP-TS and TS-SS with respect to RR are shown in Fig. 4, but they are among the insignificant parameters. On the other hand, the BP can affect the removal rate with DF, and it has similar downward forcing mechanisms on the wafer in this process. The qualitative analysis of the two types of plots allows engineers to consider the three most important tool parameters to keep constant in the device manufacturing process. One can conduct a qualitative analysis,such as ANOVA analysis and regression modeling, to achieve the
degree of control required for this specific process, but numerical analysis is outside of the scope of the work. The regression equation derived for the removal rate is as follows.

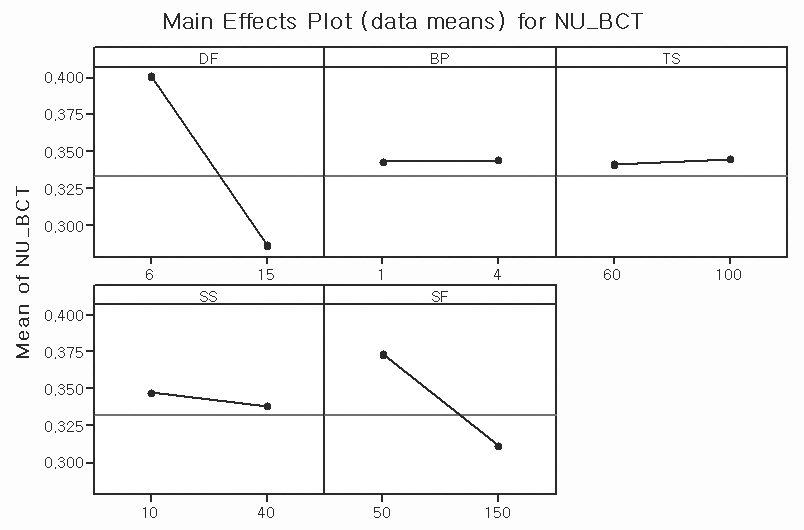
From the main effect plot in Fig. 5, only two parameters, DF and SF, are shown to have a statistically significant effect on the non-uniformity, but some interactions between the other parameters also obviously exist. The qualitative analysis on the percent non-uniformity shows similar results for the removal rate,because its calculation includes the average value of the removal rate from a different location.
For a better understanding of the quantitative information, stepwise regression modeling was carried out. Initially, we included two-way interactions, and a very poor model fit was obtained with R-sq values as high as 40%. Including the three-way interaction terms increased the model fit to almost 60%, but the statistical modeling still retained some degree of residual errors from the modeling. Providing the built regression equation and ANOVA table would give much more detailed information for the analysis, but the qualitative analysis still conceptually holds when the model fit does not provide a good value of R-sq.

The statistical modeling might not be as good as expected, but we found that the DF and SF are the most significant factors in CMP. In addition, the wafer back pressure interacts with the down force to cause a change of the removal rate, and the spindle speed can interact with the SF in terms of the CMP uniformity. For successful semiconductor manufacturing, these tool parameters should be tightly controlled for the purpose of increasing the process yield.
Five parameters associated with process characterization were investigated, and their effects on the removal rate and non-uniformity were determined from the regression equation generated from the regression analysis. From the analysis, it was found that the main effects of down force, back pressure, and table speed, and two- and three-way interaction terms, have a significant effect in the analysis. Ultimately, the non-uniformity is a complex response resulting from the high degree of interactions of more than two parameters, and the control of the non-uniformity in larger wafer fabrication processes is very valuable, especially for high volume manufacturing environments. The removal rate of the CMP process is mainly affected by the down force and spindle speed, but there obviously exists some degree of interaction that cannot be ignored.