Ti-Ni based alloys have been know to undergo the B2(cubic)-B19’ (monoclinic), B2-R (trigonal)-B19’ and B2-B19 (orthorhombic)-B19’ martensitic transformations depending on alloy composition. Near eqiatomic Ti-Ni alloys show the one stage B2-B19’ transformation [1]. Ti-Ni-X alloys prepared by substitution of Fe, Al, Co, Cr, Mo for Ti in near equiatomic Ti-Ni alloys induce the B2-R transformation, and thus transformation occurs in twostage, B2-R-B19’ [2-6]. Ti-Ni-Cu alloys prepared by substitution of Cu for Ni in near equiatomic Ti-Ni alloys induce the B2-B19 transformation, and thus transformation occurs in two-stage, B2-B19-B19’ when Cu content is more than 10at% [7]. Shape memory characteristics associated with the B2-B19 transformation in Ti-Ni-Cu alloys was very attractive for many industrial applications because its shape memory characteristics lied inbetween those of the B2-R and B2-B19’ transformations in Ti-Ni binary alloys [8]. Ti-Ni-Cu alloys with Cu content more than 10at% are, however, so brittle that plastic deformation is not possible. Substitution of transition elements such as Fe, Mo for Ni was found to induce the B2-B19 transformation in Ti-Ni-Cu alloys with Cu content less than 10at%. Ti-Ni-Cu-(Fe, Mo) alloys showed the B2-B19-B19’ transformation and good workability [9,10].
Cr is a 3d transition element and induces the R phase before the B2-B19’ transformation occurs. Similar to Fe and Mo, substitution of Cr for Ni in a Ti-45Ni-5Cu alloy is expected to be effective for inducing the B19 martensite. In this study, Ti-(45-x)Ni-5Cu-xCr alloys were prepared, and then their transformation behavior and mechanical properties were investigated.
Ti-(45-x)Ni-5Cu-xCr(at%) (x = 0.5~2.0) alloys were prepared by vacuum arc melting. The alloy ingot was hot rolled at 1123 K into a sheet with a thickness of 0.8 mm. Specimens for electrical resistivity measurements, X-ray diffractions, tensile tests and thermal cycling tests were cut from the sheet. All specimens were fully annealed at 1,123 K for 3.6 ks in vacuum followed by iced water quenching, then electropolished. In order to investigate transformation behavior, electrical resistivity (ER) measurements and X-ray diffraction (XRD) were carried out. ER measurements were made by means of typical four probe method at the heating and cooling rate of 0.017 K/s. XRD experiments were made using CuKα with successively cooling specimens. In order to investigate the shape memory characteristics, thermal cycling tests under constant load were made by heating and cooling the specimen under various applied stresses. Elongation on cooling and its recovery on heating were measured by linear variable differential transformer.
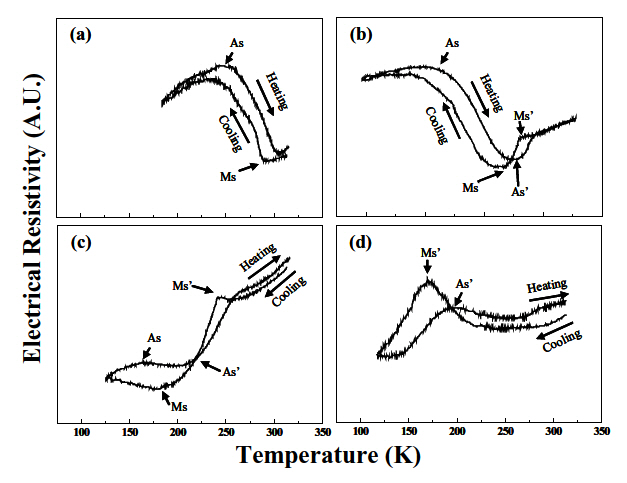
Figure 1 shows electrical resistivity vs. temperature curves of Ti-(45-x)Ni-5Cu-xCr alloys.
In the curve of a Ti-44.5Ni-5Cu-0.5Cr alloy, on cooling, resistivity starts to increase at the temperature designated by Ms. On heating, it starts to decrease at the temperature designated by As. In the curve of Ti-44.0Ni-5Cu-1.0Cr alloy, resistivity starts to decrease suddenly at Ms’, then it starts to increase at Ms. On heating, it starts to decrease at As, and then it starts to increase at As’. In the curve of Ti-43.5Ni-5Cu-1.5Cr alloy, on cooling, resistivity starts to decrease at Ms’ after small increase at 268 K. On further cooling, it starts to increase at Ms. On heating, it starts to decrease at As, and then it starts to increase at As’. In the curve of Ti-43.0Ni-5Cu-2.0Cr alloy, on cooling, resistivity starts to increase at 211 K, then it starts to decrease at Ms’. On heating, it starts to decrease at As’.
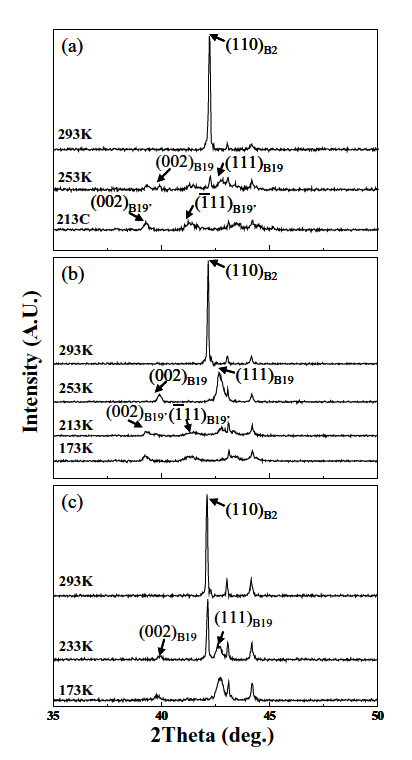
In order to explain the curves in Fig. 1, X-ray diffractions were made with successively cooling the specimens. Obtained X-ray diffraction patterns are shown in Fig. 2. In the patterns of a Ti-44.5Ni-5Cu-0.5Cr alloy, at 293 K, the diffraction peak corresponding to the B2 parent phase is observed. Diffraction peaks observed at 2θ= 43.05° and 44.21° are from a stainless steel specimen holder. On cooling the specimen, at 253 K, diffraction peaks corresponding to the B19 and B19’ martensite appear with decrease in intensity of the B2 diffraction peak. Therefore, the resistivity change in Fig. 1 (a) is ascribed to the B2-B19’ and B2-B19’ transformations.
In the pattern of a Ti-43.0Ni-5Cu-1.0Cr alloy, at 293 K, the diffraction peak corresponding to the B2 parent phase is observed.On cooling the specimen down to 253 K, diffraction peaks of the B19 martensite are found. Therefore, the decrease in resistivity at Ms’ in Fig. 1(b) is attributed to the B2-B19 transformation. On further cooling, at 213 K, diffraction peaks of the B19’ martensite are found, while intensity of those of the B19 martensite decreases. Therefore, the increase in resistivity at Ms is ascribed to the B19-B19’ transformation. On further cooling, at 173 K,diffraction peaks only corresponding to the B19’ martensite are observed. In the pattern of a Ti-43.5Ni-5Cu-1.5Cr alloy, at 293 K, the diffraction peak corresponding to the B2 parent phase is observed.
On cooling the specimen up to 233 K, diffraction peaks of the B19 martensite starts to appear. Therefore, the decrease in resistivity at Ms’ is due to the B2-B19 transformation. Cooling down the specimen to 173 K, only diffraction peaks of the B19 martensite remain.
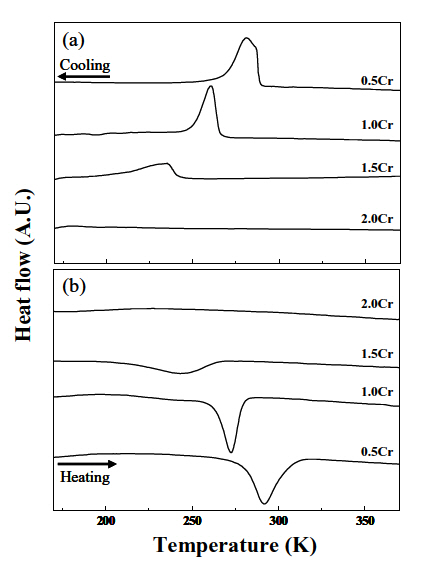
DSC curves of Ti-(45-x)Ni-5Cu-xCr alloys are shown in Fig. 3. In the curves of Ti-(45-x)Ni-5Cu-xCr alloys with Cr content less than 2.0%, DSC peaks are found, while they are not observed in the curve of a Ti-43.0Ni-5Cu-2.0Cr alloy. From Figs. 1 and 2, the DSC peaks of a Ti-44.5Ni-5Cu-0.5Cr alloy are ascribed to the B2-B19 and B2-B19’ transformations. The DSC peaks of the alloys with 1.0 Cr and 1.5 Cr are attributed to the B2-B19 transformation. The absence of DSC peaks of a Ti-43Ni-5Cu-2.0Cr alloy is due to low transformation temperatures in a Ti-43.0Ni-5Cu-2.0Cr
alloy.
From above results, it is concluded that two-stage B2-B19-B19’ transformation occurs in Ti-(45-x)Ni-5Cu-xCr alloys. A clear separation between the B2-B19 and B19-B19’ transformation appears in Ti-44.0Ni-5Cu-1.0Cr and Ti-43.5Ni-5Cu-1.5Cr alloys. Similar two-stage transformation behavior was reported in Ti-(45-x)Ni-5Cu-xFe and Ti-(45-x)Ni-5Cu-xMo alloys [9,10].
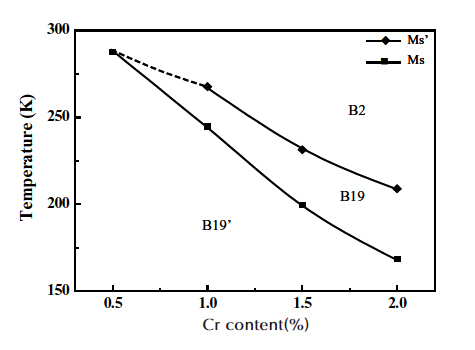
Figure 4 shows Cr content dependence of Ms’ and Ms in Ti-(45-x)Ni-5Cu-xCr alloys. It is found that both Ms’ and Ms decrease with increasing Cr content. It is also found that decreasing rate of Ms (85 K / % Cr) is larger than that of Ms’(17K / % Cr), and consequently a temperature range where the B19 martensite exists is expanded with increasing Cr content. Similar composition dependence of Ms and Ms’was reported in Ti-(45-x)Ni-5Cu-xFe and Ti-(45-x)Ni-5Cu-
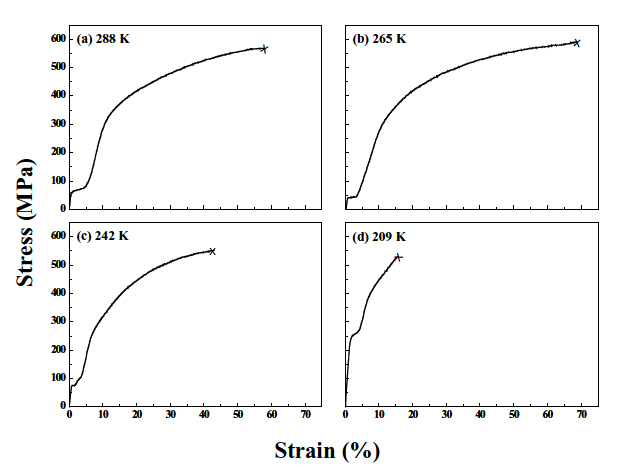
In order to examine workability of Ti-(45-x)Ni-5Cu-xCr alloys, tensile tests were made at near Ms or Ms’ and stress-strain curves obtained are given in Fig. 5. Except 2.0 % Cr alloy, Ti-(45-x)Ni-5Cu-xCr alloys deform in plastic manner with fracture strains of 68% ~ 43%. Therefore, it is concluded that substitution of Ni for Cr is effective for inducing the B19 martensite with a good workability.
In order to investigate the shape memory effect of Ti-(45-x)Ni-5Cu-xCr alloys, thermal cycling tests under constant load were made.
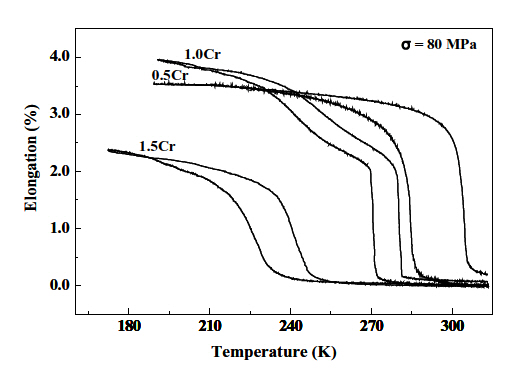
Figure 6 shows typical elongation vs. temperature curves obtained under the applied stress of 80 MPa. One-stage elongation corresponding to the B2-B19 and B2-B19’ transformations occurs in the curve of a Ti-45.5Ni-5Cu-0.5Cr alloy, while two-stage elongation due to the B2-B19-B19’ transformation is observed in a Ti-44.0Ni-5Cu-1.0Cr alloy. One-stage elongation corresponding to the B2-B19 transformation is found in a Ti-43.5Ni-5Cu-1.5Cr alloy. It is noted that residual elongation designated by εP is observed in Ti-45.5Ni-5Cu-0.5Cr and Ti-44.0Ni-5Cu-1.0Cr alloys, while it is not in a Ti-43.5Ni-5Cu-1.5Cr alloy. εP is found to decreases from 0.2% to 0.07% with increasing Cr content from 0.5% to 1.0%. Residual elongation is originated from a plastic deformation introduced during thermal cycling. Therefore, it is concluded that substitution of Cr for Ni improves the critical stress for slip deformation in a Ti-45Ni-5Cu alloy. Similar hardening effect by substitution of Cr for Ni
has been reported in (50-x/2)Ti-(50-x/2)Ni-10Cu-xCr(x = 0~1) alloys [11].
Transformation behavior, shape memory characteristics and superelasticity of Ti-(45-x)Ni-5Cu-xCr alloys were investigated. Results obtained are as follows;
1) Two-stage B2-B19-B19’ transformation occurred in Ti-(45-x)Ni-5Cu-xCr alloys. A clear separation between the B2-B19 and B19-B19’ transformation appeared in Ti-44.0Ni-5Cu-1.0Cr and Ti-43.5Ni-5Cu-1.5Cr alloys.
2) A temperature range where the B19 martensite exists was expanded with increasing Cr content because decreasing rate of Ms (85 K / % Cr) was larger than that of Ms’ (17 K / % Cr).
3) Ti-(45-x)Ni-5Cu-xCr alloys were deformed in plastic manner with a fracture strain of 68%~43% depending on Cr content.
4) Substitution of Cr for Ni improves the critical stress for slip deformation in a Ti-45Ni-5Cu alloy.