This paper summarized concept, manufacture and results of the micro-tubular solid oxide fuel cells (SOFCs). The cells were fabricated by co-sintering of extruded micro-tubular anode support and electrolyte coating layer, and then additional cathode coating. The cells showed quick voltage rising within 1 minute, and the electrochemical performances were closely related to the balance of fuel utilization and performance loss. And a thermal-fluid simulation model was also reported in combination with the electrochemical evaluation results on the GDC-based micro-tubular SOFCs.
Solid oxide fuel cells (SOFCs) have been investigated because of their high energy conversion efficiency and environmental compatibility. A decrease in the operation temperature of SOFCs can realize a widening of the range of applicable materials, such as metallic interconnects and glass sealants, and an improvement in the material degradation, which can result in cost reduction and elongation of the SOFC stack lifetime [1-3]. The use of alternative high performance electrolyte and electrode materials means that the SOFC operation temperature can be reduced [4,5]. In addition, miniaturization of the cell size and integration of multiple miniaturized cells is also considered to be one of the most effective approaches to increasing the volumetric power density [6]. Technologies have been intensively studied to reduce operation temperature, reduce size, and improve start-up and shut-down operation [7-9]. Among the various proposed cell designs, a micro tubular SOFC design exhibits many desirable characteristics, for example, increasing the net electrode area per unit volume, and the durability to thermal stress caused by rapid start-up operation [10-13]. In the case of tubular SOFCs, downsizing the cell size enables an increase in the number of cells that can be accumulated in a certain volume, which leads to an increase in the net electrode area per volume. Thus, it is possible to increase the volumetric power density of SOFC modules at lower SOFC operation temperatures by gaining a large electrode area per volume, even though the power density of the cell tends to decrease at the lower temperature range.
Very recently, various researchers reported excellent electrochemical performance and durability during heat-cycling for microtubular SOFC designs [7-9,13,14]. Thus, this report summarizes concept, fabrication and analyses for an anode-supported microtubular SOFC. The samples were prepared via co-sintering of the electrolyte and porous anode support, and then a cathode layer was also prepared on the electrolyte film. Evaluations were conducted using potentio/galvanostat and an impedance analyzer under humidified hydrogen flow.
Micro-tubular SOFCs were fabricated using traditional extrusion and coating techniques. The anode slurry was consisted of NiO powder, gadolinium-doped ceria (GDC) powder, and cellulose as the binder. The anode components were mixed with water using an industrial mixer for 1-2 hours and left to age overnight. Placing a vacuum over the anode mixture allowed for excess air to be removed. Anode tubes were extruded from the anode mixture using a ram extruder and a custom made die. The anode tubes were allowed to dry, were cut to the desired length, then dip-coated in GDC electrolyte slurry and allowed to dry. The GDC slurry is composed of the ceramic powder and organic ingredients such as binder, dispersant and organic solvents. The desired electrolyte thickness was achieved through multiple electrolyte coatings and subsequently the tubes were sintered at 1,300-1,400℃ for several hours in air. The densification of the electrolyte layer deposited on the support surface was greatly affected by the shrinkage of tubular support during the co-sintering process. Support shrinkage above 15% was found to produce a fully densified electrolyte layer on the anode support. In contrast, the use of an anode support with shrinkage below 10%constrained GDC sintering, resulting in a poorly densified GDC microstructure. Next, the electrolyte coated anode tubes were dip-coated in cathode slurry consisting of the La0.6Sr0.4Co0.2Fe0.8 (LSCF) and GDC powder, and organic ingredients similar with those of the electrolyte slurry. The cathode dip-coated tubes were dried in air and sintered at 1,000-1,100℃ for several hours in air to complete the fuel cell fabrication.
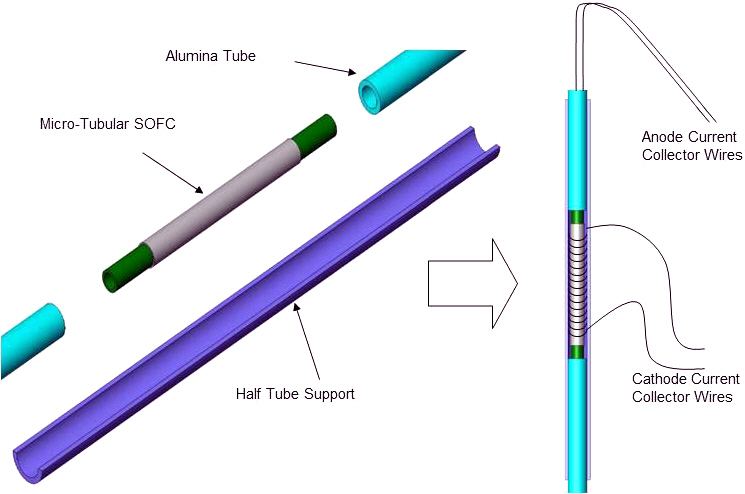
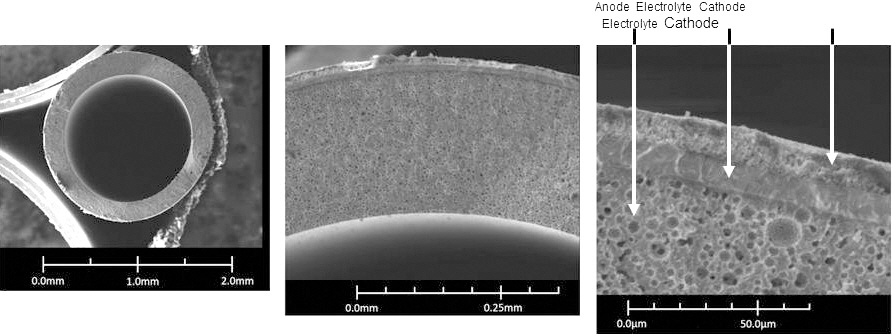
An environmental scanning electron microscope (ESEM) was used to check the electrode and electrolyte microstructure. In order to carry out the experimental activities, measuring the fuel cell electrochemical performances, a specific support was also manufactured. Such a support is capable of sustaining the fuel cell when it is mounted in the furnace, it also allows the gas distribution on the anode and cathode sides and assures the electrical connection with the electrical load and potentiostat. Each tube was connected to 2 alumina tubes allowing the inner anode gas distribution, sustaining the cell in the furnace. The entire system was placed on an alumina half tube support in order to yield stronger the structure (Fig. 1). Figure 2 shows how each microtube was mounted for testing within a vertically mounted microtube furnace, and also shows a cross sectional ESEM image of
the fabricated miacro-tubular SOFC, with porous electrodes and a dense electrolyte. Cells were tested vertically as shown in order to ensure evenly distributed flow of fuel gas across the anode surface (horizontally oriented cells are subject to uneven fuel gas distribution due to gravity). The four current collecting wires from the cell were connected to an impedance analyzer and the electrical load at operating temperature ranges between 400℃ and 600℃. Individual cells were run using humidified hydrogen gases (3% of H2O) as fuel to the anode side, while the cathode side (outside surface of tube) was exposed to atmospheric conditions.
3.2 Electrochemical performances
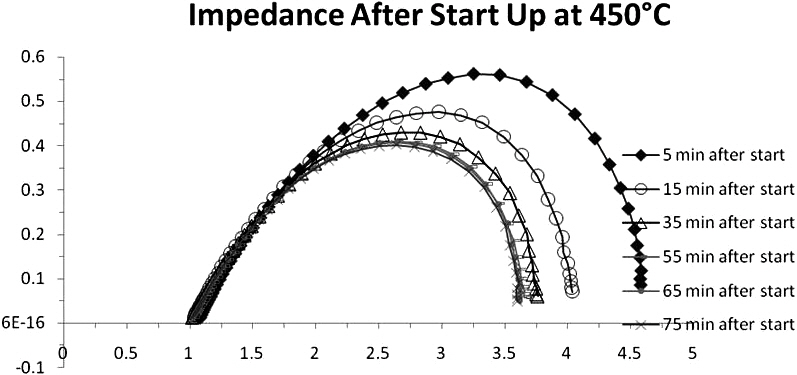
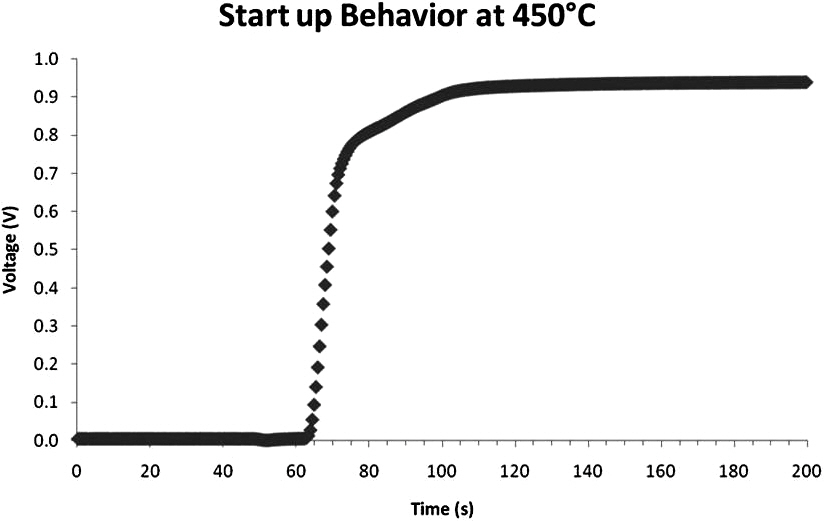
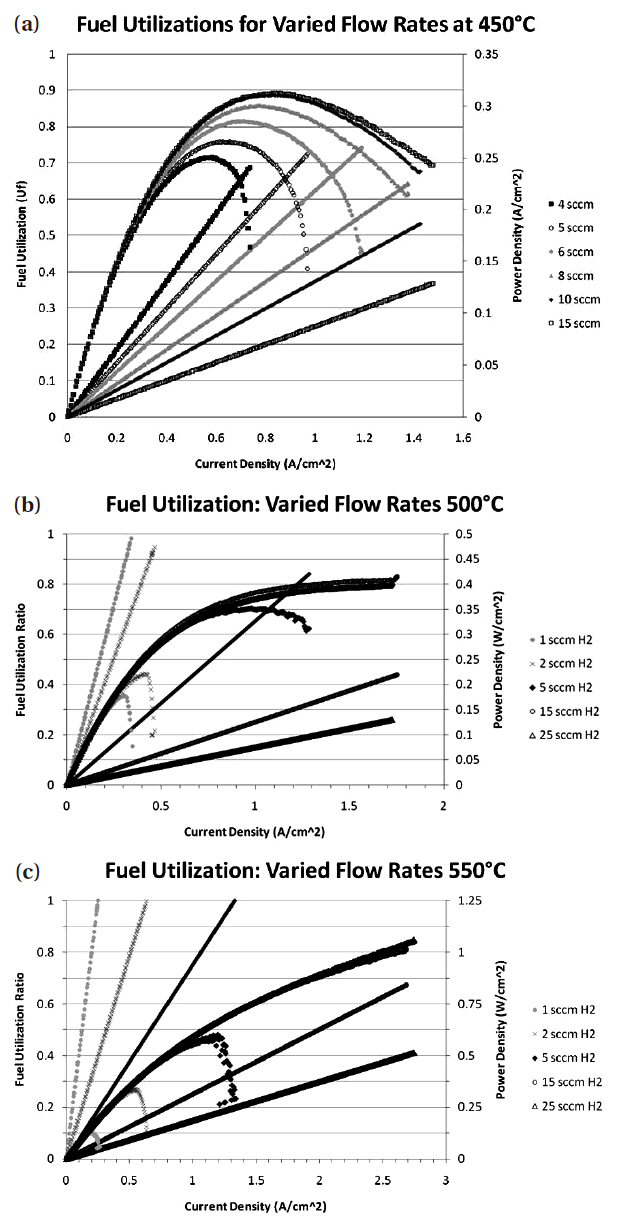
The cell immediately began to reduce and produce a voltage as shown in Fig. 3. The cell voltage rose to 0.94 V after only 1 minute and the cell continued to produce a voltage of 0.94 V thereafter.In order to understand whether the cell had fully reduced in this time, impedance measurements were taken in increments after the cell had started up. The start up impedance information is shown in Fig. 4. The information gathered through the impedance analysis shows that the entire cell impedance decreases the longer the cell has been run. The ohmic impedance of the cell remains relatively constant at around 1 Ω, however the electrode polarization resistances decrease with time until around 50 minutes where no further change in electrode polarization resistance is observed as a function of time. The electrode polarization resistance decreased by as much as 0.5 Ω in 10 minutes after the cell had started up. After start up behavior analysis, the cell was held at 450℃ and IV characterization of the cell was performed for varying flow rates of humidified H2 (3% H2O by volume)through the cell. Figures 5(a)~(c) outlines the performance of the cell for varying fuel utilizations at 450℃ and concentration polarization losses are apparent in the IV curves shown. The fuel utilization was calculated from equation Uf = i/(nFv), where the current drawn from the cell (i), the number of electrons transferred in the reaction between H2 and ½ O2 (n = 2), the flow rate of fuel (v), and the inlet temperature of the fuel were used to calculate the fuel utilization (Uf) of the cell for the varying flow rates of fuel through the cell. The temperature of the inlet fuel stream is important because the density of H2 entering the fuel cell is dependent on this parameter. As can be seen in Figs. 5(a)~(c) since at higher temperatures more current can be drawn from the cell, more hydrogen is necessary to drive the higher currents and fuel utilization values change for a specific flow rate. Thus, balancing fuel utilization with performance loss is an important issue when designing an efficient system since the performance of the cell is closely related to the fuel utilization.
4. MODELING OF MICRO-TUBULAR SOFCS
In modeling studies of SOFCs, the common approach is to either model the cell isolated from its surrounding, or to include some aspect of the surrounding environment by truncating the
domain where the variables associated with the transport phenomena have not yet settled down to their “free stream” values.When large gradients (of these variables) are present, these approaches may lead to misrepresentation of the physics. For example,large differences in temperature or species concentration between the SOFC and its surroundings result in larger length scales for heat and mass transfer. Therefore, if a single cell is to be modeled with some portion of the physical domain, boundary conditions should be selected at the boundaries where truncation takes place, otherwise, a broader domain should be selected to cover spatial variations. However, selecting a larger domain requires further computational effort due to the mismatch between the aspect ratios of different parts of the computational domain.
Although there are substantial works in modeling of SOFCs, few modeling studies have focused on the parametric analysis. Parametric analysis is an important method to understand the fuel cell behavior and compare the performance of the system affected by various factors. These factors can be related to either the cell geometry, material properties or operational conditions. Changes in the geometry of the cell come along with uncertainties in the parameters related to reaction kinetics as the latter cannot be predicted without additional experiments. If the fuel cell performance is desired to be compared for two different cathode thicknesses, parameters related to reaction kinetics have to be updated for the new geometry as the distribution of the three phase boundaries will change along with the percolation of the phases in the new geometry. Many of the modeling studies found in the literature carrying out parametric analyses of SOFCs focus on the geometrical aspects of the system. However, these studies neglect the above-mentioned uncertainties arising with the change of the electrode geometry and are incapable of providing a precise tool to assess the effects of the geometrical
[Fig. 5.] Fuel utilization and power density of the cells running at (a) 450℃ (b) 500℃ and (c) 550℃.
parameters. Therefore, the effects of geometry on the fuel cell performance are not considered in this study. There are also studies focusing on the operational parameters such as utilization,flow rate, temperature and pressure. Ni et al. [15] developed a model to conduct parametric analysis to address the effects of operating conditions on the overpotentials. Their work constitutes a one dimensional (1-D) model employing electrochemical relations and mass balances, and does not include energy and momentum balances. Jiang et al. [16] built a thermal and electrochemical model of a tubular SOFC to study the effects of operating conditions such as pressure, temperature and flow rate.Their model is a lumped model and does not consider spatial distribution of the variables. Lisbona et al. [17] analyzed a SOFC stack with the balance of plant to develop relations between cell performance and the operational parameters such as utilization, air flow rate and inlet gas temperature. The developed model consists of only electrochemical relations and the transport phenomena inside the stack are not considered. Colpan et al.[18] developed a model employing thermodynamic calculations to identify the effects of utilization on cell output power and efficiency. Bove and Ubertini [19] carried out a utilization analysis for a tubular SOFC. Their model employs energy balance and electrochemical relations along with the simple algebraic relations for gas compositions. Although these models constitute significant contributions to the field, they either do not incorporate the sophisticated transport phenomena in the fuel cell rigorously or they underestimate the effects of spatial distributions of the transport variables.
While there are a number of significant modeling efforts, both in steady-state and in transient, transient SOFC models typically are not as elaborate as steady-state models. Some of the transient models are lumped models neglecting all the spatial variations. They are mainly developed for control or to simulate the fuel cell as part of the larger system. Transient models incorporating transport phenomena vary from one dimensional to three-dimensional models. 3-D models are developed generally for planar SOFC, whereas exploiting the axial symmetry of the tubes, two-dimensional models are preferred and most of the time sufficient to represent a SOFC with a tubular design.
Achenbach [20] presented one of the first transient studies on SOFCs. He developed a 3-D transient model to investigate the voltage responses of a planar SOFC to certain load changes. Jia et al. [21] provides detailed analysis of the effects of operating parameters on the steady state and transient performance of a tubular SOFC. Employing a 1-D model, they represented the conservation laws with a control volume approach. In a recent study by Mollayi Barzi et al. [22] dynamic responses of a tubular SOFC are predicted during the startup. Their 2-D model incorporates mass, momentum and species balances accompanied with a circuit representation of charge balances. Bhattacharyya and Rengaswamy [23] compared the dynamic behavior of the cell with the experiments in their 2-D model of a tubular SOFC. Along with investigating dynamic response of the cell to the changes in voltage, they also predicted the response of the cell to the changes in hydrogen flow rate. Ota et al. [24] compared transient characteristics of a standard tubular cell with a microtubular cell with a modeling framework presented therein. Their modeling framework is based on simplifications instead of taking into account full coupling of the sophisticated transport phenomena. They reported that time scales of a standard tubular cell to a specific voltage response is six times larger than that of a micro-tubular cell.
Another modeling study on micro-tubular SOFCs is presented by Nehter. In this study, he compared a common micro-tubular cell with a cascaded one. Although localized temperature and species concentrations are provided in his 2-D axial symmetric model, momentum balance and multicomponent species transfer are not included. Mass balance is carried out in a simple way via algebraic equations describing the electrochemical and shift reactions.
Although there are many simplifications in the models of Ota et al. [24] and Nehter [25], their studies are significant since, to the knowledge of the authors, they are the only modeling efforts emphasizing dynamics of micro-tubular SOFCs. Since the characteristics of a micro-tubular SOFC are very different than a standard tubular cell, there is still need for a rigorous model to study the dynamics of such a cell.
4.3 Thermal-fluid model description
The work performed by Serincan et al. [26] employsed two separate models to have a more accurate representation of the actual fuel cell test system. (i) a furnace model and (ii) a fuel cell
model. With the predictions from the former, boundary conditions were determined for the fuel cell model.
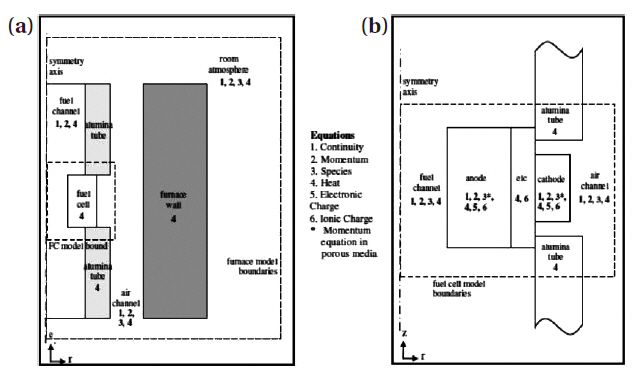
Figure 6 represents the geometrical domains for the furnace model and the fuel cell model. The model exploited the axial symmetry of the tubular geometry therefore reducing the modeling domain into a 2-D axisymmetric domain, assuming the anode and the cathode current collectors were uniformly distributed on the electrode surfaces. Figure 6, (not drawn to scale) also shows the cross-section of the axisymmetric geometry.
The actual model geometry can be visualized by revolving this cross-section around the symmetry axis, i.e. centerline of the anode tube. Mass, species and momentum conservation equations were solved in the gas channels and the porous electrodes, and energy conservation were applied for the entire domain. Ionic charge balance was applied in the anode, the electrolyte and the cathode, whereas the electronic charge balance was applied in the anode and cathode.
The micro-tubular cells considered in this study were fabricated and characterized as described above. The anode supported cells employed a GDC electrolyte coated on a NiO-GDC anode, and LSCF-GDC cathode. It is well-known that GDC electrolytes are prone to internal current leakages. GDC can reduce, and become electronically conductive, especially at elevated temperatures. A fraction of the electrons generated at the anode can then be transferred to the cathode through the electrolyte. As a result the cell is short-circuited and a drop in the open circuit potential is experienced. The effect of current leakages becomes less significant at higher current densities, because they are inversely proportional to the ionic current density. In this work, the electronic current leakages were modeled as boundary conditions to the electronic charge equation at the electrolyte interfaces of anode and cathode, while describing the boundary conditions. The furnace model was used to explicate the transport phenomena in the furnace and the surrounding room atmosphere, and estimated the transport properties at the boundaries of the fuel cell model domain. Computational domain for furnace model was chosen by trying different dimensions until the gradients disappeared, and/or not to have a significant effect on the distribution inside the furnace.
The furnace model consisted of the furnace, fuel cell as a whole, alumina tubes (shown in Fig. 1), air channel and the surrounding room atmosphere. In the air channel and the room atmosphere species, momentum and heat equations were solved. In the fuel cell, these equations were modified accordingly to account for porous media transport. In the furnace walls and alumina tube only heat equation was solved. The difference between the furnace temperature and the room temperature invokes natural convection, which transmits the air to the fuel cell. To implement natural convection in the model, a non-isothermal flow equation was used. Another approach could have been to apply a Bousinesq approximation to the Navier-Stokes equation which would be based on linearization of density with respect to the changes in temperature and concentration. Further, Maxwell Stefan equations coupled with heat and momentum equations were used to model the species balance.
On the other hand the fuel cell model included truncated air and fuel channels, alumina tubes, anode, electrolyte and cathode as is seen in Fig. 6. In the air and fuel channels, species, momentum and heat equations were solved. In the anode and cathode,in addition to these equations which were modified for porous media, ionic and electronic charge equations were also solved. In the electrolyte ionic charge equation was solved along with heat equation. In the alumina tubes only heat equations were solved.
Maxwell-Stefan equations were used to model the multi-component species balance instead of Fick’s Law which is applicable only for binary mixtures. To model momentum transfer, nonisothermal flow equations were solved, with the non-isothermal continuity equation, to take into account the density changes with temperature and species concentration. In the porous electrodes momentum equations were modified in the form of nonisothermal Brinkmann equations. Darcy’s Law for momentum transfer in porous media was not chosen as it does not include stress tensors in its formulation. Heat equations were formulated in order to include enthalpy transfer. Heat transfer due to radiation was modeled as boundary conditions. Electronic and ionic charge balances were implemented in the form of Ohm’s Law throughout the anode, electrolyte and the cathode domains.
The results of the furnace model described above showed that oxygen concentration at the boundaries strongly depend upon the fuel cell operation conditions, and the importance of assigning the right boundary condition. The model results were also compared with experimental data, and related polarization curves show good agreement for a set of different operating temperatures. Having a good match with the same set of fitting parameters for three different polarization curves suggest the model captures the temperature dependence of the fuel cell electrochemistry well. Temperature distribution in the cell was evaluated and the average radial temperature gradient was calculated as 2.25℃/mm whereas the axial average gradient as found to be 18℃/mm. It was predicted that the temperature may rise by up to 120℃ for an SOFC operating at 0.2 V. This temperature rise is attributed to the ohmic heating due to the losses during fuel cell operation. It was further shown that it was a good assumption for a microtubular SOFC to lump all the losses at the anode due to the very small thickness of the tube.
Leakage currents were found to be the reason for an open cell voltage (OCV) drop of 0.18 V at 550℃ and their effects diminish gradually until they vanish around cell voltages of 0.6 V. It was also shown that at higher operating temperatures the internal current leaks associated with the electron transfer through the electrolyte were more significant. It was predicted that if the output current demand is 0.53 A/cm2, the fuel cell has to generate an ionic current density of 0.65 A/cm2 at 550℃, as under this condition the leakage currents sum up to 0.12 A/cm2.
The dependency of current density on transport properties was also studied and the effects of temperature and species concentration were shown on the current density profiles. Moreover exchange current density as a measure of reaction rate was considered and it was suggested from model results that anode thickness can be reduced to promote reactant diffusion to the active catalyst sites.
Effects of temperature, fuel flow rate, fuel composition, anode pressure and cathode pressure on the SOFC performance were investigated. It was shown that increase in temperature results in better cell performance due to increase in catalytic activity, ionic conductivity and decrease in mass transport losses. It was found that with higher flow rates, the performance of the cell increases, however the efficiency decreases due to the lower utilization. In conjunction with this it was advised that the fuel flow rate should be chosen according to the desired operating range such as; at mid-range current densities lower flow rate as suggested because of the efficiency of the cell, and in the higher current density range, higher flow rate should be chosen (i.e., a stoichiometric flow control) because of the output power implications. It was also shown that the utilization of the fuel was not zero when the cell does not generate current because the reacted fuel is not enough to overcome the internal current leakages. When fuel composition was considered, higher hydrogen content was favorable for power output, efficiency and thermal management. Increases in anode side and cathode side pressures have two distinct effects on cell performance: increase in pressure reduces reactant diffusivity but increases catalytic activity. However, the latter overwhelms the adverse effects of decreased mass transport and cell performance is always observed to improve with larger back pressure. When the effects of pressure on the anode and cathode sides are compared, it was seen that it was more sensitive to changes in the air pressure mainly due to the slow reaction kinetics of the cathode.
Response of the cell to a change in voltage was also investigated. An overshoot was observed in the current density response as a result of the combined effect of fast electrochemical reaction and slower dynamics of the mass transfer. It was predicted that time-scales of a micro-tubular SOFC is in the order of 20 s governed by the dynamics of heat transfer.
We summarized the state of the art of developing technologies of the micro-tubular SOFCs. The cells were fabricated by commonly available techniques, such as co-sintering of extruded micro-tubular anode support and electrolyte coating layer. The micro-tubular cells showed quick start-up behavior, and the electrochemical performances were closely related to the balance of fuel utilization and performance loss. And a thermalfluid simulation model was also reported in combination with the electrochemical evaluation results on the GDC-based microtubular SOFCs.