A power transformer in power systems must operate well without failure because of the high cost of the core equipment.Generally, a large transformer uses a forced circulation cooling system to improve the cooling efficiency of the insulting oil [1]. Electrostatic phenomena occur when the insulating oil returned forcibly inside the transformer streams on to the solid surface,which is called streaming electrification [2,3]. This streaming electrification is a very important element in the improvement for improving of the reliability of a transformer that must be considered when a large transformer is designed and made [4]. The amount of charge involved in the streaming electrification of a transformer increases with increasing speed of the cooling oil that is involved with increasing size and high voltage of power transformers. This streaming electrification can be a problem when the material is affected by the fluid conductivity at high voltages. OH- ions in the insulating oil are absorbed on the surface of an insulating sheet and transformer iron core due to the streaming electrification phenomena of insulating oil and positive ions and electric double layers are formed. In these double layers, the insulting oil streams in the transformer and the (+) ions formed on the interface between the insulating oil and solid surface spread into the insulating oil due to the destruction of the electric double layers and the streaming current flow [5]. Thus, streaming electrification equipment was designed and made in the laboratory. The flow and temperature in the transformer oil was controlled to investigate the relationship between the streaming electrification current and the amount of flow and temperature. In addition, the effect of the amount of BTA
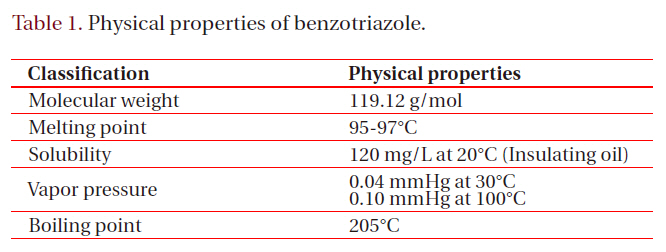
[Table 1.] Physical properties of benzotriazole.

Physical properties of benzotriazole.
addition, a streaming electrification inhibitor, was examined.The characteristics of the streaming electrification current were analyzed according to the amount of flow, temperature and the amount of BTA addition. An increase in the streaming electrification current in the insulating oil in the transformer can result in the breakdown of a portion of the transformer, which can cause an electric power accident. In order to prevent the occurrence of these phenomena, a previous study considered the injection of negative (-) ions into the insulating oil by the addition of BTA to reduce the density of the positive (+) ions, and the reported suppression of the streaming electrification current [6,7]. Streaming electrification of the insulating oil is becoming a major problem as the level of insulation improves. It was reported that the amount of charge is affected by the flow rate in the transformer,temperature, shape of the flow path as well as the contact area and surface material of the insulator [8,9]. The charge current formed in the transformer oil by the difference in the amount of charge, varies with the surface charge and space charge in the transformer, which can result in dielectric breakdown. Therefore, in this study an examination was performed on the effect of transformer oil containing BTA as a charge inhibitor on the characteristics of streaming electrification, which is the cause of transformer accidents. Therefore, to determine the optimal amount of BTA on reducing the streaming electrification, the effect of BTA on the streaming current was examined at different flow rates and temperatures.
Figure 1 shows the molecular structure of the BTA and table1 lists the properties of the BTA [10]. The amount of transformer oil was 2000 ml. Four specimens containing 5 ppm, 10 ppm, 30 ppm or 50 ppm BTA were prepared under the same conditions.Subsequently, after stirring for 9 hours, the four mixtures were degassed under a vacuum of 10-2Torr for 2 hours to reduce the effect of bubbles on the physical properties and characteristics of the streaming electrification.
2.2.1 Physical properties
Optical analysis was used to investigate the physical properties
of the transformer oil. The electronic spectrum of the specimens showed the molecular structure of the materials. The Fourier transform infrared (FTIR; JEOL Co., Japan) spectra of the virgin and four prepared specimens were compared to determine if there was any chemical exchange.
2.2.2 Streaming electrification
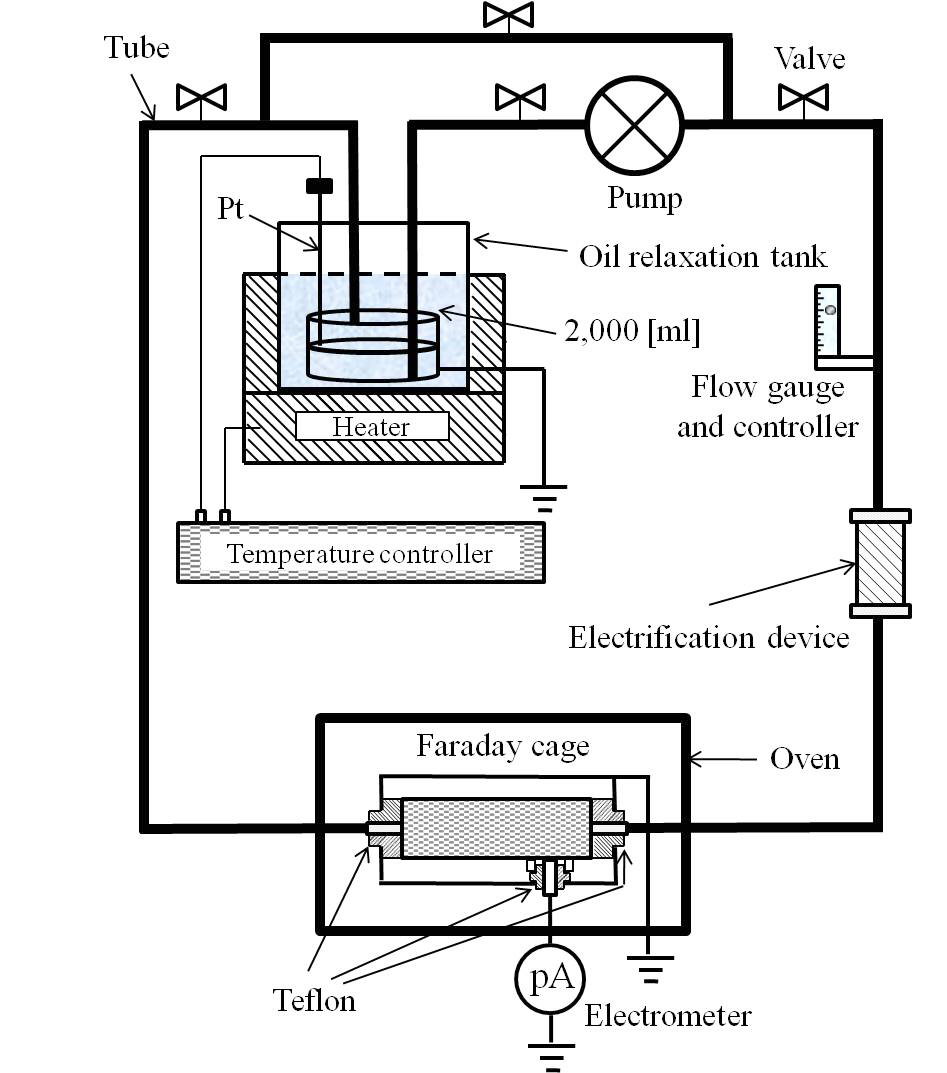
In order to measure the very small current in the specimen resulting from the streaming electrification of the transformer oil, the devices were installed, as shown in Fig. 2, and the streaming electrification current was measured [11]. A Faraday cage and small ammeter (MODEL 6517; Keithley Co., USA) were used to measure the very small current. An oil relaxation tank with a controlled flow rate, velocity and temperature was also used.
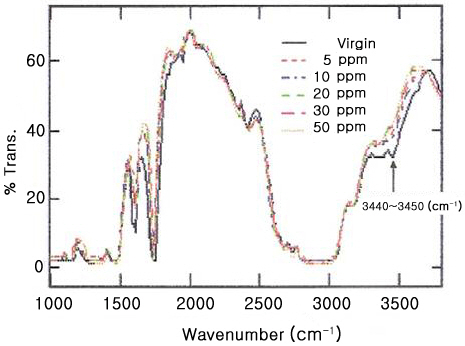
Figure 3 shows the FTIR spectra of the specimen with different BTA contents. The physical properties of the specimens were analyzed according to the amount of BTA addition. The peak at 3,440~3,450 cm-1 observed for the virgin specimen was reduced by adding BTA. This effect was attributed to a decrease in the OH- content in the transformer oil due to the conjugation of nitrogen with the isolated electron pairs in the BTA.
The streaming electrification current was measured in order to investigate the amount of streaming electrification current generated by the flow of each specimen and the change in BTA content.
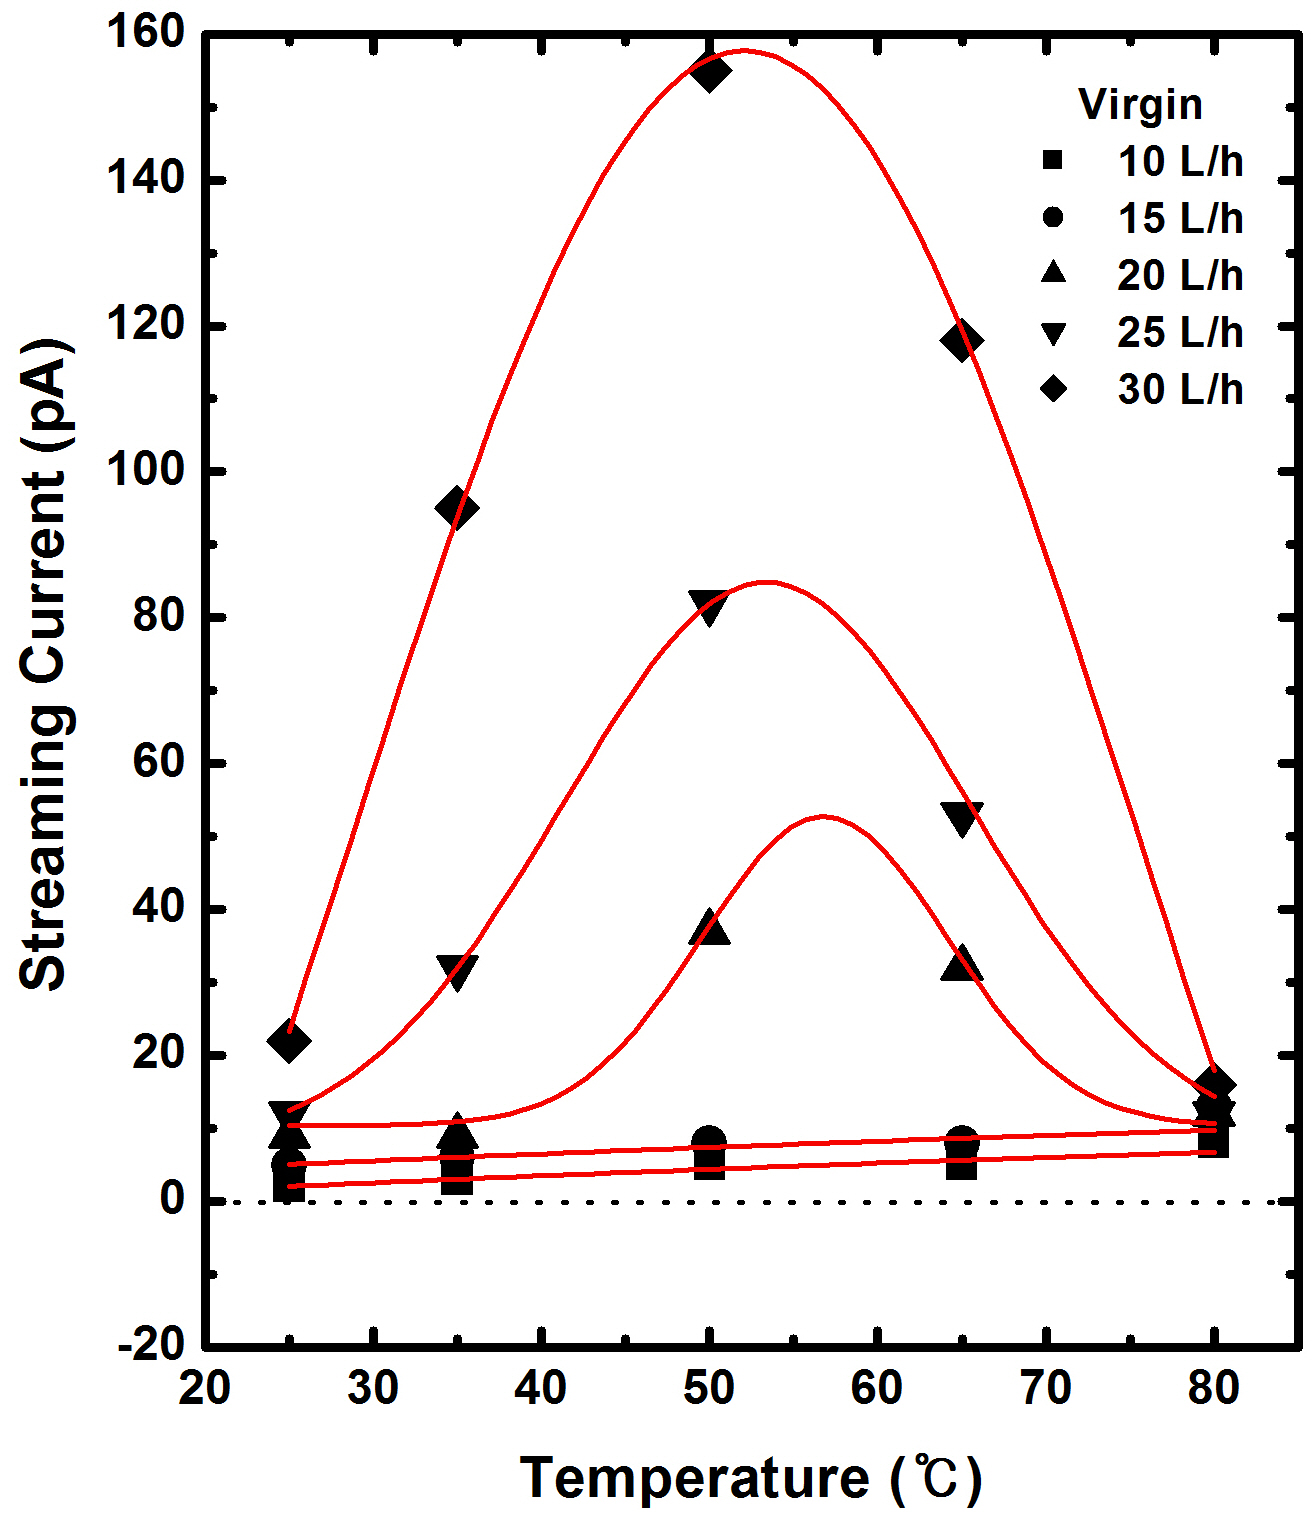
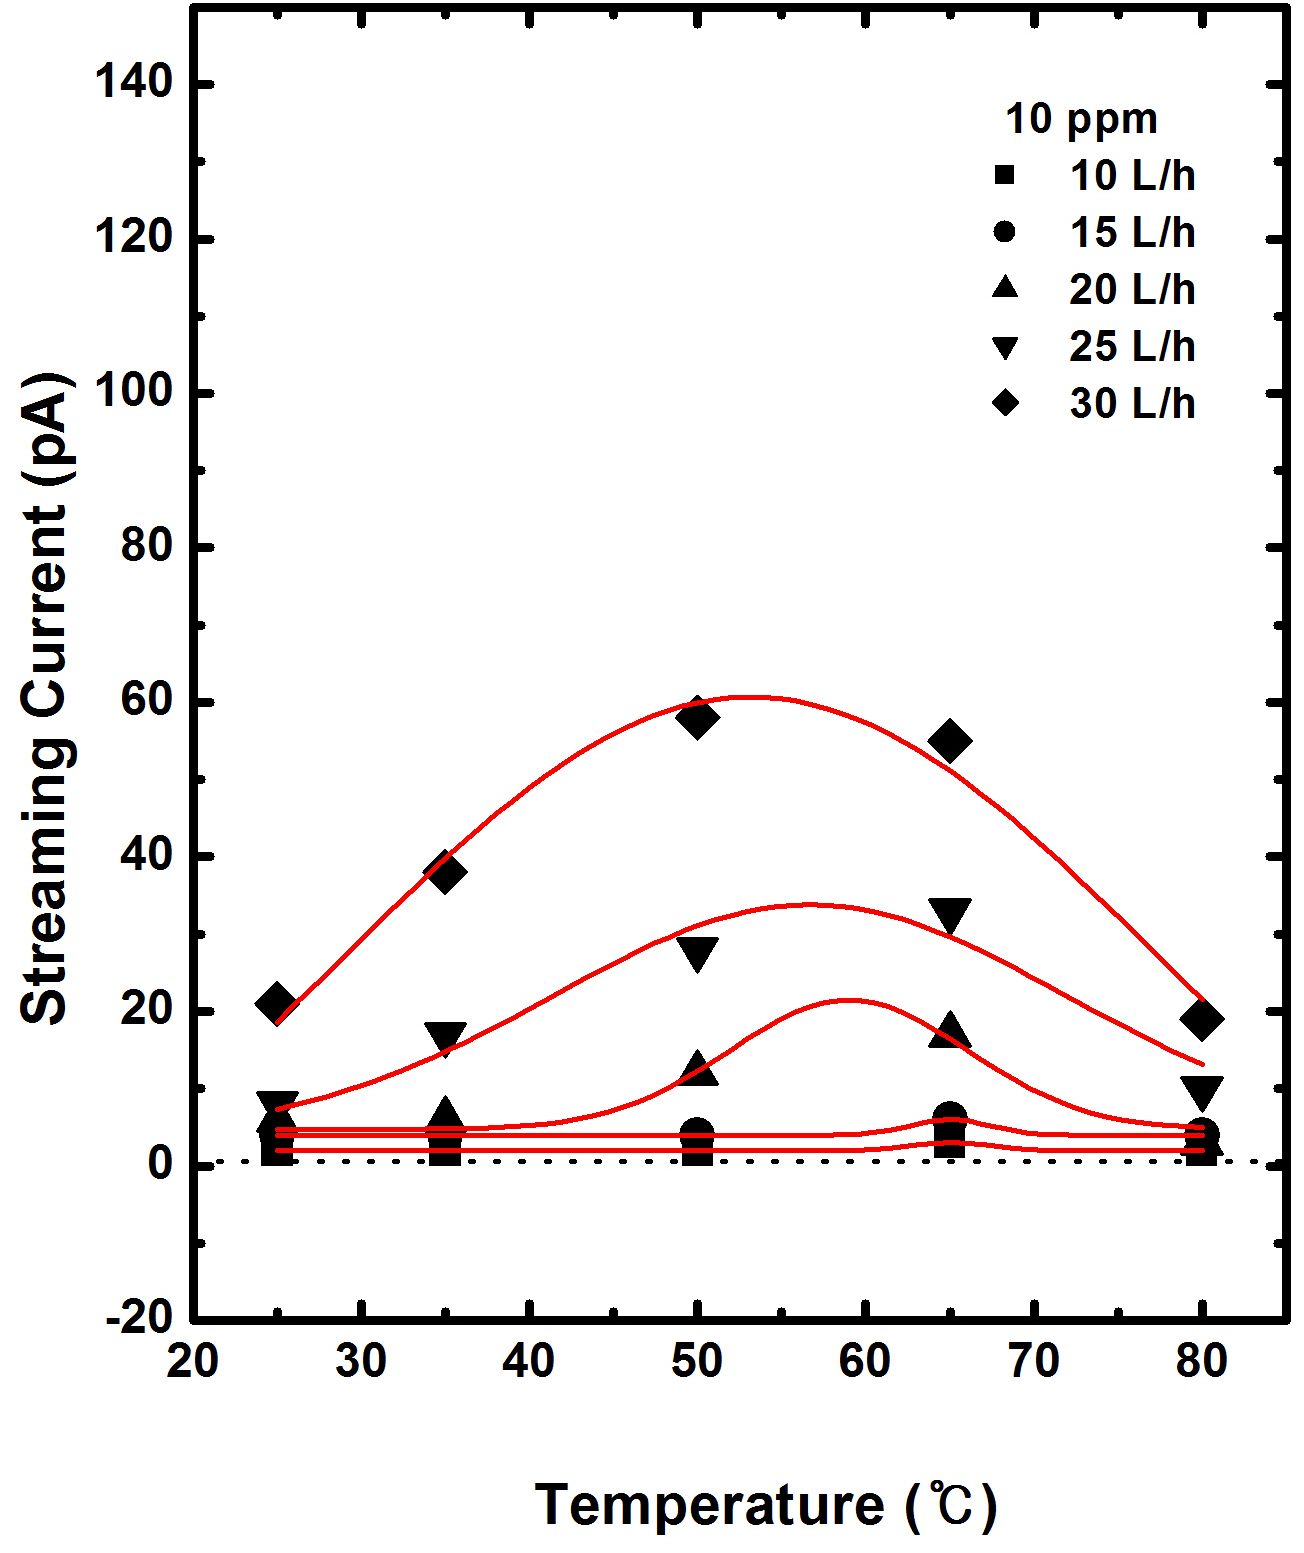
Figure 4 shows the temperature dependence of the streaming electrification current at flow rates ranging from 10 to 30 L/h from room temperature to 80℃, respectively.
At flow rates of 10 L/h and 15 L/h, the streaming electrification current was relatively constant because there was little change in the temperature and the amount of charge due to the flow rate. However, when the flow rate was increased to 20, 25 and 30 L/h,the maximum streaming current increased rapidly to 50, 82 and
155 pA, but the peak temperature was as low as 57, 54 and 50℃, respectively. The charges move rapidly at higher flow rates and more charge is generated at higher temperatures.
The flow rate has a large effect on the amount of charge. On the other hand, the charging current of the virgin specimen decreased rapidly with increasing temperature when the temperature was above 65℃. The conductivity increased with decreasing water solubility of the internal oil as a result of the increase in temperature and decrease in charge relaxation time [12-14].
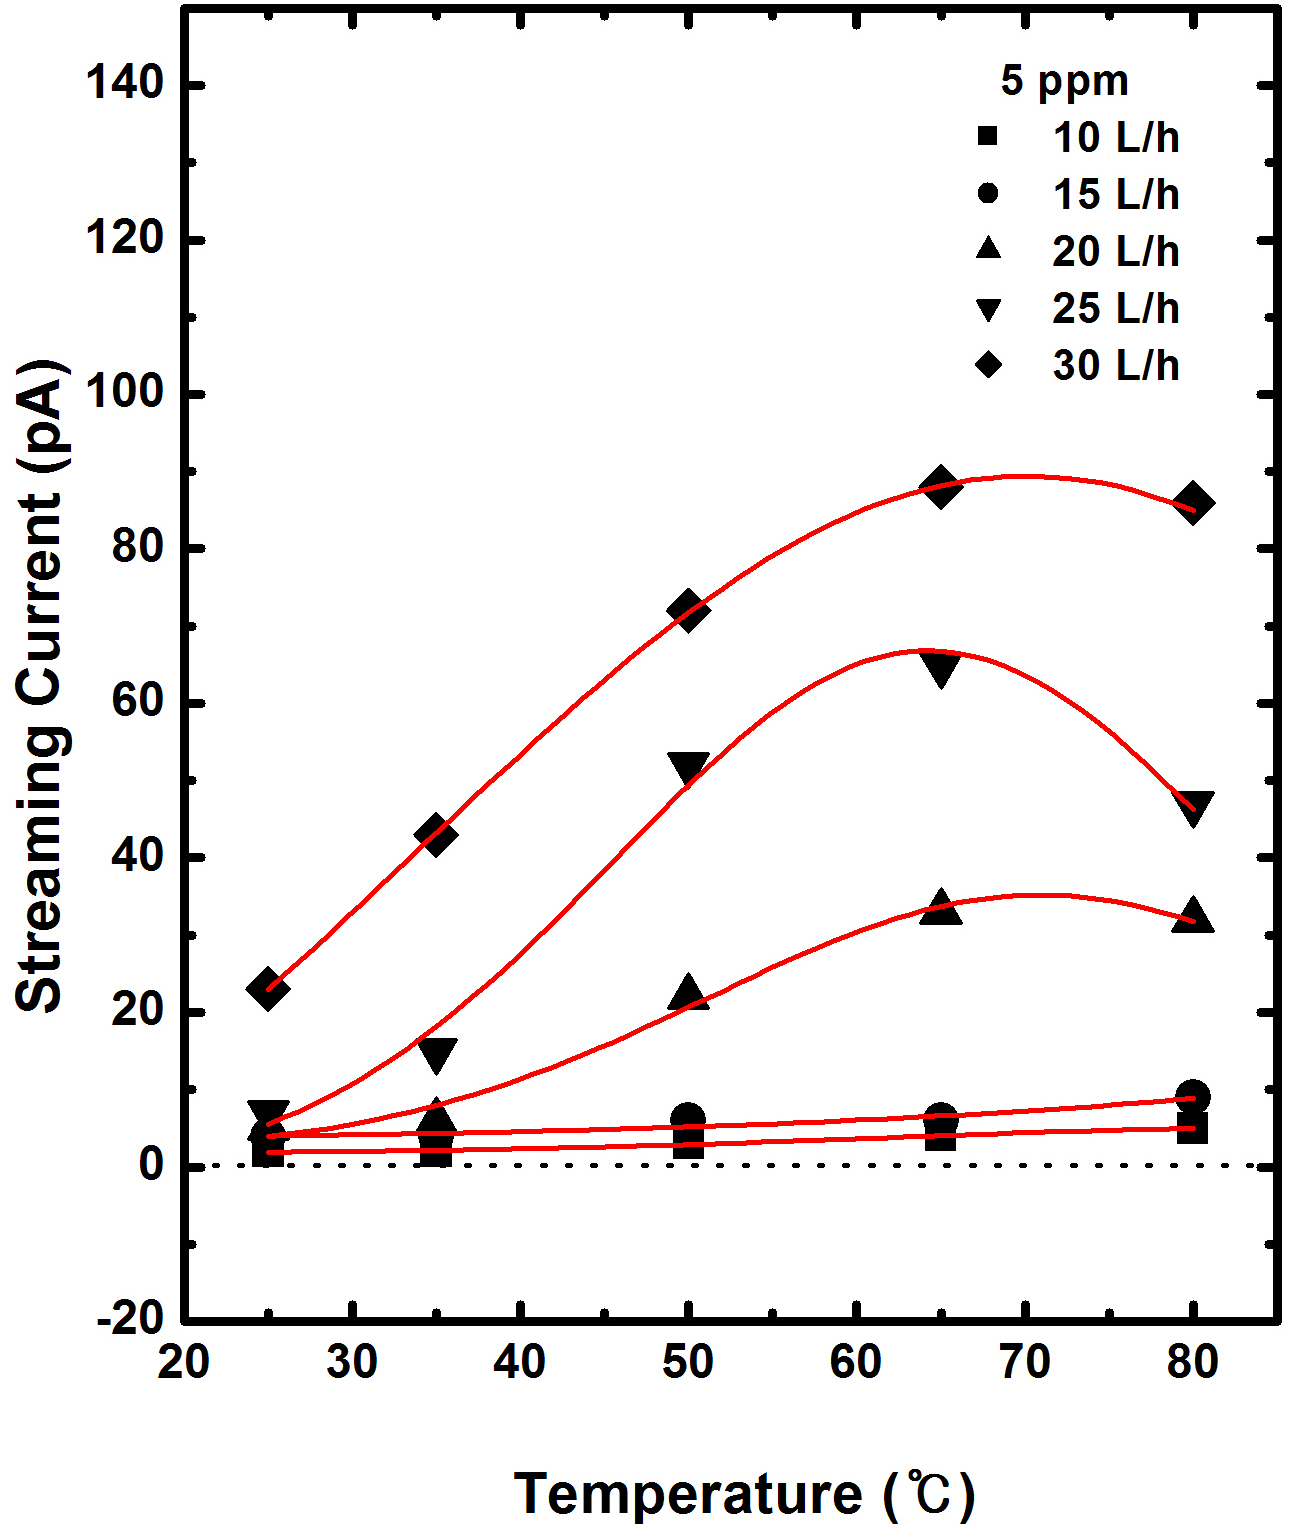
Figure 5 shows the temperature dependence of the transformer oil according to the change in flow rate at 5 ppm BTA. The results showed a similar trend to the virgin specimen at flow rates below 15 L/h. However, the charge current increased with increasing temperature at flow rates of 20 L/h but was approximately 58 % lower than that of the virgin specimen because the addition of BTA reduces the concentration of positive (+) ions generated by the charge phenomenon. The decrease in charge current after reaching a peak at a temperature of 65℃ was attributed to a decrease in the charge relaxation time similar to what happens with the virgin specimen.
Figure 6 shows that there was little change with 10 ppm of added BTA, which is similar to the virgin specimen and the specimen containing 5 ppm of BTA at flow rates below 15 L/h. However, at flow rates above 20 L/h, the charge current as a function of temperature was approximately 65% lower than that obtained with 5 ppm of added BTA. Moreover, the peak temperature of the charge current with increasing flow rate moved to a lower temperature. Therefore, it is believed that the increase in conductivity is due to a decrease in charge relaxation time.
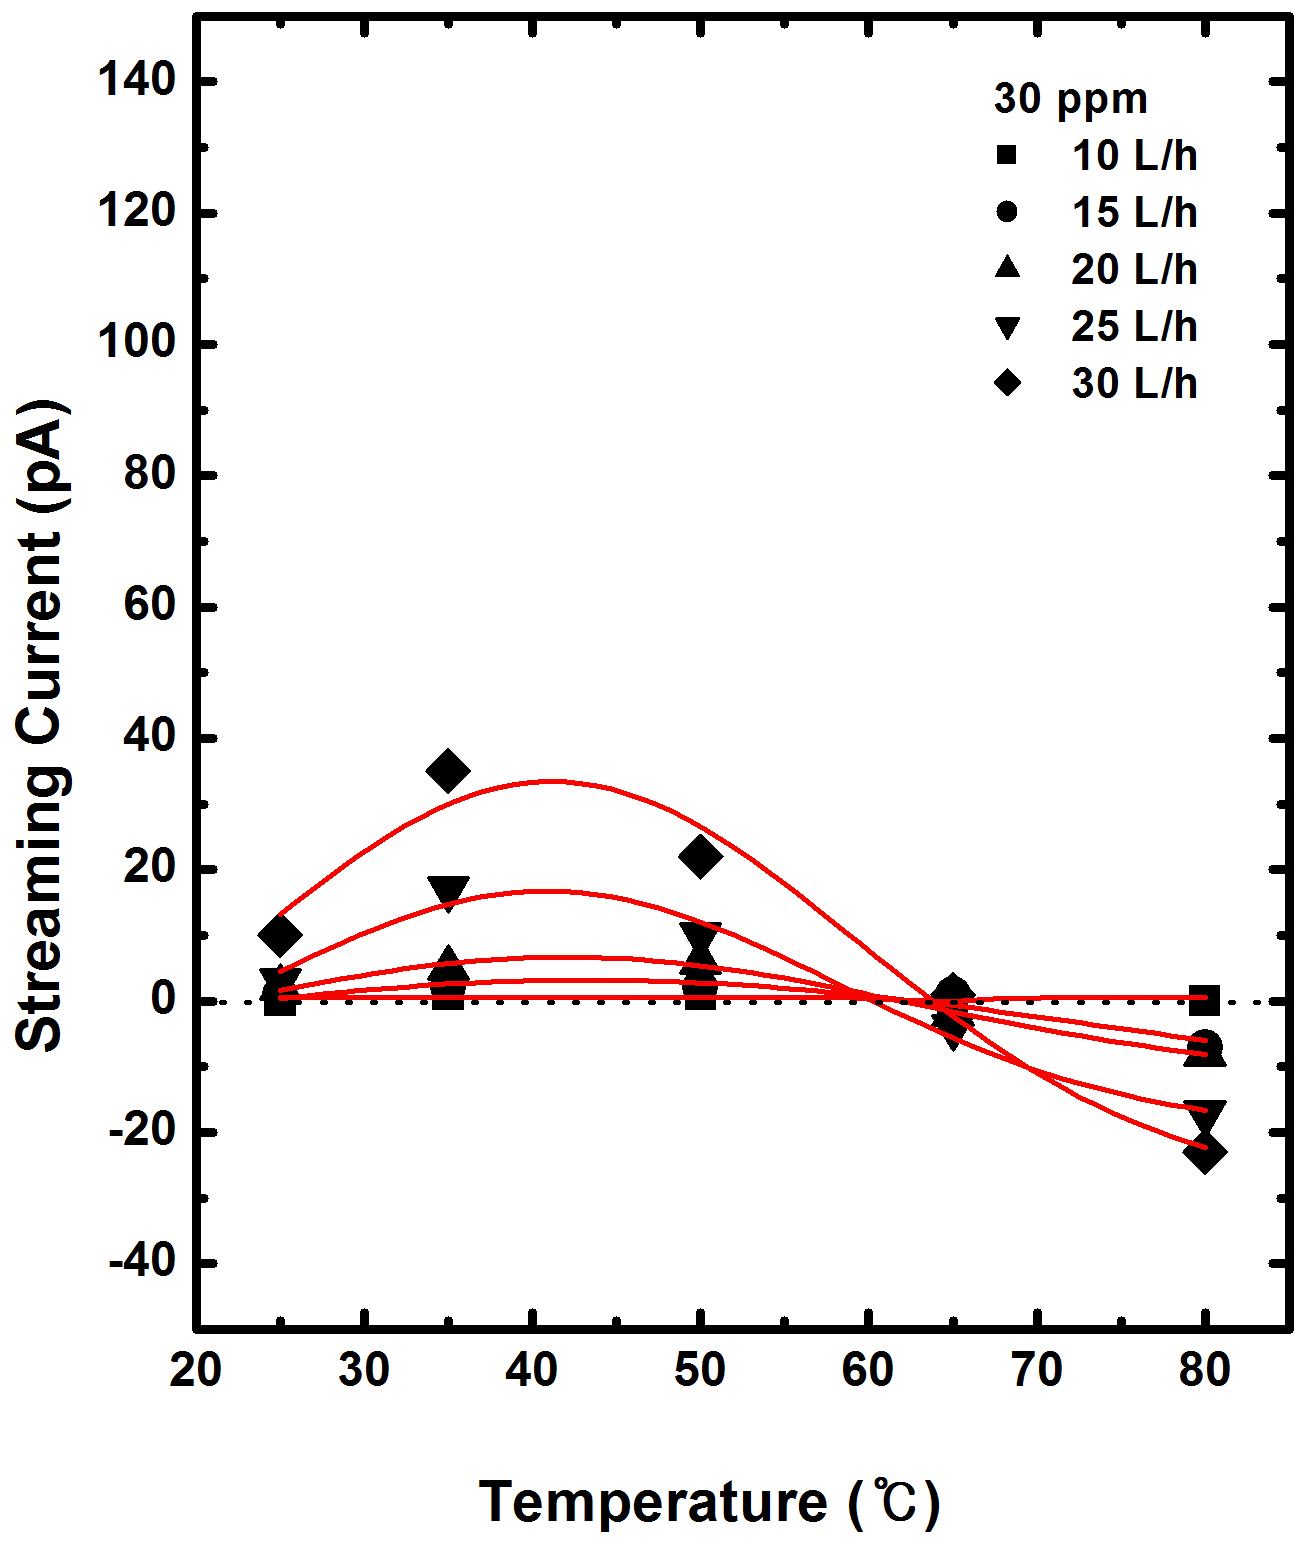
Figure 7 shows the temperature dependence of the streaming current of the specimen containing 30 ppm BTA. The amount of charge due to the change in flow at 40℃ was similar to the amount charge obtained with the previous specimen. On the other hand, the amount of charge decreased when the temperature was above 40℃. The charge current changed polarity from (+) to (-) at temperatures exceeding 65℃. When the measurement temperature was above 65℃, the amount of BTA increased because there was a larger amount of (-) ions than (+) ions generated due to streaming electrification, resulting in a (-) polarity [14,15].
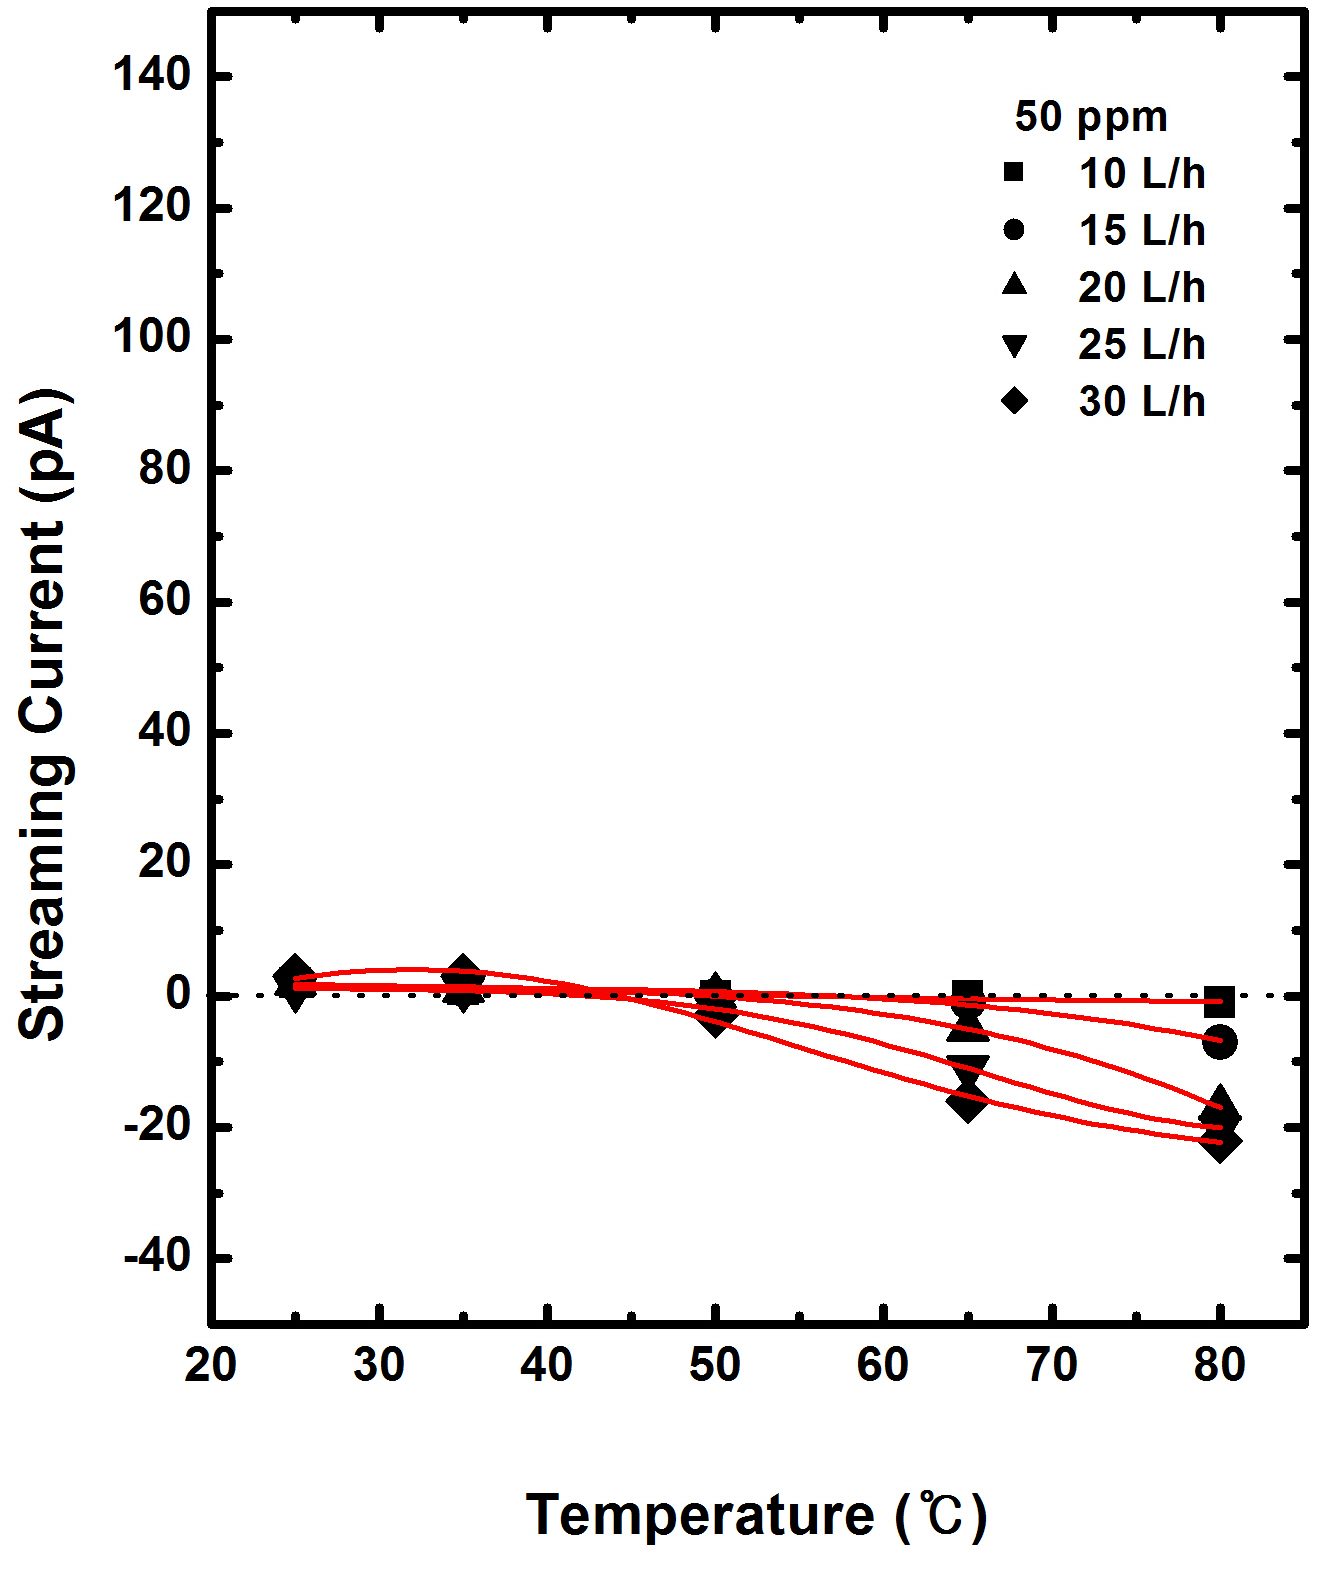
Figure 8 shows the temperature dependence of the streaming current at different flow rates in the transformer oil containing 50 ppm BTA. The streaming currents changed polarity to (-) at approximately 45℃, which is much lower than that observed in the transformer oil containing 30 ppm of BTA at 65℃, and also showed a inflection at a temperature of 45℃ in the (-) charge variation. It is believed that the action of the BTA is assisted by the flow rate and measurement temperature.
This study examined the effects of the amount of BTA addition on the flow rates and temperatures for streaming electrification of ultra-high voltage transformer oil
1) The FTIR peak intensity of the virgin specimen at 3,440~3,450 cm-1 was reduced by the addition of BTA.
2) No relationship between the temperature and BTA addition was observed at flow rates of 10 L/h and 15 L/h. However, the amount of charge increased rapidly with further increases in flow rate but the peak of the charge current decreased with increasing BTA content.
3) The virgin specimen and other specimens containing 5 ppm and 10 ppm of BTA showed a peak in the charge current at approximately 50~65℃. The charge current decreases rapidly at higher temperatures due to a decrease in the relaxation time of the specimen. The polarity changed from (-) to (+) at 65℃, where 30 ppm of BTA was added.
4) Overall, BTA affects the characteristics of streaming electrification in ultra-high voltage transformers oil with the addition of 10 ppm of BTA being the most effective amount for improvement of the characteristics of streaming electrification.