In this paper, we attempt to improve the electrical characteristics of epoxy resin at high temperature (above 80℃) by adding magnesium oxide (MgO), which has high thermal conductivity. Scanning electron microscopy (SEM) of the dispersion of specimens with added MgO reveals that they are evenly dispersed without concentration. The dielectric breakdown characteristics of SiO2 and MgO nanocomposites are tested by measurements at different temperatures to investigate the filler’s effect on the dielectric breakdown characteristics. The dielectric breakdown strength of specimens with added SiO2 decreases slowly below 80℃ (low temperature) but decreases rapidly above 80℃ (high temperature). However, the gradient of the dielectric breakdown strength of specimens with added MgO is slow at both low and high temperatures. The dielectric breakdown strength of specimens with 0.4 wt% SiO2 is the best among the specimens with added SiO2, and that of specimens with 3.0 wt% and 5.0 wt% MgO is the best among those with added MgO. Moreover, the dielectric strength of specimens with 3.0 wt% MgO at high temperatures is approximately 53.3% higher than that of specimens with added SiO2 at 100℃, and that of specimens with 5.0 wt% of MgO is approximately 59.34% higher under the same conditions. The dielectric strength of MgO is believed to be superior to that of SiO2 owing to enhanced thermal radiation because the thermal conductivity rate of MgO (approximately 42 W/m·K) is approximately 32 times higher than that of SiO2 (approximately 1.3 W/m·K). We also confirmed that the allowable breakdown strength of specimens with added MgO at 100℃ is within the error range when the breakdown probability of all specimens is 40%. A breakdown probability of up to 40% represents a stable dielectric strength in machinery and apparatus design.
Composite-material-based epoxy is the preferred insulating material for electrical appliances, circuit boards, bushings, gas insulated switchgear(GIS) spacers, and molding transformers. These composite materials have been studied by Tanaka et al.[1] and Nelson et al. [2], among many others, to improve their electrical and mechanical properties by introducing microand nanofillers. Nelson et al. [2] reported improved lifetimes of nanocomposite materials by comparing the withstand voltage and lifetime of materials with micro- and nanofillers. Tanaka et al. [1] and Imai et al. [3] reported improved dielectric strength in research on the dielectric strength of non-filled epoxy resin and nanocomposite materials. Recently, efforts to improve the electrical characteristics of epoxy have been made by adding inorganic oxides (e.g., TiO2, ZnO, Al2O3)[4,5]. However, many problems arise under an overload or in poor environmental conditions. Of these, the reduction in dielectric breakdown strength with increasing temperature is a very important concern. Materials with a high thermal conductivity rate must be chosen to address this problem. The thermal conductivity rate of the inorganic magnesium oxide (MgO) is approximately 42
W/m·K, which is approximately 32 times that of SiO2. MgO is reported to show excellent characteristics for the suppression of free and space charge when it is used as filler in high-voltage DC submarine cable insulation materials [6,7]. Therefore, in this paper, we attempt to improve the electrical properties of epoxy by adding MgO nanofiller to epoxy resin to improve its dielectric breakdown characteristics at high temperatures. In addition, the dielectric breakdown characteristics of SiO2 nanocomposite and MgO nanocomposite are compared and analyzed by measurements at different temperatures to investigate the influence of the filler on the dielectric breakdown properties.
The nanocomposites used in this experiment are produced by using bisphenol-A-type YD-128 (Kukdo. Co, Korea) epoxy resin, anhydride oxidative HN-2200 (Hitachi Chemical Co., Japan) hardener, and Aerosil 200 (Deggusa. Co, Germany); the average size of SiO2 is 12 nm, and that of MgO is 50 nm MgO (Nanostructured& Amorphous Materials. Inc, USA). Filler is added to the low-viscosity hardener to control the dispersion in the specimens.
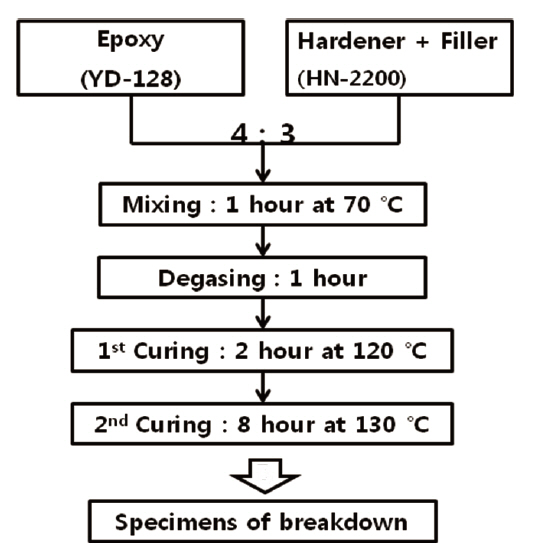
After the filler and the mixed hardener are stirred for an hour in an ultrasonic mixer, bubbles inside the specimens are removed, primarily in a vacuum chamber. The prepared hardener and the epoxy are mixed in a 4:3 weight ratio, after which they are stirred for an hour in the ultrasonic mixer and bubbles are removed again. Prepared liquid specimens are injected into a mold. After curing for 2 hours at 120℃ and a second curing of 8 hours at 130℃, specimens for dielectric breakdown analysis are produced. Figure 1 shows a block diagram of specimen preparation.
The dielectric breakdown of specimens with varying amounts of filler is measured using a breakdown voltage obtained by stepping up a commercial-frequency AC voltage by applying a ramp method with a rating voltage of 1 kV/s. Measurements are made at several different temperatures (25, 50, 80, and 100℃). Fifteen measurements were made under each set of conditions. The
average and standard deviation values are used to indicate the dielectric breakdown strength.
To investigate the physical properties and dielectric breakdown characteristics of the nanocomposite specimens, we examine the dispersion of the filler in the specimens by scanning electron microscopy (SEM) and conduct x-ray diffraction (XRD) analyses of the crystal construction and temperature dependence of the breakdown strength.
3.1 Scanning electron microscopy
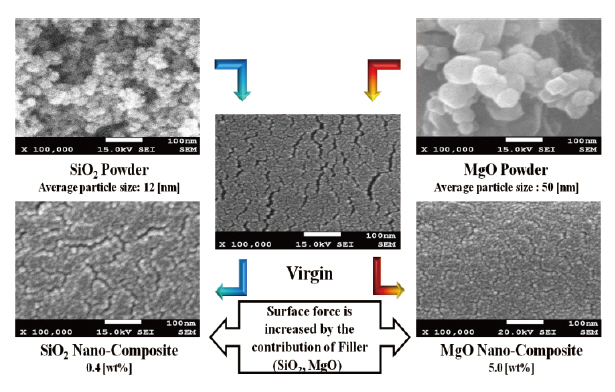
Figure 2 shows SEM images of the nano-MgO and nano-SiO2 filler powder. The changes in the filler are illustrated by showing a cross section of the epoxy resin specimens after they were cooled with liquid nitrogen and then cut; the captured MgO and SiO2 powder are also shown. The crystals are tens of nm in size. We confirmed that the filler particles are dispersed evenly by size without concentration. The cross section of virgin epoxy showed a creviced surface. However, specimens with added SiO2 or MgO experience increased surface force, so the additives filled in the crevices. It is found that all specimens are evenly dispersed. The particles are evenly dispersed in specimens with an added 1.0 wt% of filler, but because little MgO is added and the particles are widely spaced, carriers can move easily. The dielectric breakdown strength is expected to be low owing to the influence of the carriers. However, although the MgO particles are also evenly dispersed in the specimen with an added 5.0 wt%, the surface force is increased by the addition of the filler. As the interparticle distance is smaller, hindering the movement of carriers, the dielectric breakdown strength is expected to increase. However, because the surface force of the specimen with 10 wt% of filler added is decreased by the presence of the filler, particles are concentrated and act as impurities; thus, the dielectric breakdown strength is expected to decrease.
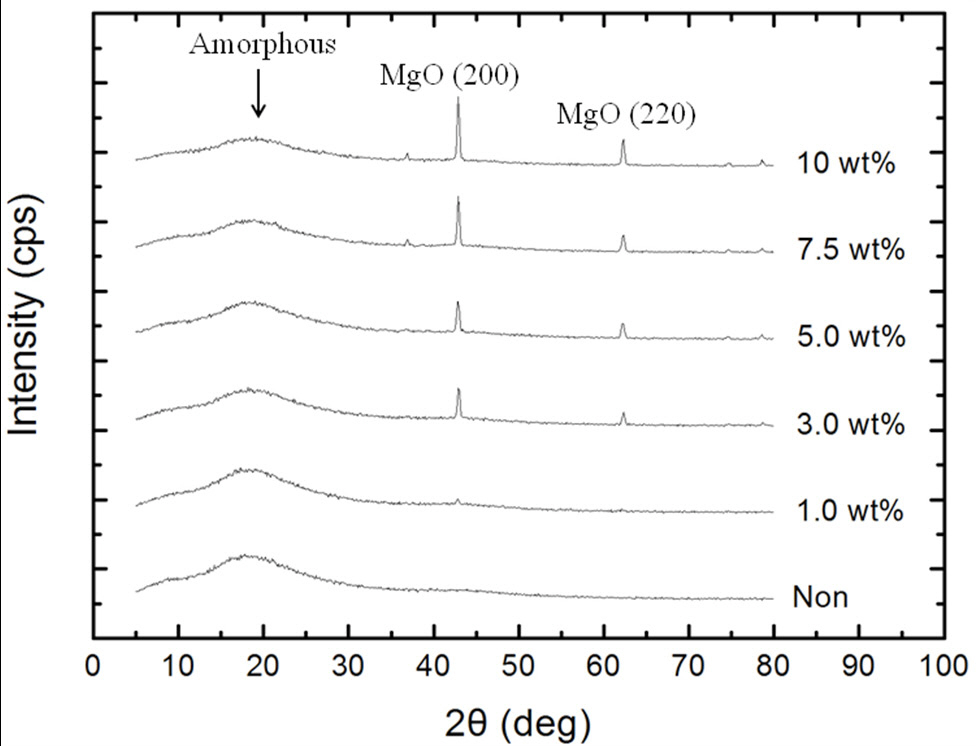
To investigate the crystal properties and amorphous structure of the specimens, XRD at a diffraction angle 2θ = 5~80° is conducted. Figure 3 shows the results for the specimens with added MgO (none and 1.0, 3.0, 5.0, 7.5, and 10 wt%). XRD revealed a slight peak between 2θ = 14~24° which is typical of an amorphous polymer. The amorphous peak decreases as the amount of MgO filler increases. The peak is attributed to a combination of the filler and the amorphous structure.
We confirmed that the sharp peak that appeared is the result
of diffraction by crystals or inorganic fillers.
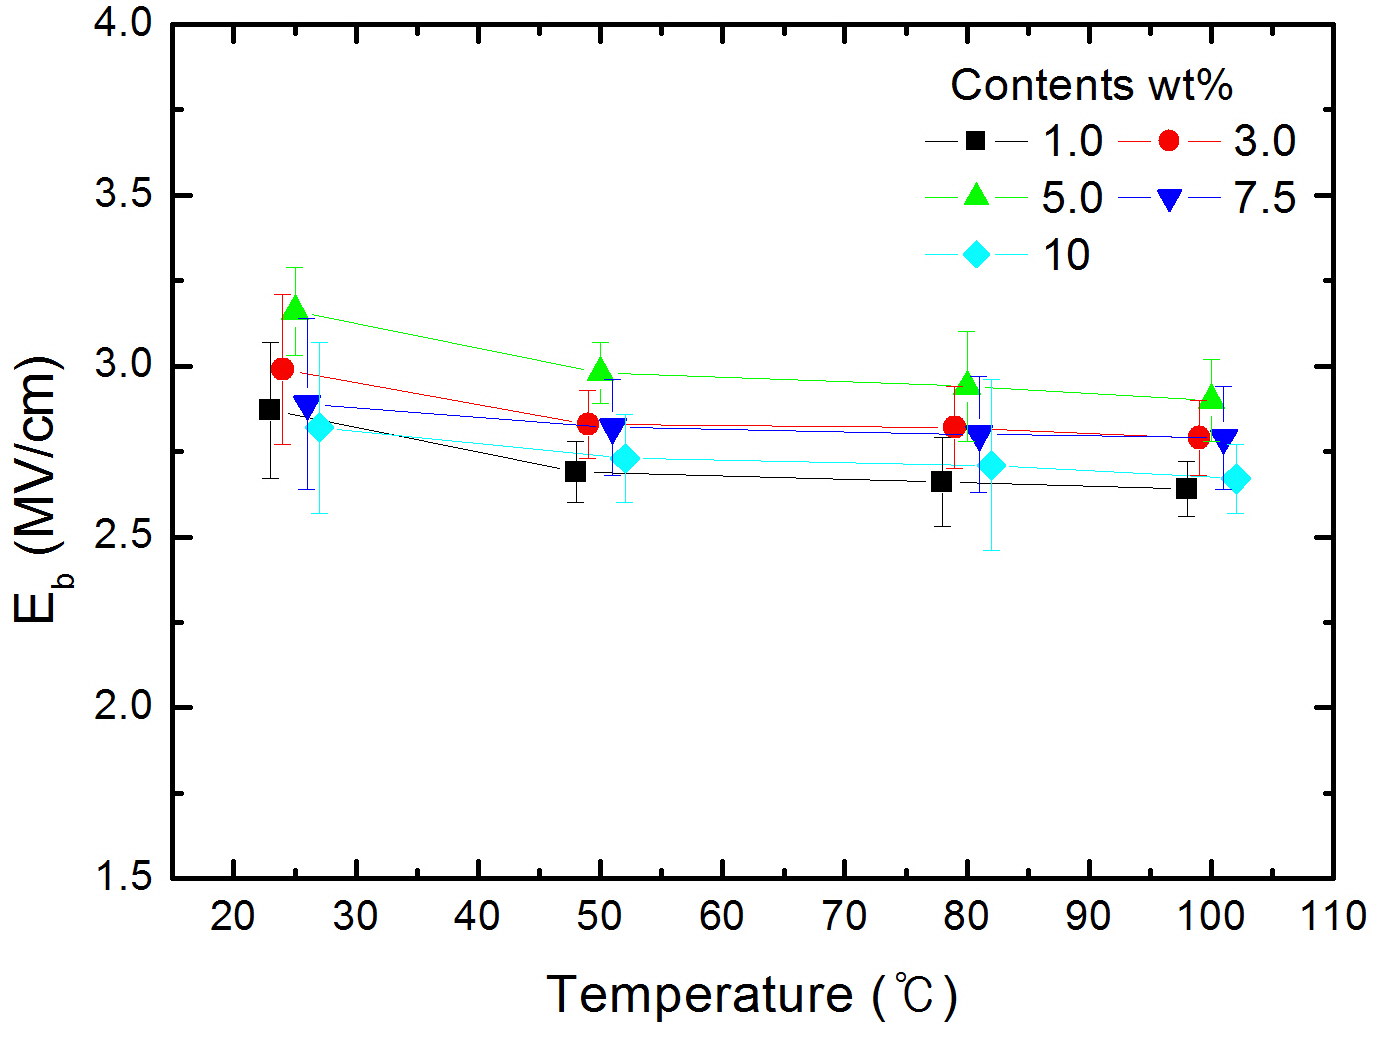
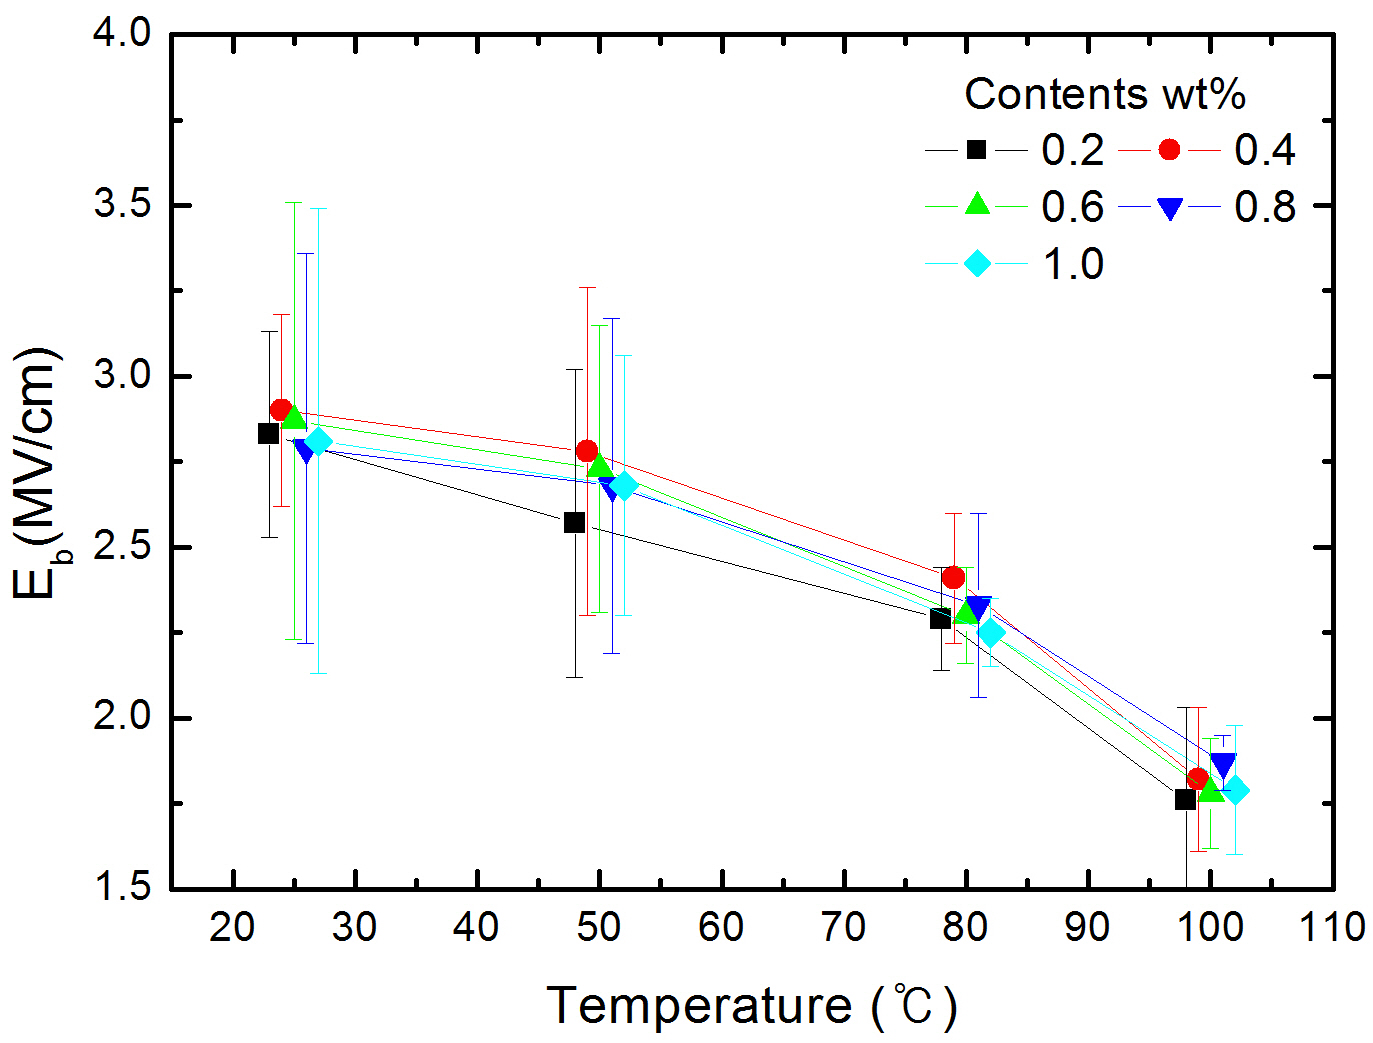
Figures 4 and 5 show the dielectric breakdown strength versus temperature for the specimens with added SiO2 and MgO, respectively. The temperature dependence of the dielectric breakdown characteristics is examined in two regions: a measurement temperature below 80℃ (the low-temperature region) and a temperature above 80℃ (the high-temperature region). The dielectric breakdown strength of specimens with added SiO2 decreases gradually in the low-temperature region and more sharply in the high-temperature region. By comparing the results for different amounts of filler, we find that the dielectric breakdown strength of specimens with 0.4 wt% of added SiO2 is excellent. The dielectric breakdown strength is approximately 59.34% less at 100℃ than at 25℃.
However, the dielectric breakdown strength of specimens with added MgO exhibits a slow gradient in the low- and hightemperature regions [8, 9]. The dielectric breakdown strength of specimens with 3.0 and 5.0 wt% of added MgO is excellent. That of the specimen with 3.0 wt% of added MgO is approximately 53.3% higher at 100℃ than that of the specimen with 0.4 wt% of added SiO2, and that of the specimen with 5.0 wt% of added MgO is approximately 59.34% higher at 100℃. The dielectric strength of an insulator generally decreases with increasing temperature. However, the dielectric strength of MgO is believed to be superior to that of SiO2 owing to the contribution of thermal radiation because the thermal conductivity rate of MgO (~42 W/m·K) is approximately 32 times higher than that of SiO2 (~1.3 W/ m·K).
[Table 1.] Allowable breakdown strength according to filler content (100℃).
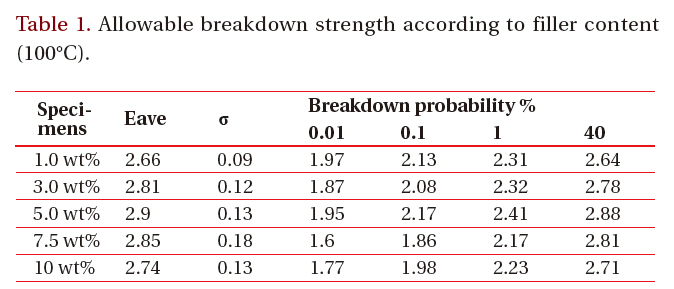
Allowable breakdown strength according to filler content (100℃).
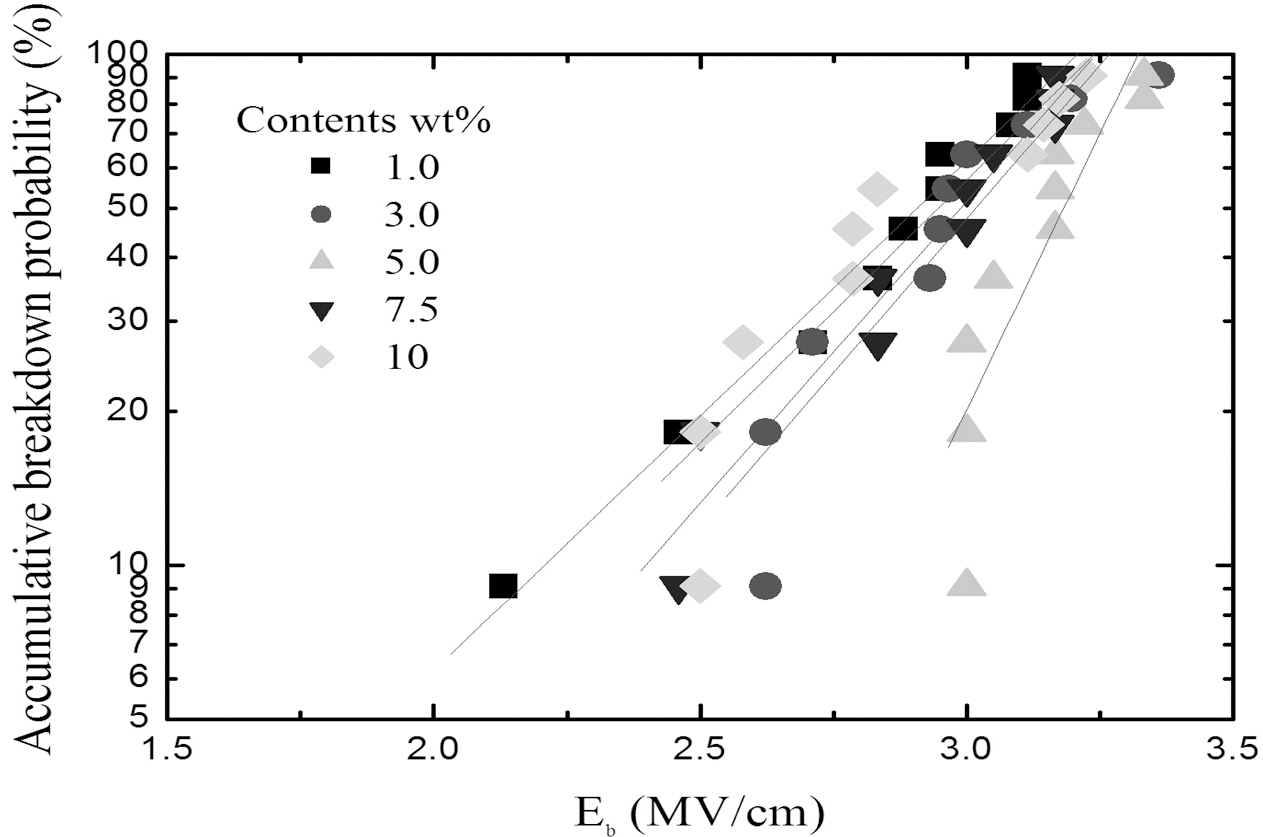
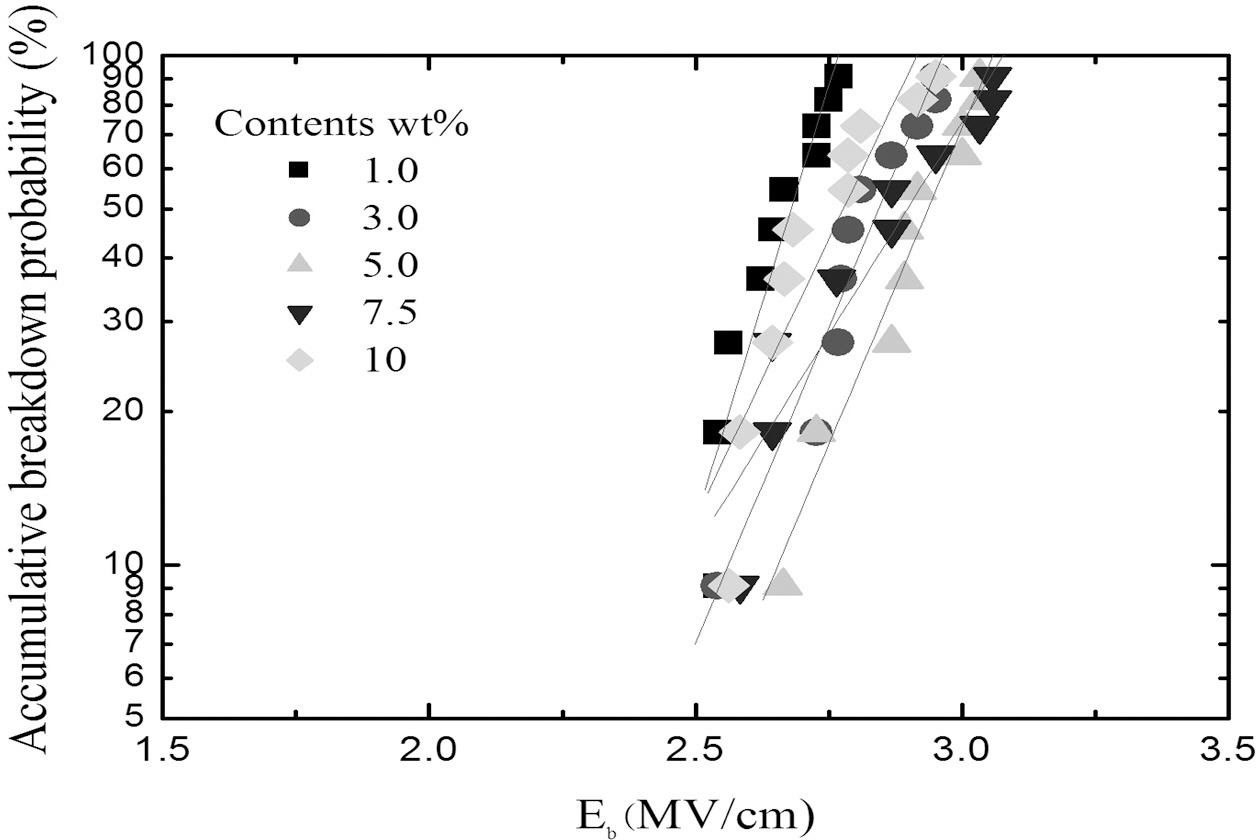
3.4 Weibull distribution of dielectric strength
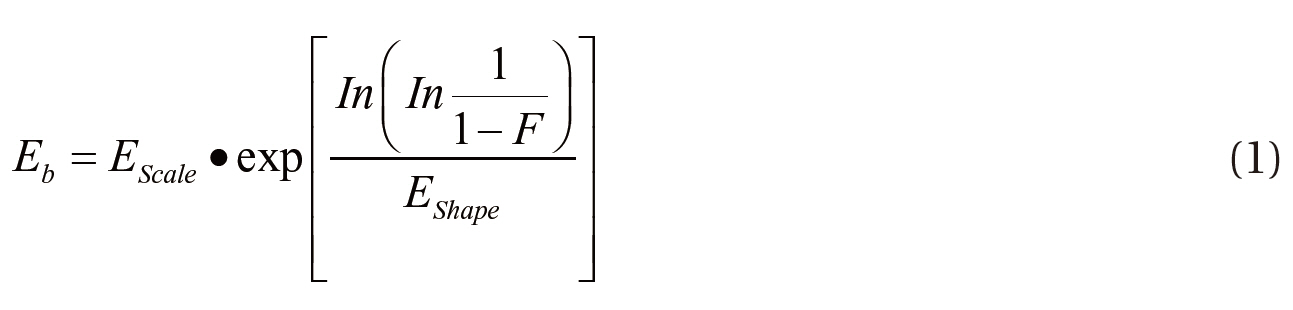
Table 1 shows the allowable breakdown strength for breakdown probabilities of 0.01, 0.1, 1, and 40%. The allowable breakdown strength is obtained by using the scale parameter (
When a breakdown probability of 40% is applied to all the specimens, the allowable breakdown strength was found to be within the error range.
Thus, a breakdown probability of up to 40% represents stability in machinery and apparatus design. If the breakdown probability increases out of the breakdown error range, problems with stability are expected to occur.
The scale parameter is the value of the dielectric breakdown strength when the cumulative probability is 63.2%. If the dielectric breakdown strength is above this value, the breakdown probability of the specimen increases [10]. Figures 6 and 7 show the scale parameter versus the MgO filler content at 25℃ and 100℃, respectively. The scale parameter is summarized in Table 2. If the amount of filler is increased at these temperatures, the scale parameter increases up to a content of 5.0 wt%. At higher contents, the scale parameter decreases. Moreover, as the measurement temperature increases, the deviation in the scale parameter decreases, similar to the reduction in the deviation that appears in the typical dielectric breakdown. Thus, the scale parameter tends to behave similarly to the dielectric breakdown strength.
[Table 2.] Scale parameter of specimens.
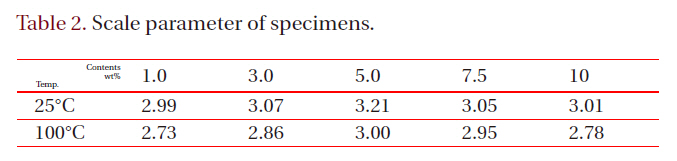
Scale parameter of specimens.
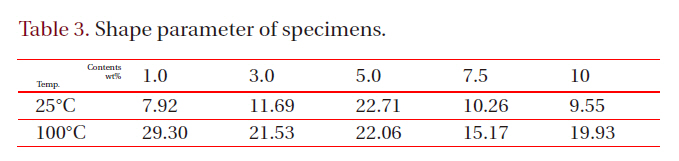
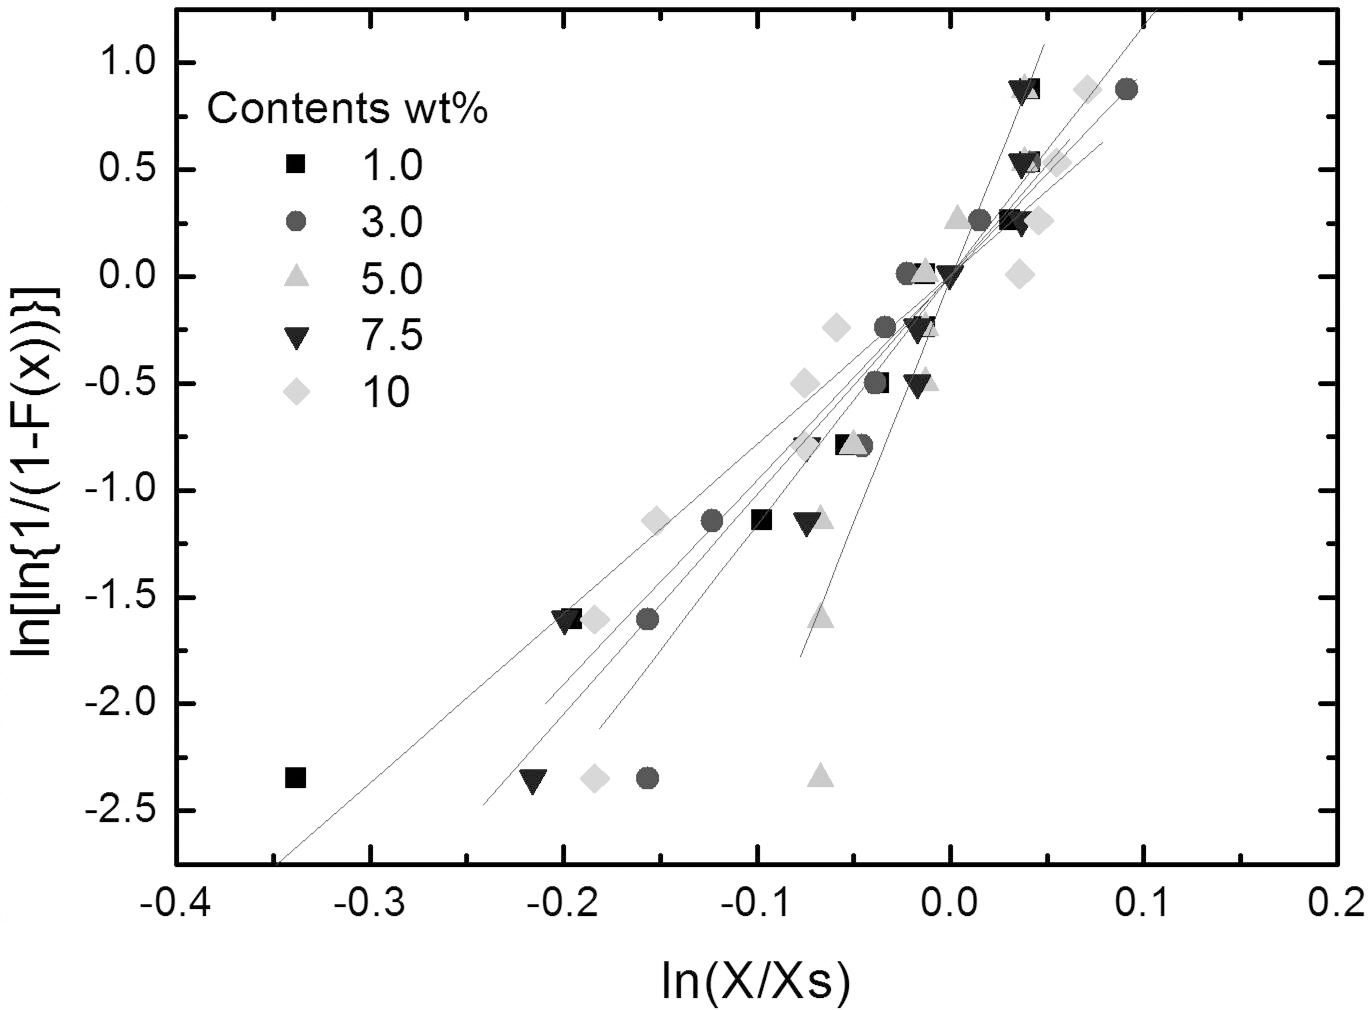
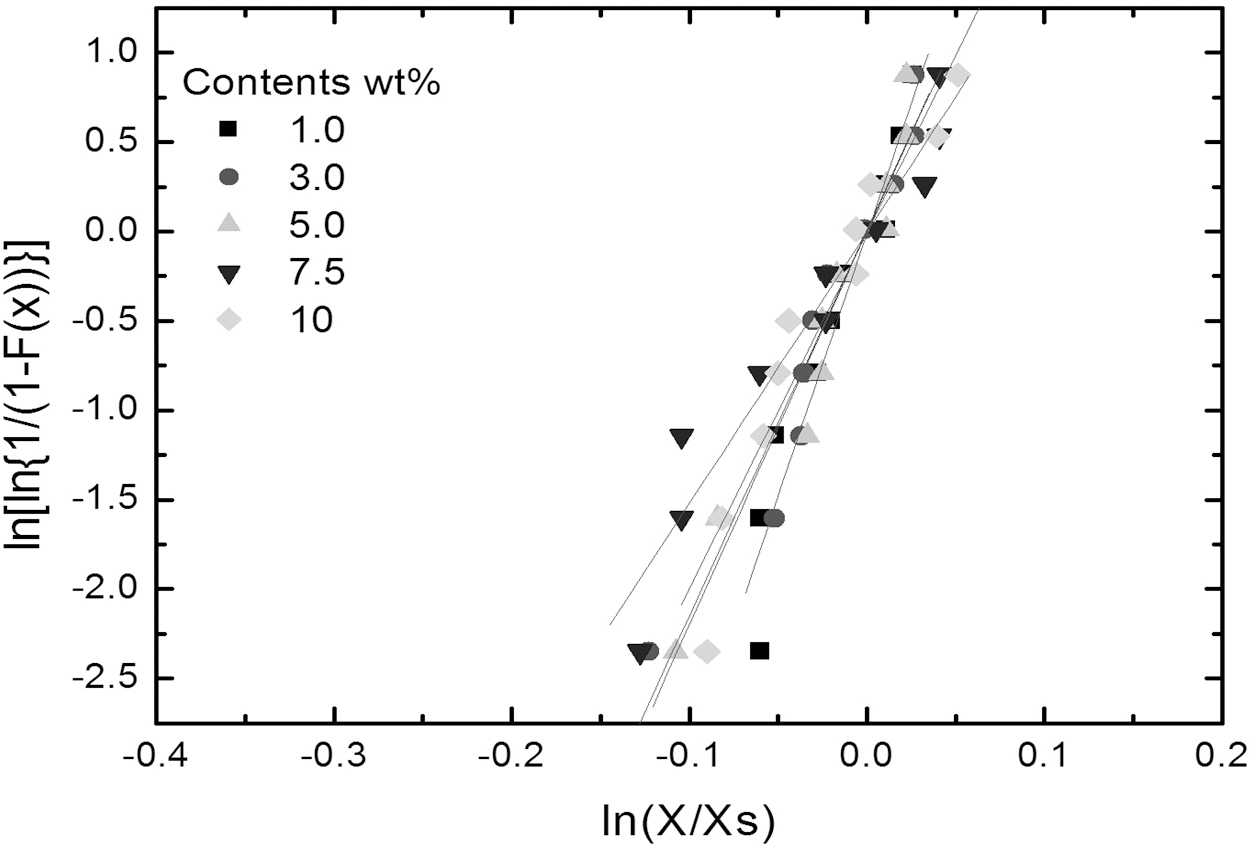
Figures 8 and 9 show the shape parameter (EShape) corresponding to the gradient of the optimization equations by using the Weibull plot. The shape parameter is summarized in Table 3. The normalized shape parameter of all specimens was 4 or more, and that of the specimens with an added 1.0 wt% of filler increased by approximately 270% as the temperature increased from 25℃ to 100℃. This represents the largest increase among the specimens. With this increase in the measurement temperature, the shape parameter increased and its distribution became narrow.
The dielectric breakdown increased with the measurement temperature, which tends to be similar to the decrease in deviation
We examined the electrical characteristics of MgO nanocomposite materials by physical property analysis and dielectric breakdown experiments; we obtained the following results.
With 3.0 wt% of added MgO is approximately 53.3% higher at 100℃, and that of specimens with 5.0 wt% of added MgO is approximately 59.34% higher at 100℃. We confirmed that when a breakdown probability standard of 40% is applied to all the specimens, the allowable breakdown strength is within the error range. Thus, a breakdown probability of up to 40% represents
[Table 3.] Shape parameter of specimens.

Shape parameter of specimens.
stability in machinery and apparatus design. If the breakdown probability increases out of the breakdown error range, problems with stability are expected to occur. The value of the scale parameter increases with filler content up to a content of 5.0 wt% at a particular measurement temperature and decreases at higher contents. The results show that the scale parameter tends to behave similarly to the dielectric breakdown strength. The normalized shape parameter of all specimens was 4 or more,and that of specimens with 1.0 wt% of added filler was approximately 270% higher at 100℃ than at 25℃, which represents the largest increase among the specimens. With this increase in the measurement temperature, the value of the shape parameter increased, and the distribution became narrow. We confirmed that the dielectric breakdown increased with measurement temperature, which tends to be similar to the deviation decrease.


![Weibull plot of ln(X/Xs) vs. ln[ln{1/(1-F(x))}] at 25℃.](http://oak.go.kr/repository/journal/10327/E1TEAO_2010_v11n6_261_f008.jpg)
![Weibull plot of ln(X/Xs) vs. ln[ln{1/(1-F(x))}] at 100℃.](http://oak.go.kr/repository/journal/10327/E1TEAO_2010_v11n6_261_f009.jpg)