The oxygen transfer rate is a parameter that characterizes the gas-liquid mass transfer in surface aerators. Gas-liquid transfer mechanisms in surface aeration tanks depend on two different extreme lengths of time; namely, macromixing and micromixing. Small scale mixing close to the molecular level is referred to as micromixing; whereas, macromixing refers to mixing on a large scale. Using experimental data and numerical simulations, macro- and micro-scale parameters describing the two extreme time scales were investigated. A scale up equation to simulate the oxygen transfer rate with micromixing times was developed in geometrically similar baffled surface aerators.
Surface aeration is an important operation in chemical and other processing industries. Surface aeration is defined as the aeration or oxygen transfer that takes place at the gas-liquid surface when the liquid is agitated. The objective of studying aeration process was to interpret the laboratory result for the development of a field installation. This requires a geometrical similarity condition; that is to say the field installation should be built on a definite geometric ratio to that of the laboratory setup. Under a geometric similarity condition, an effective scaleup mandates an awareness of the relative importance of various process parameters at different levels of scrutiny.
Inside a surface aeration tank, different scales of mixing are present, with regions where one of the scales of mixing will prevail, i.e., either macromixing or micromixing. Macromixing is mixing driven by the largest scales of motion in the fluid. Micromixing prevails near the impeller; where small eddies define the velocity gradients surrounding the bubbles. According to Kolmogorov’s theory, the power per unit volume determines the energy and size of the turbulent eddies, which has traditionally been used in the design and scale up of equipment [1-4].
Macromixing prevails adjacent to the micromixing region,which determines the internal homogenization, movement of bubbles across the reactor and flow pattern when the turbulent eddies are tank-sized. The contribution of the surface aeration of a tank, as well as the effect of the geometry of the impeller and the tank to the mass transfer the depend on this scale of mixing [1, 4-8].
Unlike macromixing, which is associated with large-scale fluid motions that can be monitored directly through physical property measurements, micromixing deals with diffusive mixing at the molecular level, for which only indirect methods are available. Despite the availability of much literature on the mixing length scale, mixing scale behavior of surface aerators is typically missing. Recently, Rao and Kumar [9] studied the micromixing behaviors of unbaffled surface aerators. However, baffled type surface aeration systems are mostly preferred in the mixing and chemical industry. Baffles are flat vertical strips set radially along the tank wall, which avoid vortex formation. A baffled tank provides a better concentration distribution throughout the tank and; therefore, improved mixing efficiency is achieved.
Thus, this study aimed to understand the prevalent mixing scale in baffled circular surface aeration systems and obtain scale-up or simulation equations for different mixing scales.
The rate of oxygen transfer depends on the mixing of the liquid in a tank [10-13] and; consequently, both scales of mixing must be considered. The contribution of each scale depends on the internal geometric configuration of the tank.
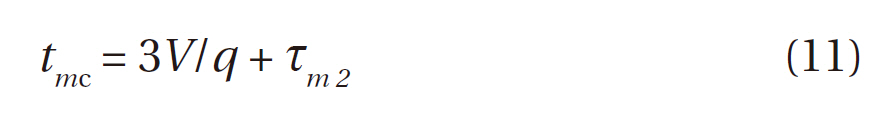
For a process conducted in a stirred tank, the largest scale of mixing is the scale of the whole reactor. Macromixing refers to flow processes that control the mean concentration and the residence time distribution, i.e., the mean convective flow in the vessel. Macromixing can be characterized by the circulation time,
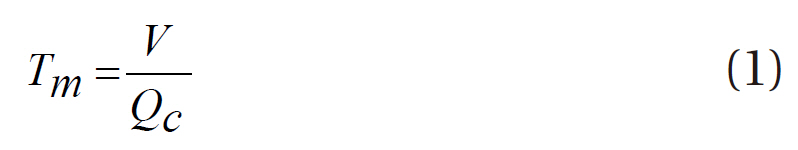
where
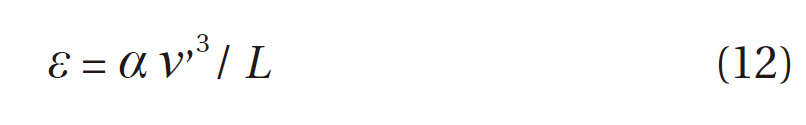
Small scale mixing in liquids is driven by the mechanism of viscous-convective deformation of fluid elements, followed by molecular diffusion. An important feature of micromixing is the accelerating effect of viscous-convective deformation on molecular diffusion. The micromixing time,
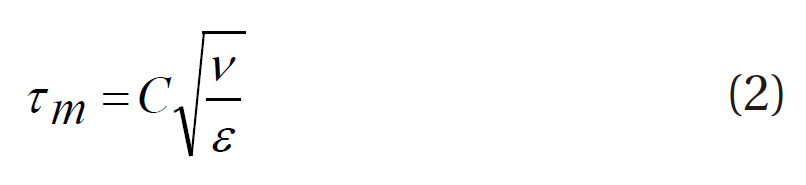
where C is a constant, the dissipation rate of turbulent kinetic energy and the kinematic viscosity.
2.4. Dissipation Rate of Turbulent Kinetic Energy, ε
A characteristic feature of turbulent flow is the presence of a wide range of eddy sizes, ranging from the flow domain, i.e., integral scale eddies, to smaller sizes, i.e., Kolmogorov scale eddies[16]. The large eddies are unstable, interact with each other and the boundaries of the flow, break down into multiple smaller eddies and; thus, transfer their energy to them. First, this transfer is efficient and very little kinetic energy is lost [16]. When the eddies become small enough, in the order of Kolmogorov scale in size, the eddy motion is stable, viscosity takes over and the energy is damped out and converted into heat. This process is usually described as a turbulence cascade, where energy continually flows from a larger to smaller eddies and; on the smallest eddy scale, an ultimate sink of energy is caused by viscous dissipation. This conversion of energy can be quantified using the kinetic turbulent energy dissipation rate, ε. Kresta and Wood [17] investigated the turbulence quantities in a stirred vessel,with the emphasis on energy dissipation. It is assumed that the bulk of the energy is contained in the largest eddies, the flow is in local equilibrium and the flux of energy towards smaller scales is constant. Zhou and Kresta [18] used a dimensional argument and found that most of the total energy was dissipated in the vicinity of the impeller discharge. The direct measurement of ε is very difficult, since it needs to precisely capture the smallest turbulent structures [19].
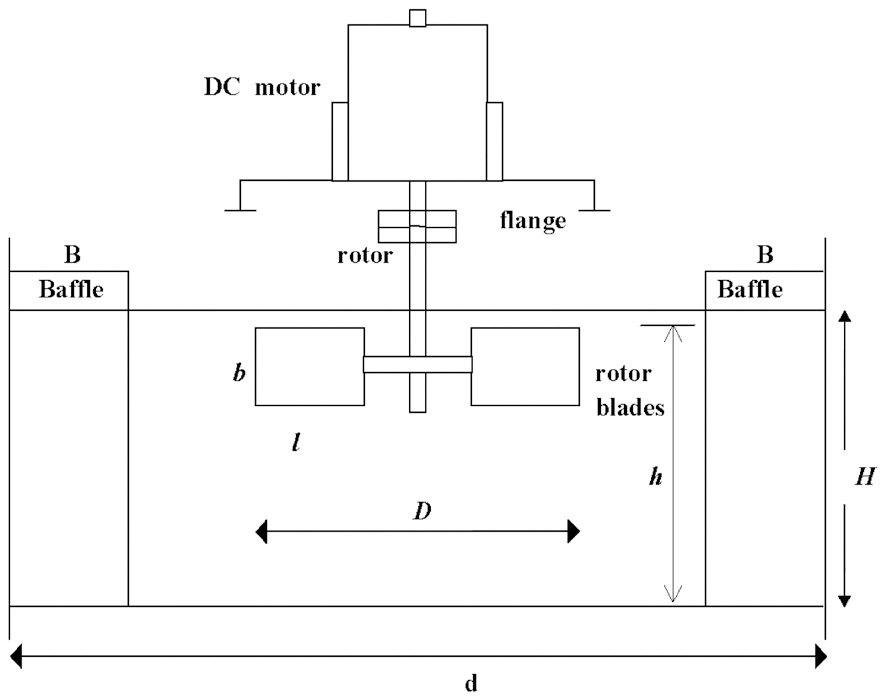
Experimental measurements of the oxygen transfer rate were performed in baffled surface aerators [20], with numerical schemes adopted to calculate the different time scales of mixing.The cross-sectional areas of the tanks tested were A=1 and
0.5184 m2. A schematic view of the aerator is shown in Fig. 1.
The following geometric similarity conditions were maintained in the baffled surface aeration systems:
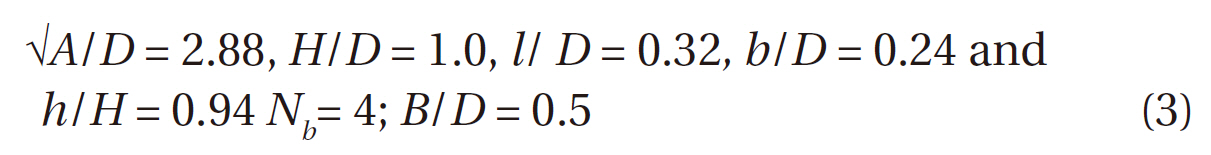
where
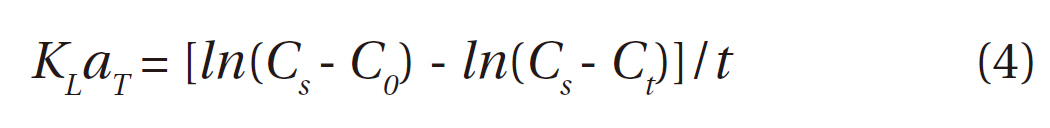
where
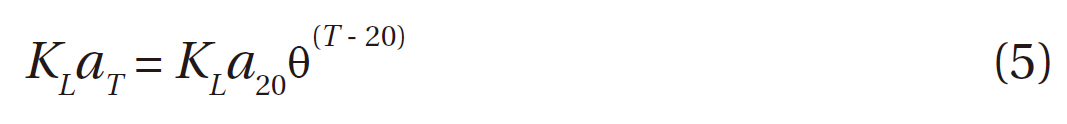
where θ is the temperature coefficient equal to 1.024 for pure water [22]. With known DO concentration (
Small-scale properties, especially turbulence characteris-
tics, on which the micromixing time depends, play key roles in many mixing applications. The measurement of such small scale properties is difficult and requires specialized equipment not typically available in industrial laboratories and at pilot plants. In the present work, these small scale properties of surface aeration systems were calculated using the commercially available software, Visimix® [23]. The Visimix® [23] program can be helpful in analyzing the mixing parameters in a stirred tank [24-26], and for investigating different scenarios for scale up and changes to the rotor and vessel configurations. For calculation of the macromixing time, Visimix® [23] considers two zones in the tank, depending on the agitator position. The two zones are the parts of the tank volume above and below the agitator, with differing axial flow directions. Macromixing in each of the zones occurs as a result of simultaneous convection and turbulent (eddy) diffusion. The exchange between the zones is; furthermore, assumed to be a result of the radial velocity. Estimation of the micro-mixing time is based on Kolmogorov’s hypothesis of local microscale turbulence. Kolmogorov’s hypothesis of local microscale turbulence is based on a simplified analysis of the transport and dissipation of the kinetic energy of turbulence. For its calculation, Visimix® [23] first calculates the dissipation rates of the kinetic energy, followed by the micromixing time. The calculation procedures are described as follows:
The mean value of the kinetic energy of turbulence,
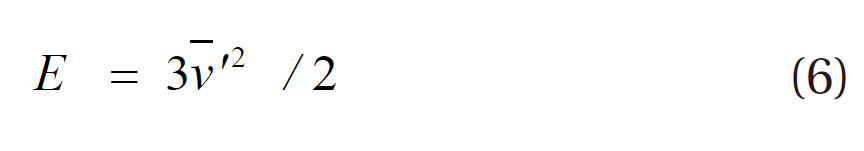
where v is the mean square root velocity of turbulent pulsations corresponding to the largest local linear scale of turbulence.Steady-state transport of the turbulent component of kinetic energy can be described as:
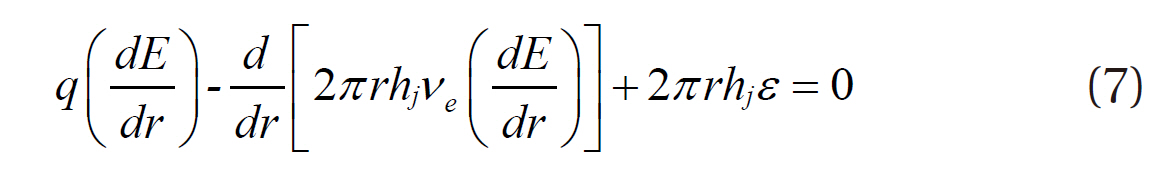
where
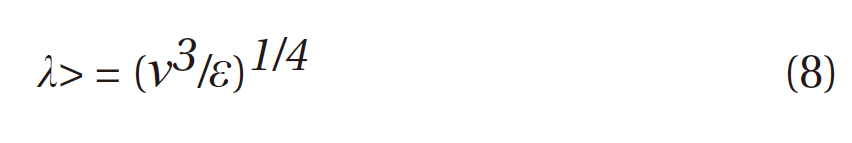
Inside such elements, as well as smaller elements, the mixing is mainly caused by molecular diffusivity. In a mixing tank, two characteristic values of the scale, λ, exist:
1) Maximum micro-scale, λbulk for the bulk of the flow estimated according to Equation (8), with the average turbulent dissipation value in the bulk estimated as:
where λbulk is the linear scale of the turbulence in the bulk volume and
2) Minimum micro-scale, λm for the area with the highest local dissipation,
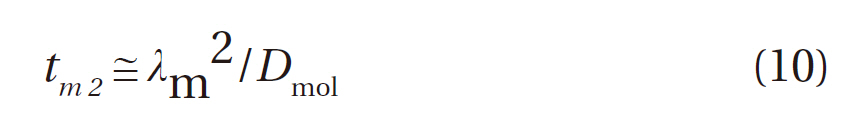
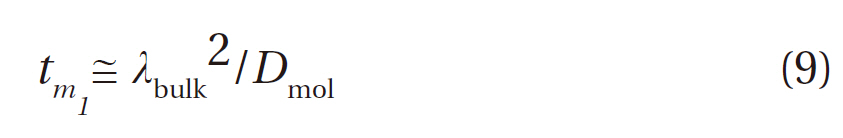
The liquid medium in the bulk of the flow is “micromixed” within time
Thus, there are two independent estimates of the micro-mixing time:
In this section, experimental and numerical results obtained by Visimix® [23] for the macro and micromixing times were analyzed in order to present simulation equations for them both in geometrically similar surface aeration systems.
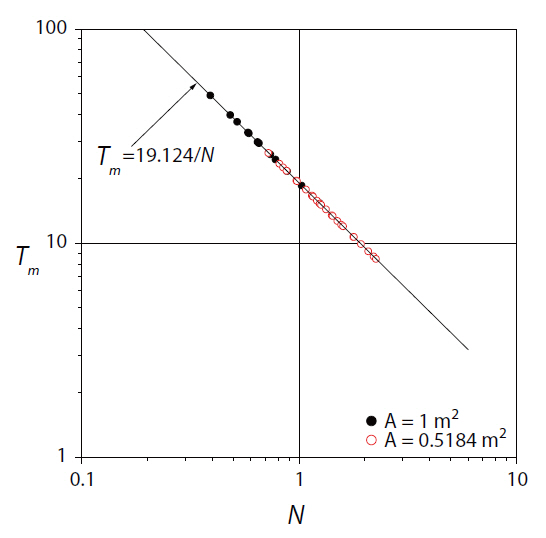
As previously discussed, macromixing is mixing driven by the largest scales of motion in the fluid, and is characterized by the blend time in a batch system. On reanalyzing Equation (1), it was found that
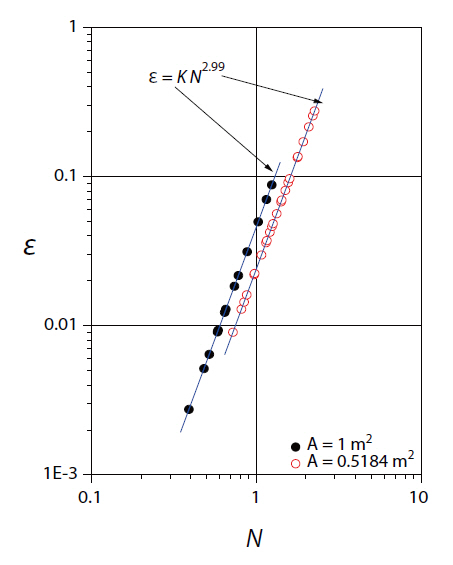
3.2. Energy Dissipation Rate (ε)
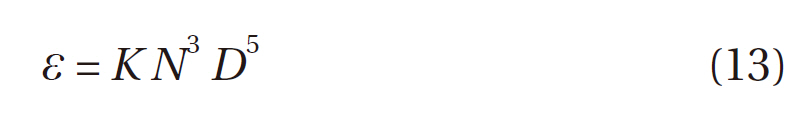
According to the dimensional analysis, the energy dissipation rate is given by [27]:
where α is a constant,
where
As shown in Fig. 3, regression lines were drawn between the simulated energy dissipation rates and rotational speeds for different sized surface aerators, giving the regression equations:
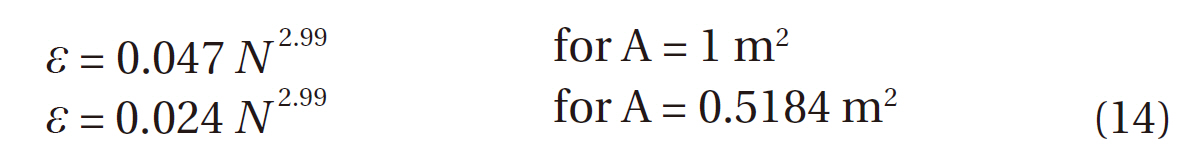
The correlation for the data using Equation (14) gave a regression coefficient of 0.99. The exponent on the N-term in Equation (14) was very close to the theoretically derived value of 3.
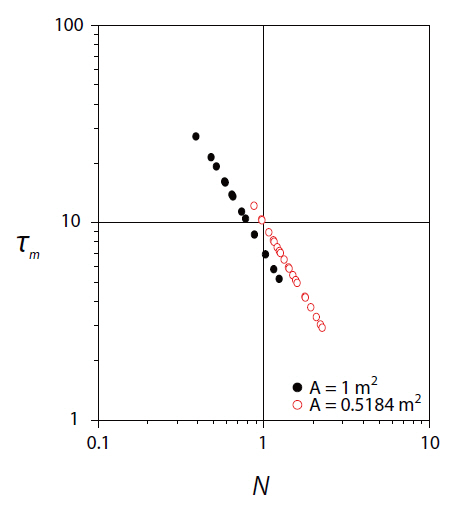
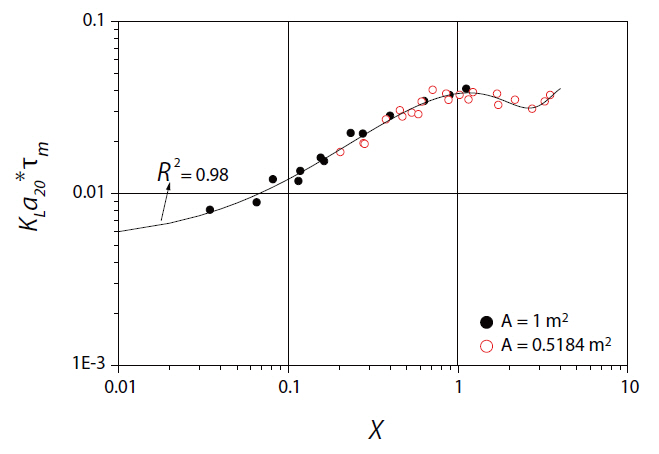
Micromixing is the rate limiting step in the progress of fast reactions,because micromixing dramatically accelerates the rate of production of the interfacial area available for diffusion. The micromixing time can provide useful information on the performance of surface aeration tanks, and takes into consideration the small eddies responsible for the surrounding concentration gradients. The numerical data obtained for the micromixing time were plotted, as shown in the Fig. 4, with respect to the rotor speed, as in the case of macromixing time.
As indicated in Fig. 4, scale effects predominated in the micromixing scale up with rotor speed. The theoretical power per unit volume parameter, X, is a very powerful parameter dealing with agitation, which can be used in scaling up stirred tanks [29,30]. X has been defined as X =
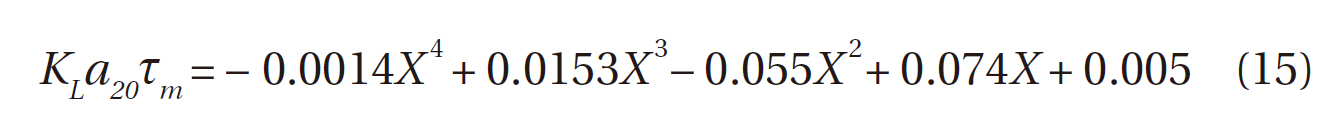
The above equation was valid between the experimental ranges covered in the present paper, i.e., 0.01
Every mixing scale will have a particular effect on the rate of oxygen transfer. Macromixing was found to account for the geometrical configuration of the surface aerator. Micromixing occurred due to turbulent diffusion between small cells in the fluid, which caused the intermingling of molecules. In the present work, simulation equations for the macro and micromixing times in the surface aeration systems have been presented. A simulation equation has been developed that correlates the micromixing time and rate of oxygen transfer in geometrically similar baffled surface aerations for scaling up the process characteristics of surface aeration systems.