

Various nanofiltration membranes, which carry an electric charge at the membrane surface, have been developed [1-4]. The electric charge of nanofiltration membranes is said to be due to the dissociation of functional groups, adsorption of ions, polyelectrolyte, ionic surfactants and charged macromolecules from water [5]. Principally, the separation of ionic solutes via low pressure nanofiltration membranes is affected by the membrane electric charge. Therefore, the characteristics of the separation of ionic solutes via charged membranes are thought to be dependent on the molecular charge density.
Generally, the electric charge characteristics of a membrane have been evaluated using the zeta potential obtained from measuring the streaming potential of a membrane [6-9].
Considering the extended Nernst-Planck model, coupled with the Donnan equilibrium, the rejection of divalent anions is much higher than that of monovalent anions in the case of negatively charged membranes. Conversely, positively charged membranes exhibit much higher rejection of divalent than monovalent cations [10-13].
However, some nanofiltration membranes exhibit much higher rejections of both divalent cation and anions than of monovalent ions, although those type of nanofiltration membranes are commercially referred to either positively or negatively charged membranes [14]. Therefore, the commercial information available on the electric charge state of some nanofiltration membranes may not be true with respect to the experimental rejection characteristics of various ionic solutes.
This study aimed to analyze the electric charge density state of nanofiltration membranes using the observed experimental separation characteristics for various monovalent and divalent ionic solutes, and to examine different electric charge density states of transport models on the basis of the extended Nernst-Planck model, coupled with the Donnan equilibrium. Confirmation of the electric charge density states of the membranes were further investigated by comparing the experimental rejection of ionic solutes with model calculations for different electric charge states.
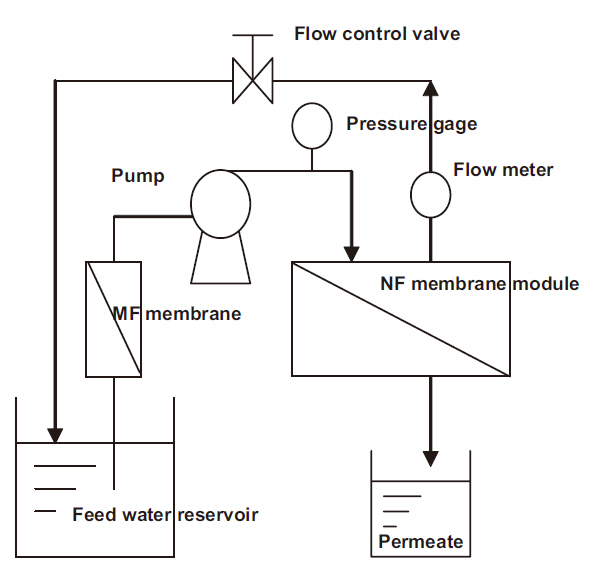
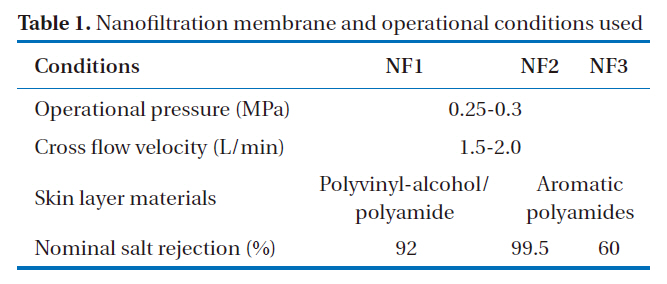
The rejection characteristics of various ionic solutes by nanofiltration membranes were obtained using the experimental cross-flow nanofiltration set-up shown in Fig. 1. This process operates within the low pressure range under 0.25-0.3 MPa and uses 3 types of nanofiltration membrane, and was continuously run for 30 days. Before the nanofiltration process, a micro filtration unit, which had a membrane-pore diameter of 0.1 ㎛,was used as a pretreatment for the removal of suspended solids.The pretreated water was fed into the circulating tank and then pumped to each nanofiltration membrane module, which consisted of flat-sheet types, with the surface area of each module being 44 cm2. The skin layer material of the nanofiltration membranes, with nominal salt rejections of 99.5, 60, and 92%, were categorized as either aromatic polyamides or polyvinylalcohol/polyamide, with two and one types, respectively. The operational pressures, cross flow velocities, and temperatures of the nanofiltration experiments are shown in Table 1.
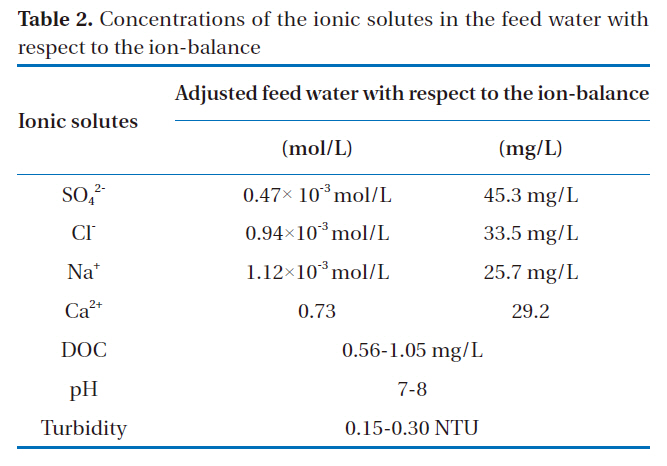
Table 2 shows the composition of Tama-river water in Tokyo,which was utilized as the feed water in the nanofiltration experiments. Although the Tama-river water contained various ionic solutes, the president monovalent and divalent, ions such as chloride, sodium, sulfate and calcium, were selected because the focus of this study was to investigate the difference between the rejections of monovalent and divalent ions.
In this study, ionic solutes were the target solutes in the nanofiltration experiment. Anionic solutes were analyzed by an ion chromatograph (IC; Simadzu Co., Kyoto, Japan), with the cation solutes measured by an inductively coupled plasma/atomic emission spectrometry (ICP/AES; Perkin-Elmer Co., Norwalk, CO, USA).
3.1. Rejection Characteristics of Ionic Solutes
The experimental rejections of ionic solutes, such as those containing sulfate, chloride, sodium and calcium, via the nanofiltration membranes are shown in Table 3, which were obtained from the average values for 30 day operations of each nanofiltration at under 0.25-0.3 MPa. The rejection of monovalent ions was less than that of divalent ions with every membrane, and less than the nominal rejections because of low-pressure operation.
The electric charge density states of the membranes were investigated using the experimental separation characteristics of ionic solutes, the difference between the rejection of both monovalent and divalent cations and anions was an important factor. At this point, the separation coefficient was introduced to evaluate the membrane-charge via the rejection characteristics of the ionic solutes. The separation coefficient consists of
[Table 1.] Nanofiltration membrane and operational conditions used
Nanofiltration membrane and operational conditions used
[Table 2.] Concentrations of the ionic solutes in the feed water with respect to the ion-balance
Concentrations of the ionic solutes in the feed water with respect to the ion-balance
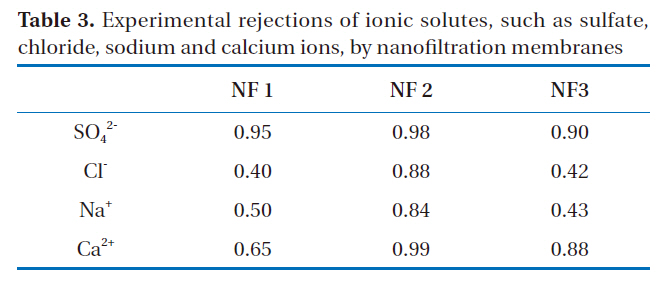
Experimental rejections of ionic solutes such as sulfatechloride sodium and calcium ions by nanofiltration membranes
positivethe permeation ratio of monovalent to divalent ions, as shown in Equations (1) and (2).
In Equations (1) and (2), the separation coefficient, Kanion, was defined by the separation ratio of monovalent to divalent anion permeations by the nanofiltration membranes. The separation coefficient, Kcation, was defined by the separation ratio of monovalent to divalent cation permeations. At this point, Psulfate, Pchloride, Pcalcium and Psodium refer to the permeation rates of sulfate, chloride, calcium and sodium ions through the nanofiltration membranes. These were calculated by the rejections of sulfate, chloride, calcium and sodium ions by the nanofiltration membranes, and written as Rejsulfate, Rejchloride, Rejcalcium and Rejsodium in Equation (1) and (2), respectively.
If the separation coefficient of an anion is larger than that of a cation with a certain membrane, the membrane will most likely carry a negative electric charge. The charge state of a membrane,where the separation coefficient of anions is much smaller than that of cations, would be positive. The separation coefficients of nanofiltration membranes obtained from the experimental permeations of monovalent and divalent ionic solutes are shown in Table 4.
In the case of NF1, the separation coefficient of anions was much larger than that of cations. That is to say, the difference in the rejections of anions between monovalent and divalent solutes was larger than that of cations. Therefore, NF1 may carry negative charge. The separation coefficient of anions for NF2 was much smaller than that of cations. The difference in the rejections of cations between monovalent and divalent ions was larger than that of anions. Therefore, the charge of NF2 membrane would be positive. Conversely, the difference in the separation coefficients between anions and cations was small in the case of NF3, with almost the same selectivities observed for both cation and anions. This means that the effects of both a positive charge on cation rejection and a negative charge on anion rejection were simultaneously observed in these membranes. These membranes may carry both negative and positive double charges.
3.3. Theoretical Consideration
In order to consider the charge states of the nanofiltration membranes discussed in the previous section, model calculations,with the assumption of different membrane charge states,were further examined. The model was based on the extended Nernst-Planck model, coupled with the Donnan equilibrium,and categorized into three parts; negatively charged, positively
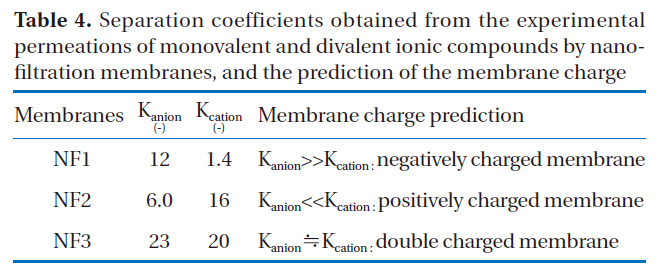
Separation coefficients obtained from the experimental permeations of monovalent and divalent ionic compounds by nanofiltration membranes and the prediction of the membrane charge
charged and negative/positive double charged models. Three states of electric charge were assumed to explain the rejection characteristics of ionic solutes, such as sodium, calcium, chloride and sulfate. These models were applied to a mixed solution.
The representation of the concentration change of ionic solutes through the negatively charged membranes were as follows: At the interface between the solution and membrane phases, the Donnan equilibrium occurs, which is caused by the concurrence with the electrical chemical potential. A solute inside the membrane phase is transported by the phenomena of diffusion, electric potential gradient and convection, which can be described using the extended Nernst-Planck equation.
The concentration changes of ionic solutes through the positively charged membrane were represented as follows: Because the state of the membrane electric charge is assumed to be positive, the exclusion phenomena due to the Donnan equilibrium at the interface between the membrane and solution are the reverse of those for negatively charged membranes. The concentration change of ionic solutes inside the membrane is described using the extended Nernst-Planck equation, assuming the electric charge of the membrane is positive.
The double charge model is based on the assumption that membranes have both negative and positive charges. The absolute value of the charge density in the negatively charged layer was assumed to be equal to that in the positively charged layer. The concentration changes of ionic solutes by the negative/positive double charge model were represented as follows: Two-charged areas inside the membrane were assumed; one negatively and one positively charged. The Donnan equilibrium,coupled with an electro neutrality condition, occurs at the interface between positively and negatively charged areas, as well as the interface between the membrane and solution. The transport of ionic solutes inside a membrane is also interpreted using the extended Nernst-Planck equation.
The concentration change due to the Donnan equilibrium can be described by Equation (3). The Donnan potential differences on both sides of the membrane are determined to satisfy electro neutrality.
where ΔΦ
The transport of solutes inside the membrane phase can be explained by the extended Nernst-Planck equation. As shown in Equation (4), the transport equation of solutes through nanofiltration membranes consists of diffusion, electrostatic and convection terms.
The flux of the ith ion through the membrane is ji, and is divided into diffusion, electrostatic and convection factors in Equation (4); where ωi represents the ionic mobility of the ith ion and Jv the volume flux of the membrane.
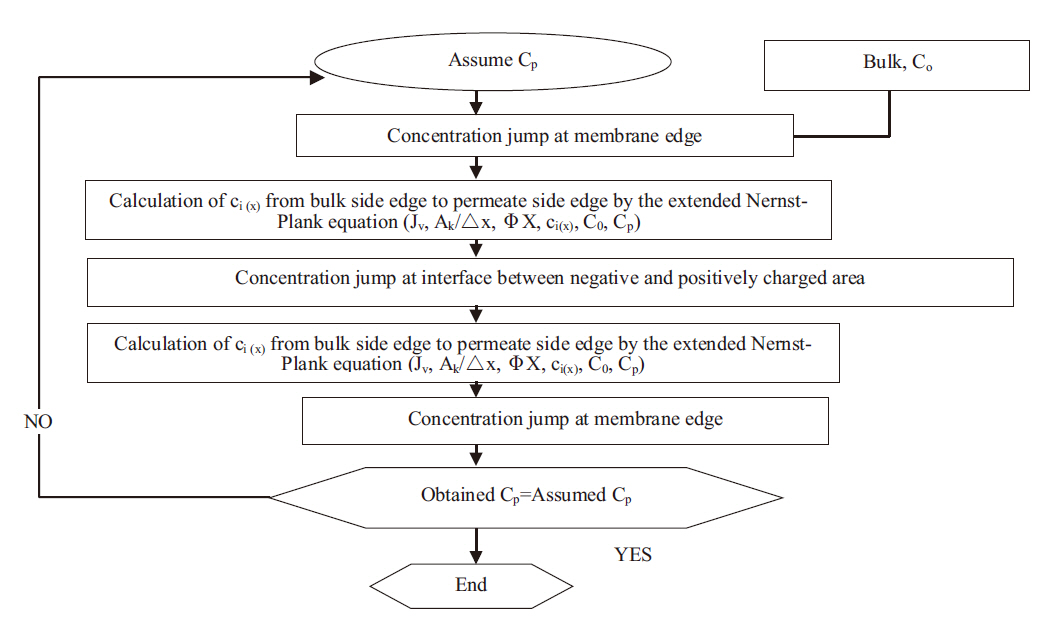
The model calculation procedures of the negatively, positivethe
ly and negative/positive double charged models were as follows: As shown in Fig. 2, the permeate concentrations were appropriately assumed before the step-by-step calculation in the direction of the filtration. The concentrations inside the membrane at the bulk side edge were calculated from the bulk concentrations. A set of transport equations were used to calculate the concentration profiles inside the membrane. This calculation procedure was repeated until that the calculated permeate concentration approached the given permeate concentration. Conversely,the negative/positive double charged model was combined with both the negatively and positively charged models. This calculation procedure was also repeated until the calculated permeate concentration approached the given permeate concentration. However, unknown parameters are contained in these models; the ratio of the porosity to the membrane thickness and effective charge density. The ratio of the porosity to the membrane thickness of each membrane used was 5,000 m-1, which was estimated using the experimental permeation of polysaccharide materials with different molecular weights, such as maltose, glucose and ethanol, within the low pressure operational range of the nanofiltration membranes. The effective charge density obtained from the curve fitting with chloride rejection in the case of the extended Nernst-Planck model, coupled with the Donnan

Effective charge density obtained from the curve fitting with chloride rejection in the case of the extended Nernst-Planck modelcoupled with the Donnan equilibrium with the negatively positively and negative/positive double charge states (Ak/Δx:5000 m-1)
equilibrium, in the states of negatively, positively and negative/positive double charges are shown in Table 5.
3.4. Comparison of Experimental Rejection with Model Calculation
To clarify the electric charge state of the nanofiltration membranes,the model calculations for the different electric charge states of the membranes were compared with the experimental rejections of monovalent and divalent ions, such as sodium, chloride, calcium and sulfate.
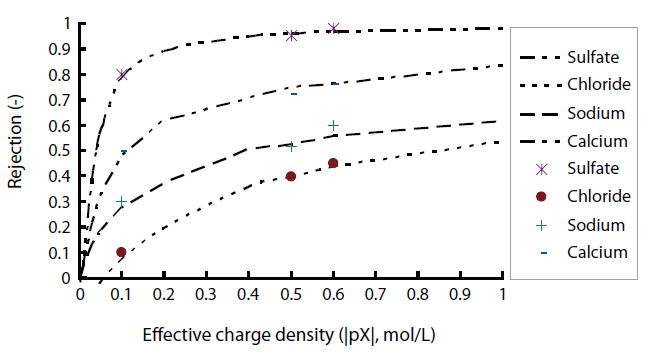
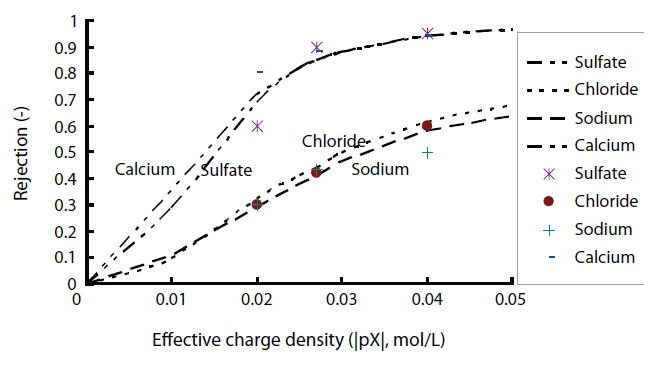
Fig. 3 shows the rejection characteristics of ionic solutes with the assumption of a negatively charged state in the case of NF1.The difference in the rejections of chloride and sulfate was larger than that of calcium and sodium. In the case of the negatively charged membrane, the difference in the rejections of anions was predicted to be much larger than that of cations from the model calculations assuming negatively charged membranes. The experimental rejections of chloride, sulfate, sodium and calcium by NF1 agreed with the model calculations for negatively charged states comparing with other electric charged states. The electric charge of the NF1 membrane was confirmed to be negative.
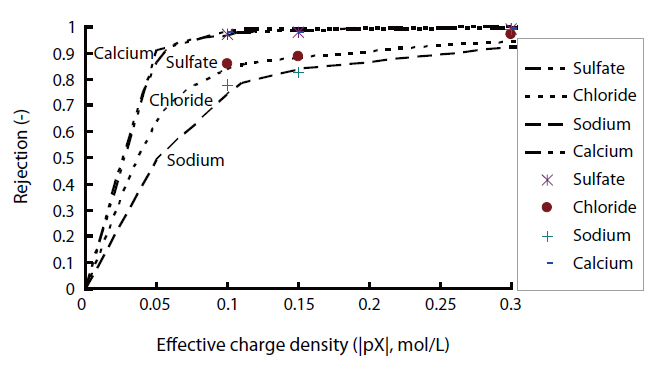
The experimental rejections of ionic solutes by NF2 was compared with the model calculations for the positively charged state, as shown in Fig. 4. The experimental rejections of chloride and sodium by NF2 were 88 and 84%, respectively, while those of sulfate and calcium were 98 and 99%, respectively. The difference in the experimental rejections between sodium and calcium ions was higher than that between chloride and sulfate ions. Comparing the model calculation, the characteristics of the separation of ionic solutes were close to those of the positively charged membrane. Therefore, the electric charge of the NF2 membrane was confirmed to be positive.
The experimental rejection and model calculation for the ionic solutes by NF3 are also plotted in Fig. 5. The experimental rejections of chloride and sodium by NF3 were 42 and 43%, respectively, and those of calcium and sulfate were 88 and 90%, respectively. In the case of the negative charge model, the difference in the rejections of anions between chloride and sulfate was much higher than that of cations, while the difference in the rejections of cations was higher than anions with the positive charge model. Conversely, both divalent cations and anions gave the same rejection with the negative/positive model. While NF3 is commercially referred to as a positive charge membrane, the rejection characteristics of ionic solutes by NF3 were different to those of positively charged membranes, as there was no difference in the selectivities of monovalent and divalent cations from those of anions. Therefore, the charge state of the NF3 membrane was confirmed to be a negative/positive double charge.
The electric charge states of nanofiltration membranes were investigated both experimentally and via model calculations. Separation coefficients, which are the permeation ratios of monovalent to divalent ions, were introduced to evaluate the state of the membrane charge from the experimental rejection of ionic solutes. In order to confirm the electric charge state of membranes, calculations using the extended Nernst-Planck model, coupled with the Donnan equilibrium, assuming different membrane electric charge states, were compared with the experimental rejections of ionic solutes. In the case of NF1, the experimental rejection agreed with the model calculation for negatively charged states compared with the other electric charged states. The experimentally obtained separation characteristics of ionic solutes with NF2 were explained by the model calculation for positively charged states. Conversely, the double charged membrane model can interpret the rejection characteristics of ionic solutes by NF3.
Consequently, some of the available nanofiltration membranes showed separation characteristics typical of a negative/positive double charged membrane. Moreover, the electric charge density for nanofiltration would be easy to evaluate using the separation coefficients of monovalent and divalent ionic solutes using low-pressure operations. Information on the separation coefficients for nanofiltration membranes might be helpful in determining the selectivity of nanofiltration membranes for the production of drinking water.
Φ Electrical potential (V)
ΔΦD Donnan potential difference
Ak/Δx ratio of porosity to membrane thickness (m-1)
Ci concentration of the ith solute in bulk solution (mol/L)
ci concentration of the ith solute inside membrane (mol/L)
F Faraday constant (9.65*10-4C/mol)
j i flux of the ith ion through the membrane (m3/m2 sec)
J v volume flux (m3/m2 sec)
K separation coefficient of monovalent and divalent ion (-)
Kanion separation coefficient of monovalent and divalent anions (-)
Kcation separation coefficient of monovalent and divalent cation (-)
ØX effective charged density (mol/L)
Reji rejection rate of the ith ion through the membrane (-)
R gas constant (= 8.31J/molK)
Pcalcium permeation of calcium (-)
Pchloride permeation of chloride (-)
Psodium permeation of sodium (-)
Psulfate permeation of sulfate (-)
T temperature (K)
x distance inside the membrane (m)
XD effective charge density at double charge area (mol/L)
XN effective charge density at negative charge area (mol/L)
XP effective charge density at positive charge area (mol/L)
z i charge valence of ith ion
ωi ionic mobility of the ith ion (mol m2/Js)
