The constant expansion of water related infrastructure such as sewage treatment plants by the Korean Government has contributed to a notable reduction of point source pollution. Yet, nonpoint source (NPS) pollution is increasingly affecting water quality [1]. In 2003, the contribution of NPS loadings to major rivers accounted for almost half the total loading, and is predicted to rise to 70% by 2015 if no adequate control measures are introduced [2]. Sprawl, which is the irresponsible development,is the major contributor to the increase in NPS loadings and volume of stormwater runoff. Bannerman et al [3] found that streets with impervious surfaces contained the highest pollutant loads in most land use categories. Impervious covers can double, triple, quadruple or even quintuple peak discharge [4]. Urban stormwater managers seek technologies that are able to address the flow and water quality impacts of urbanization [5].
The pollutant concentration-restricting approach by the Ministry of Environment (MOE) has not been very effective at improving the water quality of the major rivers in Korea. Consequently, the MOE introduced the total maximum daily load (TMDL) approach in 2004. The TMDL regulates or controls the pollution load discharged below the total amount allowed to attain the water quality target of streams [6]. The MOE is aggressively pursuing the implementation and compliance with the TMDL for watershed protection, and effective control of NPS is believed to be the key method for successfully meeting the TMDL [7, 8]. Changes in management policies have resulted in the introduction of pilot projects, termed ‘best management practices’ (BMP), adopted from the United States. The objectives of the program are to determine catchment areas, determine runoff characteristics and evaluate the treatment performance of structural BMPs, as many introduced in Korea have only been based from literature studies that do not reflect the climatic characteristics and geographical features of the country. The results of BMP case studies will be used to facilitate the design of similar BMP types and optimize NPS management policies (e.g.,TMDL) in Korea.
Based on the National Pollutant Removal Performance Database for Stormwater Treatment Practices of the United States Environmental Protection Agency (U.S. EPA), the median performances of filtering practices for total suspended solids (TSS), total nitrogen (TN) and total phosphorus (TP) were 86, 32 and 50%, respectively [9]. It has to be emphasized that the median removal efficiency was used instead of the mean that resulted in higher values. The issue of reporting pollutant removal efficiencies needs to be addressed, particularly for each type of BMP, because if a wide range of removal efficiencies exists, employing an appropriate stormwater treatment strategy will be difficult. Therefore, this study aimed to develop a more appropriate method for the characterization of stormwater runoff using the event mean concentration (EMC) and calculate the pollutant removal efficiency of a stormwater runoff treatment system for BMPs. Although existing methods are available and currently practiced in most BMP studies, the uncertainties in reporting overall average EMC and removal efficiency values should be eliminated, or at least reduced. The data used in this study was obtained from a 28-month monitoring during 22 storm events on a swirl and filtration system, a type of BMP for the treatment of stormwater runoff.
2.1. Site Description and Monitoring Scheme
2.1.1. Site Location and Facility Description
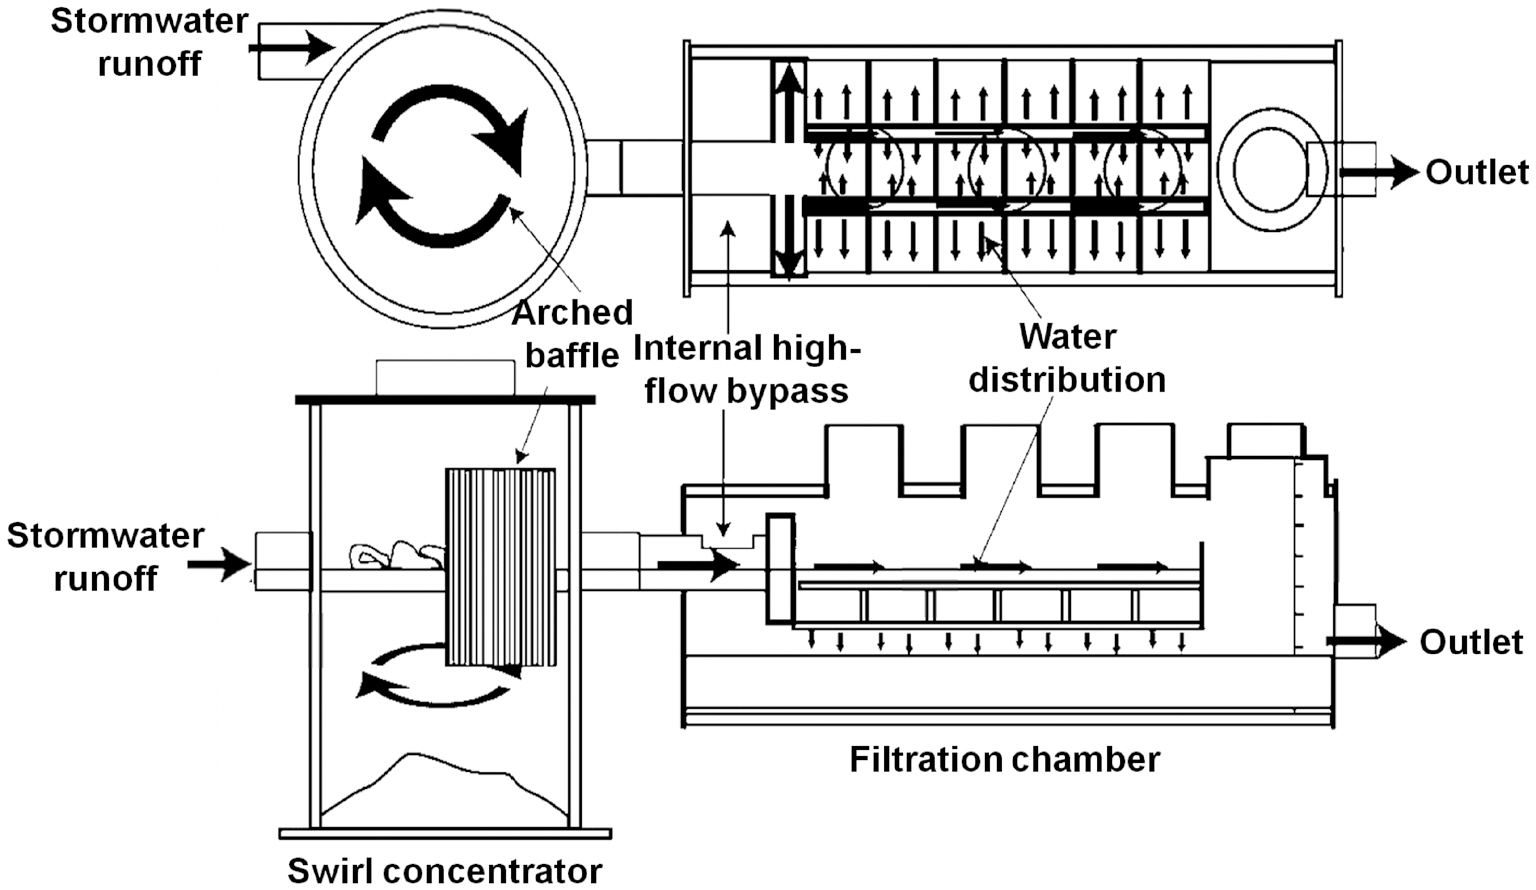
A swirl and filtration system (surface area=19.2 m2) was installed in an asphalt-paved parking lot (100% impervious), which drained a 10,700 m2 catchment area. The main function of the facility was to remove sediments, suspended solids, particulate pollutants, petroleum hydrocarbons, heavy metals and nutrients from stormwater runoff by means of sedimentation and filtration mechanisms. Fig 1 shows a detailed description of the system. The facility was comprised of two devices in sequence; first, a swirl tank, which provided pre-treatment of the storm-
water runoff and was responsible for the removal of sediments, free-floating oil and debris by the mechanism of sedimentation, the runoff then flowed directly to the internal spillways across the second device, which was a filtration chamber that allowed runoff to permeate through the pores of perlite filter cartridges via filtration. Subsequently, the treated runoff was channeled through an outlet pipe and discharged to the adjacent stream.
2.1.2. Storm Event Sampling
A total of 22 storm events were sampled during the monitoring period from 06/2006 to 10/2008 to evaluate the pollutant removal efficiency of the swirl and filtration system in the treatment of stormwater runoff. Continuous flow measurements were performed and rainfall data collected to obtain a relatively unbiased approximation of the pollutant mass loads. The total sampling time was adjusted to approximate the time during which the “first flush” was processed [10]. Generally, at least 12 samples were manually collected at both the inlet and outlet. Typical water quality parameters were measured, including TSS, biochemical oxygen demand (BOD), chemical oxygen demand(COD), dissolved organic carbon (DOC), TN, TP, heavy metals (zinc, lead, etc.), and oil & grease (O&G). Analyses of these parameters were performed in accordance with standard methods[11].
2.2. Calculations and Data Analyses
2.2.1. Event Mean Concentration
The EMC is an important factor in predicting the total pollutant load, which has made the EMC a critical parameter for estimating the contribution of runoff to receiving waters [12, 13]. The EMC was used to quantify the average pollutant load washed off during a storm event with respect to the event runoff volume. The pollutant loading for a storm event is calculated by the summation of loadings during each sampling period using
the volume (or flow rate) for that period. The equation below is used for the determination of the EMC:
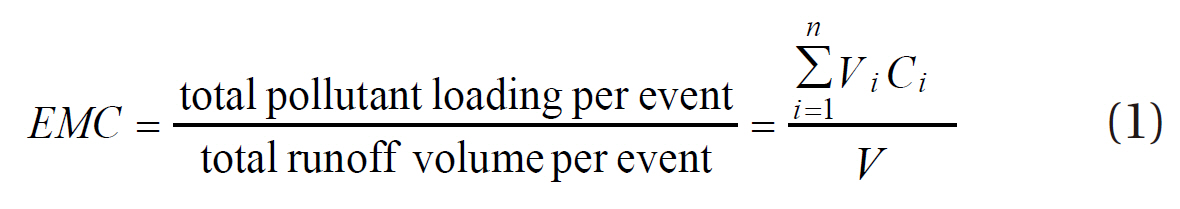
where EMC = event mean concentration, mg/L; V = total runoff volume per event, L; V
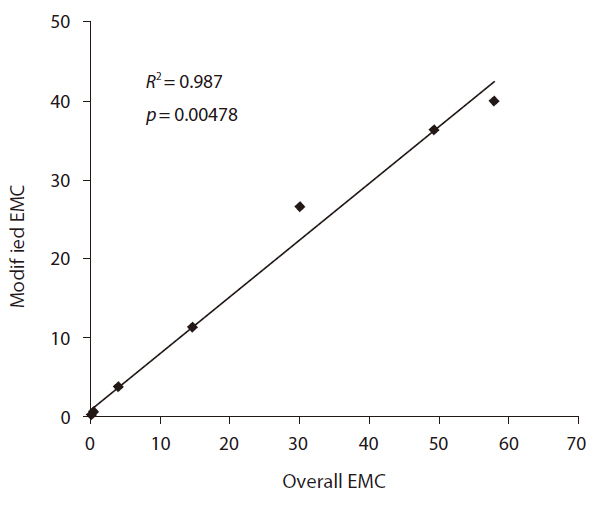
Based on the above equation, the EMC calculated for each storm event only represents the concentration with respect to the flow or volume which might lead to overestimated or underestimated values when arithmetically averaged for the total number of storm events. For instance, a storm with little rainfall will result in a high EMC value, while that with large rainfall will yield a small EMC value because the EMC is averaged over the entire storm event. Therefore, a more specific approximation of the average EMC over the entire monitoring period was developed using the rainfall ratio, α
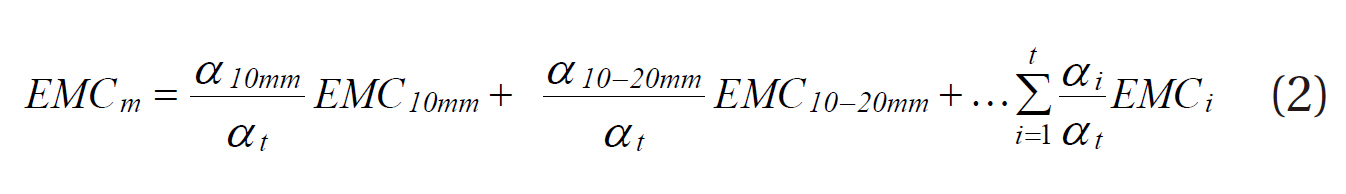
where EMC
The rainfall ranges can be selected based on the rainfall characteristics. In this study, three ranges were chosen, as follows:less than 10 mm, 10 to 20 mm and greater than 20 mm of rainfall. The EMC for each pollutant was calculated for each event and then categorized for each of the rainfall ranges. Finally, the overall EMC was computed and compared with that of the modified EMC.
2.2.2. Removal Efficiency
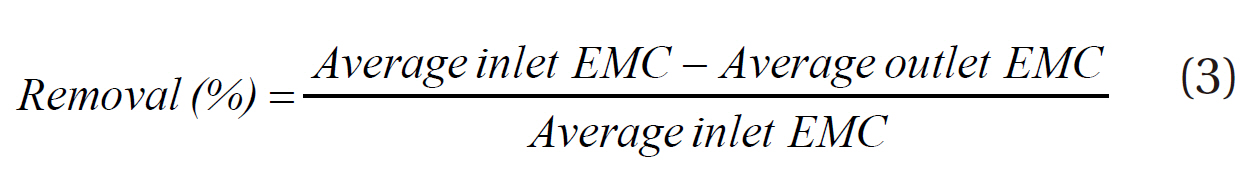
Various efficiency methods are used by investigators in BMP monitoring studies to evaluate pollutant removal efficiencies [14]. In this study, four methods were selected and applied to assess the efficiency of the swirl and filtration system. First, the “efficiency ratio (ER) method” [15], which is defined in terms of the average removal efficiency of pollutants for each storm event (Eq. 3).
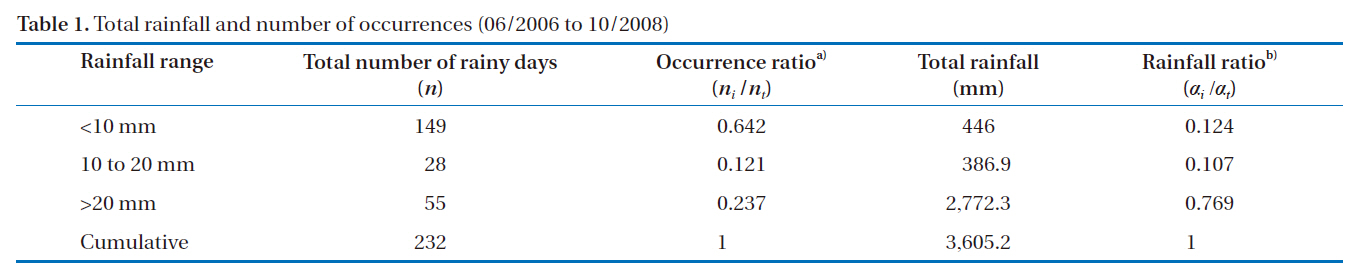
[Table 1.] Total rainfall and number of occurrences (06/2006 to 10/2008)

Total rainfall and number of occurrences (06/2006 to 10/2008)
Second, the “summation of loads (SOL) method” [14], which is based on the ratio of the summation of the total incoming loads to that of the total outgoing loads (Eq. 4).

Third, the “regression of loads (ROL) method” [16], where the regression efficiency is defined in terms of the slope (β) of a least squares linear regression of the inlet and outlet pollutant loads, with the intercept constrained to zero (Eq. 5).

Finally, another method, termed the “rainfall occurrence ratio (ROR) method” was proposed and used in this study to evaluate the efficiency. The ROR method was developed to consider the variability of the rainfall characteristics at the monitoring site that might affect the average removal efficiency. The removal efficiency can be calculated by multiplying the average removal efficiency obtained from the ER method by the rainfall occurrence ratio, ni /nt (Eq. 6). The rainfall occurrence ratio in Table 1 equals the number of rainy days for a specific rainfall range divided by the total number of rainy days during the entire monitoring period.

All statistical hypotheses were tested at the 5% level (α = 0.05) using a one-way analysis of variance (ANOVA). The SYSTAT 12 software package (ⓒ SYSTAT Software Inc., Richmond, CA, USA,2007) and OriginPro 7.5 SRO v7.5714 (B714) (ⓒ OriginLab Corporation, Wellesley, MA, USA, 1991-2003) were used for the statistical analyses and plotting of data.
3.1.1. Rainfall
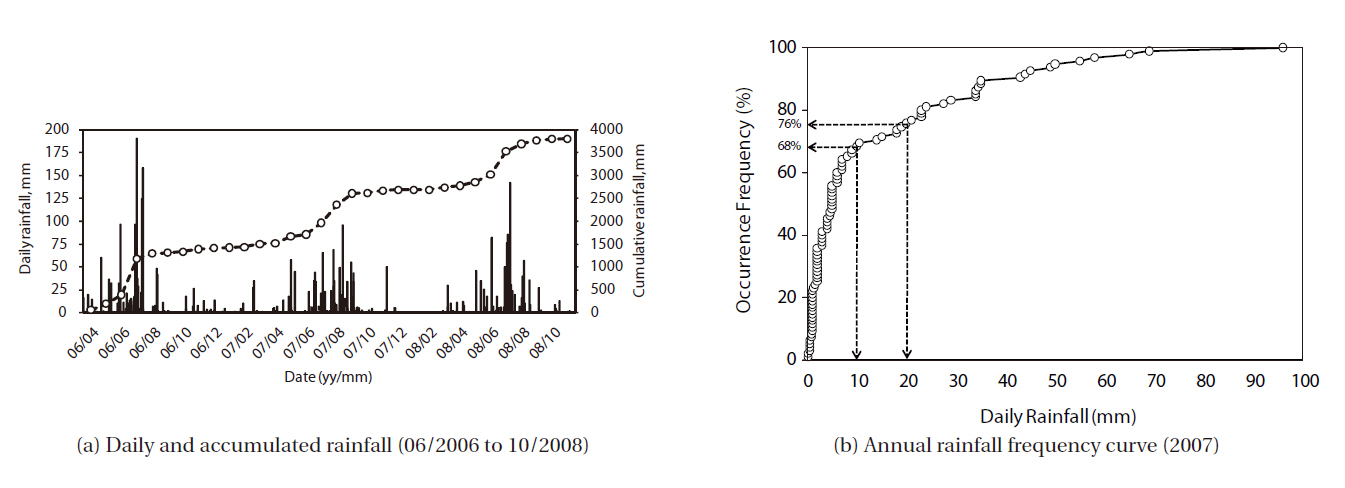
The rainfall during the monitoring period between 06/2006 and 10/2008 is shown in Fig. 2. A steep accumulated rainfall curve in Fig. 2 (a) was apparent during the summer seasons, from June to August, when most of the rainfall occurred. In Korea, a typical rainfall event averages 14 mm. However, the median rainfall is 5 mm lower than the mean which suggests most rainfall events in Korea are small. In fact, almost 68% of the rainfall that occurred
was below 10 mm, with 76% below 20 mm Fig. 2(b). The sum of the maximum rainfall for each year over a three year period was about one-third of the total rainfall over three years.
Table 1 provides the rainfall data used in the calculation of the modified EMC (Eq. 2) and efficiency using the ROL method(Eq. 6). Accordingly, the rainfall ratio and occurrence ratio were very different for the <10 mm and >20 mm rainfall ranges. It has to be emphasized that even though the majority of storms occurred with rainfall <10 mm, the total rainfall was still small. On the other hand, almost similar ratios were observed for the 10 to 20 mm rainfall range, indicating that this range was least affected by the modified EMC calculations.
3.1.2. Storm Event
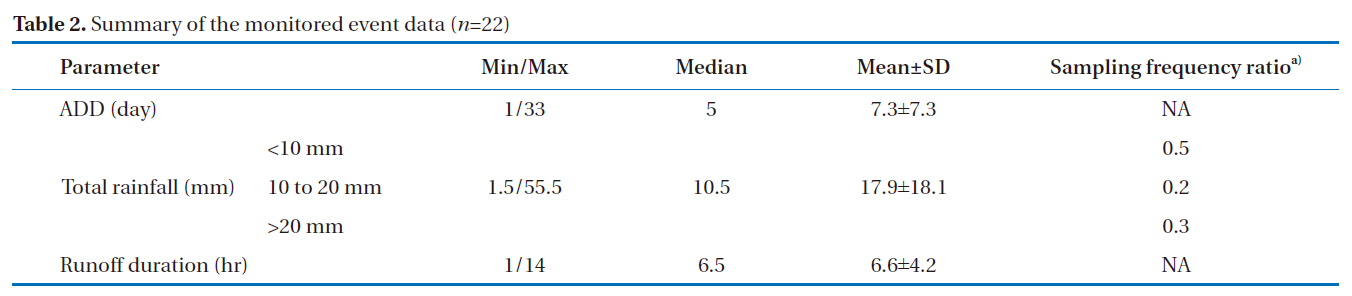
The summary of the monitored event data are provided in Table 2, which includes antecedent dry day (ADD), total rainfall,runoff duration and the sampling frequency ratio. The median rainfall was 10.5 mm, suggesting that most of the sampled storm events were less than 10 mm (50% of the total sampled events). However, the sampling ratios of each rainfall range were highly correlated (
rea during the study period. Due to the high rainfall intensity of 15.2 mm/hr during the 08/26/2006 storm (data not shown), the runoff exceeded the storage capacity of the facility and resulted in extreme overflow.
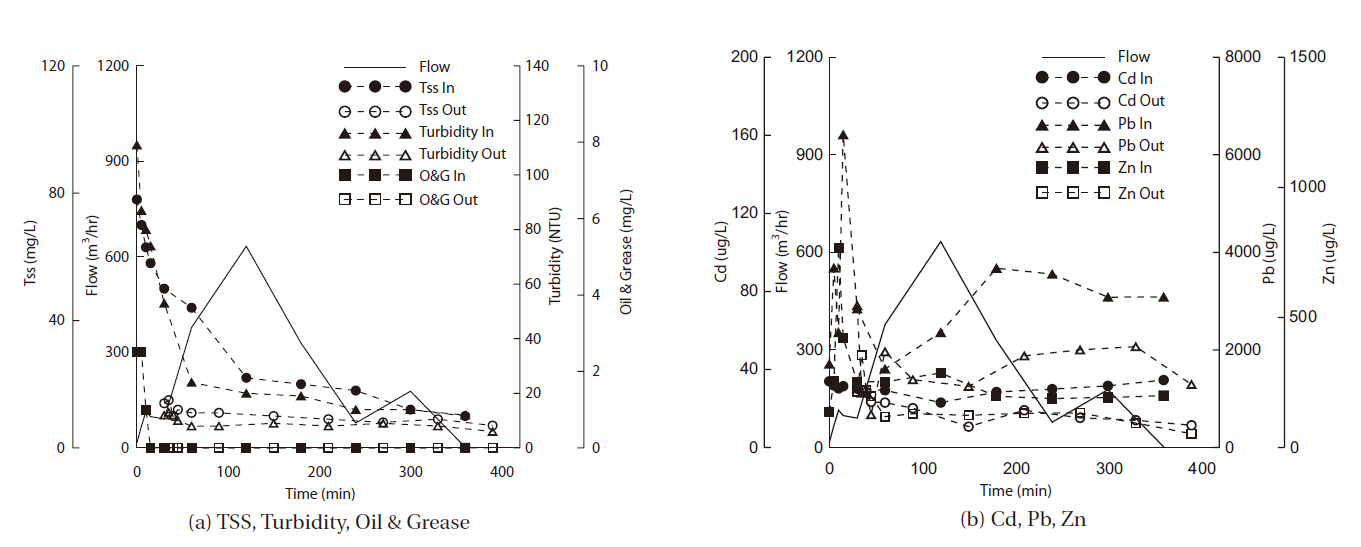
3.2.1. Pollutant Pattern
The plots in Fig. 3 illustrate the typical patterns of pollutant concentrations at the inlet and outlet of the swirl and filtration system with respect to flow and time. Apparently, the existence of the first flush was clearly identified for the TSS and metal concentrations during a relatively short period at the very beginning of the storm only at the inlet. Metals are known to often move from paved surfaces used for transportation by being adsorbed onto particulate materials [17]. The outlet concentration did not exhibit a first flush effect, signifying the efficiency of treatment via the swirl and filtration system. Nonetheless, the outlet concentration only appeared to be slightly reduced, and remained almost constant during the entire storm event, signifying the limitation of the swirl and filtration system in the treatment of stormwater runoff from paved areas.
[Table 2.] Summary of the monitored event data (n=22)
Summary of the monitored event data (n=22)
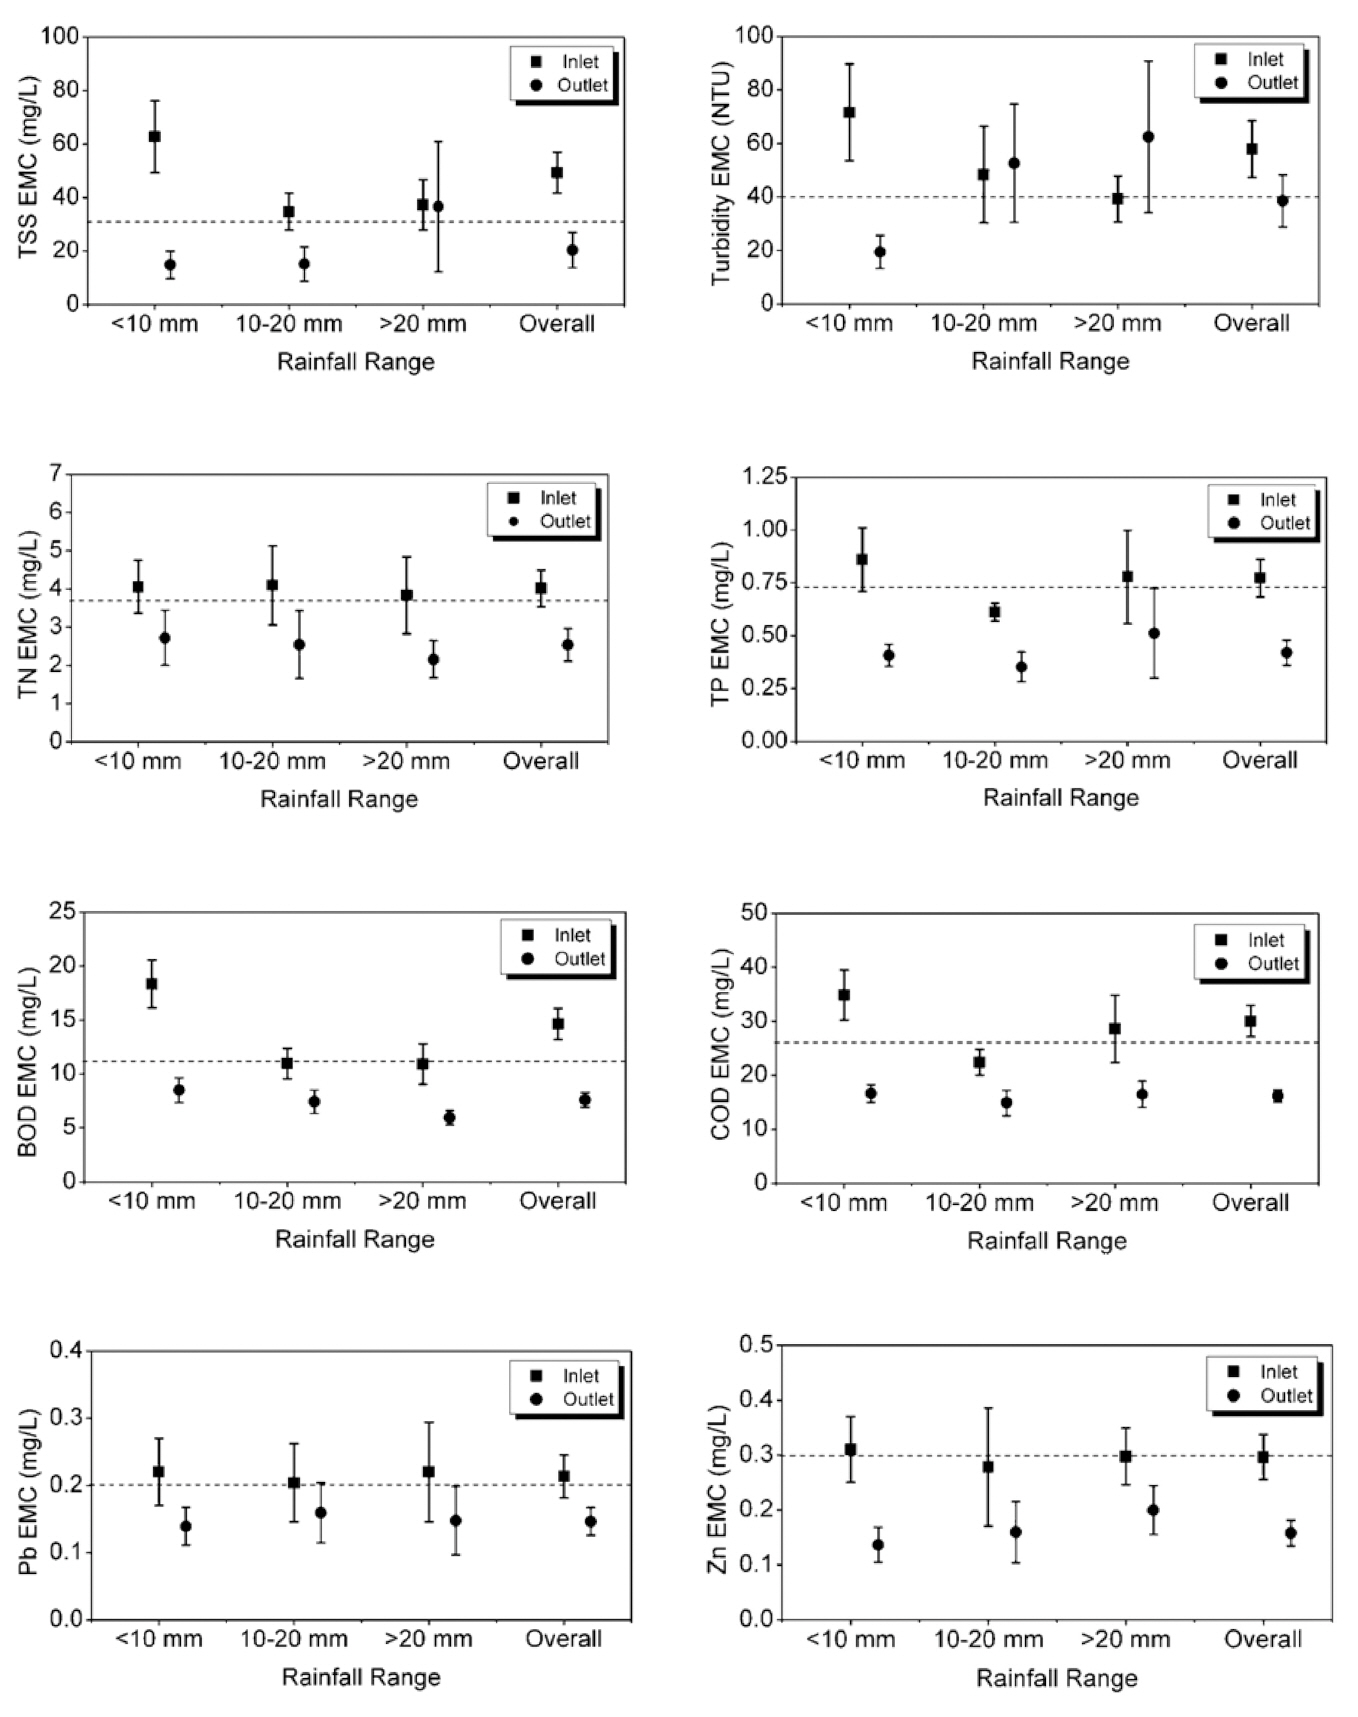
3.2.2. Event Mean Concentration
The average pollutant concentrations of typical water quality parameters in urban runoff studies are generally quantified by means of the EMC. Given that stormwater runoff s associated with high uncertainties due to site and rainfall characteristics, the EMC values can also be affected, as reflected by the wide distribution and deviation of the EMC values found in several studies in Korea[6, 17, 18]. For example, the pollutant EMC values based on 12 stormwater runoff studies by Kim et al. [17], conducted at parking lots, resulted in average EMC values of 115, 35, 4 and 1 mg/L for TSS, BOD, TN and TP, respectively. These results were higher compared to those found in this study. Climate, weather and geography tend to affect average EMC values. It is possible that a very accurate (statistical) analysis should be performed to eliminate the uncertainties in predicting EMC values.Fig. 4 shows the comparison of the calculated EMC values for various pollutants with respect to the three rainfall ranges (i.e., <10 mm, 10 to 20 mm and >20 mm rainfall), both cumulatively (i.e. using arithmetic average of the total events) and modified (calculated by using Eq. 2). All measured parameters exhibited significant differences between the inlet and outlet EMC values (
3.3. Pollutant Removal Efficiency
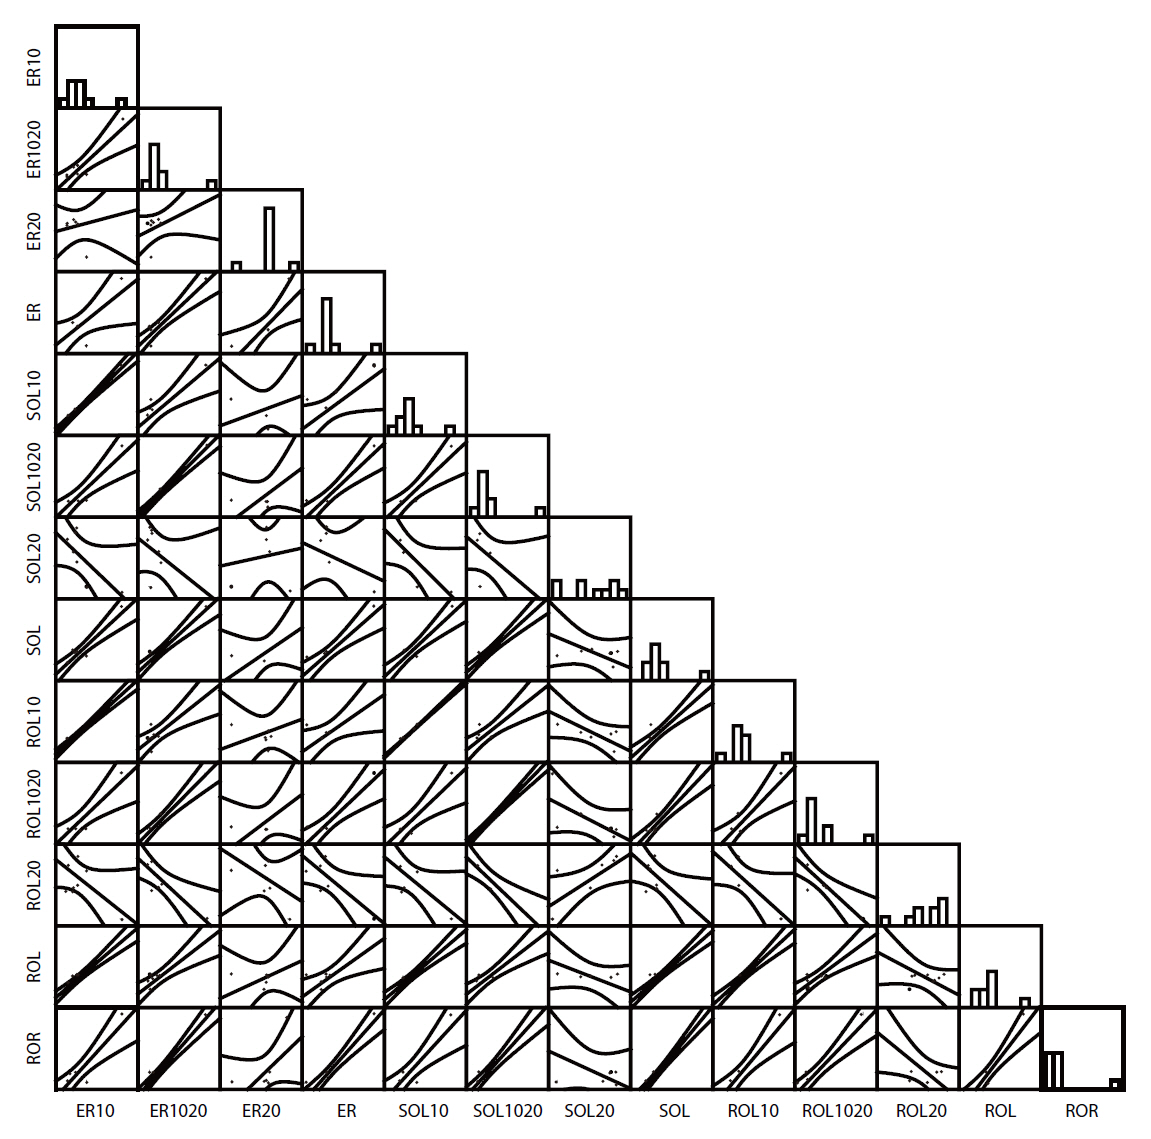
The treatment capability of the swirl and filtration system was evaluated based on the total monitored storm events using four efficiency determination methods, including the ER, SOL, ROL and ROR methods. The efficiencies were also determined for each corresponding rainfall ranges. Linear correlations between the methods were displayed in the scatter plot matrix (SPLOM) in Fig. 6 and probability matrix in Table 3. As revealed by the linear regression lines in SPLOM, the overall average efficiencies of the four methods were all positively correlated, with the exception of the >20 mm range. This result suggests that the efficiency of the system was highly variable when the storm event has greater than 20 mm of rainfall. Moreover, it also proves that the system is more efficient for storm events having less than 20 mm, and even better 10 mm of rainfall. The design of a facility for the treatment of stormwater runoff usually employs rainfall during which the first flush occurs because treating all, or a larger volume of runoff is impractical and uneconomical. Therefore, achieving high treatment efficiencies is still difficult (e.g. 90 to 100% pollutant removal).
Comparing the four methods, the ROR method appeared to be the most highly and significantly correlated with the other three methods, with a minimum Pearson correlation coefficient(
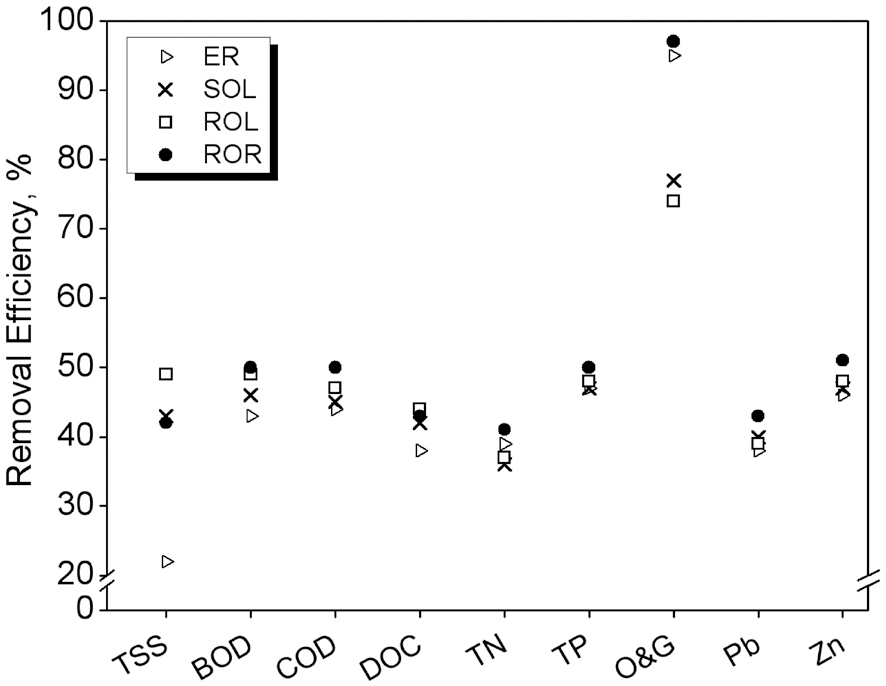
The overall average removal efficiency of the swirl and filtration system calculated using the four methods is shown in Fig.7. The highest removal efficiency was achieved for oil and grease (O&G) with greater than 70% removal. The other pollutant parameters merely attained less than 50% removal efficiencies. The ROF method showed the highest efficiency compared to the other three methods, with the exceptions of TSS and DOC; however, the differences were not significant. The ER method,which considers only the EMC in the calculation of the removal efficiency, yielded significantly lower efficiency value for TSS(
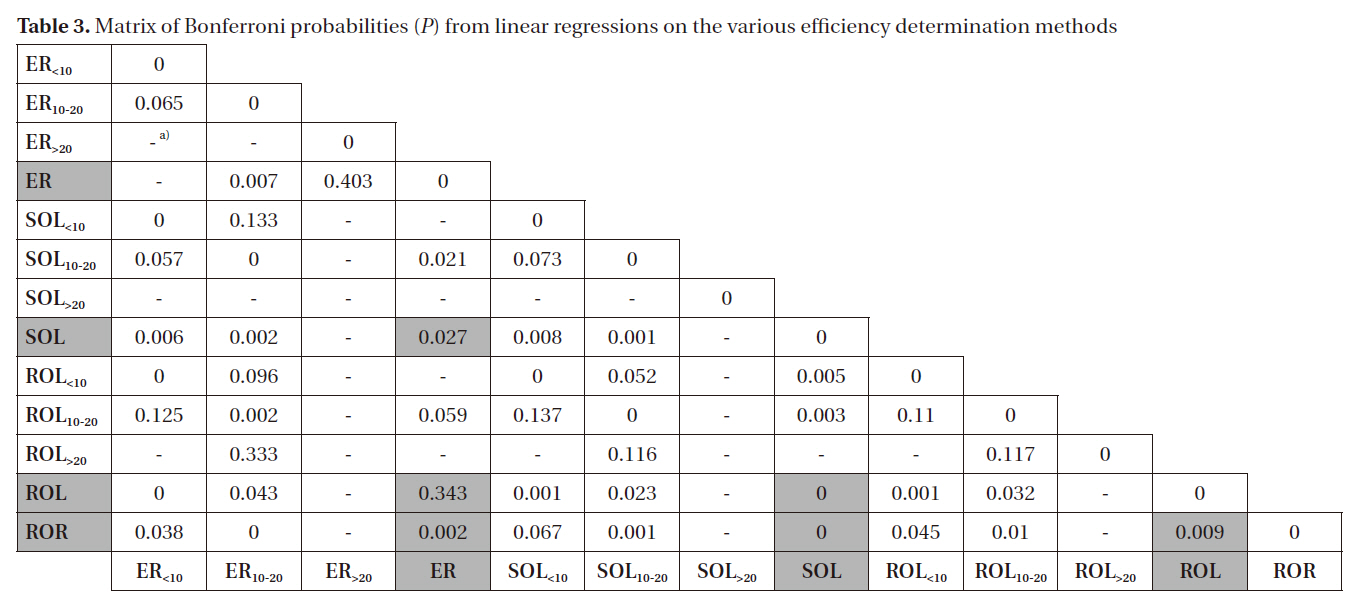
Matrix of Bonferroni probabilities (P) from linear regressions on the various efficiency determination methods
proximation of the average removal efficiency since it takes into account both the EMC and rainfall frequency. Indeed, the rainfall characteristics govern the factors affecting the removal efficiency. For instance, for the August 26, 2006 storm event (data not shown), where the rainfall intensity was highest at 15 mm/hr (48.5 mm rainfall), overflow occurred in the sedimentation tank, which resulted in a low removal efficiency value.
The swirl and filtration system evaluated in this study is one of the many types of BMP previously and currently employed for managing stormwater runoff in Korea. However, due to variable site and climatic characteristics, it is not easy to suggest a general management strategy for the control of (NPS) pollutants in stormwater runoff. For this reason, investigations on the efficiency of treatment facilities are required. While long term monitoring of storm events is best for eliminating the uncertainties and accurately predicting the efficiency of systems, this is laborious and costly. Thus, the appropriate determination of the EMC, which is a critical and commonly used factor in estimating the pollutant removal efficiency of a treatment system, is equally important. In this study, a modified EMC calculation method and a more precise pollutant removal efficiency method (ROR) were developed, with the inclusion of rainfall as a factor. Eventually, a standard method for calculating the EMC and pollutant removal efficiency should be used for uniformity and appropriate representation of various BMPs. Based on our results, the modified EMC and ROR methods were found to be significantly correlated to the existing methods, and proven to be appropriately feasible for application. Finally, the efficiency values attained in the study of the swirl and filtration system were only satisfactory. To effectively manage stormwater runoff, both the runoff quality and quantity should be addressed. This could be achieved by restoring the water circulation lost due to excessive urbanization and by incorporating filtration and infiltration processes or through pollutant uptake by plants. Further research is still needed to investigate and improve the pollutant removal efficiencies of these BMPs.