The Philippines is a country of almost 92 million people, with around 12 million people residing in Metro Manila [1]. Metro Manila, the National Capital Region (NCR), is the country’s main hub of all socioeconomic, industrial, cultural and political activities. Its economic zone produced a total gross domestic product (GDP) of 4.6% in 2008 and urbanization has increased by more than 50% over the past 20 years [2, 3]. While the NCR has the smallest area of the regions in the Philippines, it has the highest numbers of households (28% of the total) and manufacturing industries (46%). Metro Manila has the highest population density, at 16,497 person/km2, and most of its land area is limited for developmental expansion, with little or no area for agriculture [4].
Massive population growth, infrastructure development and increased economic activities after the World War II in 1940s led to the deterioration of the water bodies in Metro Manila. In 1990, ecologists had already pronounced the Pasig River as dead and incapable of sustaining marine life. As of 2003, four more rivers were formally declared by the Department of Environment and Natural Resources (DENR) as biologically dead; the Navotas-Malabon-Tenejeros-Tullahan (NMTT) River, Paranaque River, Marikina River and San Juan River. Apart from water lilies and janitor fish, hardly any life forms are able to survive its murky waters. Many of its tributaries are clogged by household garbage from Metro Manila. A steady horde of migration to the metropolis had resulted in over congestion and exploitation of land and its river. Increasing poverty in the rural areas has driven rural people to migrate to Metro Manila to seek better income opportunities. The river banks are the most logical areas for new settlements because many of the other squatter colonies in the metropolis are already overpopulated. From being a recreation venue and a source of food and livelihood, the river has become the dumping ground of informal settlers living along the banks of the river and its tributaries, as well as by almost all surrounding establishments [3]. The river is also the catchment basin of floodwaters from several tributaries from upstream areas of Metro Manila. Before pollution destroyed the aquatic ecosystem, Laguna de Bay and Manila Bay served as the habitat for 25 varieties of fish and 13 other different types of aquatic creature. However, only 6 species of fish and 2 types of plants that can tolerate the polluted water are currently left [3].
The Pasig River is an important river system since it connects two large water bodies in Metro Manila: Laguna de Bay(the largest fresh water lake in the country) and Manila Bay (the country’s main port of maritime trade and travel). The flow of the Pasig River through the urban areas comes from its upstream portion located in Laguna de Bay, then moves through the Napindan Channel and joins the Marikina River at the boundary of Pasig and Taguig. It links further with San Juan River and finally flows out into Manila Bay. It is approximately 27 km long,with an average width of 91 m, and depths ranging from 0.5-5.5 m. A stretch of the Pasig River has an average depth of 1.3 m. The deepest portions (4.5 m) are located between Guadalupe Bridge (GB) and C6 Bridge (CB), while the shallowest portion is at the mouth of Manila Bay. The annual average volume of water flowing into Manila Bay is 6.6 million m3. During low flow, from March to May, the discharge volume is 12 m3/sec, while high flow during October to November reaches 275 m3/sec [5]. The Pasig River is classified by the DENR as Class C, which is primarily intended for fishery, recreation and supply for manufacturing processes [6].
The strategic location of the Pasig River has made it and its tributaries, the San Juan River, Taguig-Pateros River and Marikina River, integral in the economic activity of the metropolis, providing the major means of transport, water sources for domestic and industrial uses, and a place for recreation and shelter to a large variety of fish and other aquatic life. As such, it is a vital ecosystem and an irreplaceable natural resource.
Currently, all of the waterways of Metro Manila are heavily polluted. Domestic waste accounts for about 60% of the total
pollution in the Pasig River, with the rest originating from industrial wastes (33%), such as tanneries, textile mills, food processing plants, distilleries, chemical and metal plants, as well as from solid waste (7%) dumped into the rivers. At present, Metro Manila is reportedly producing as much as 7,000 tons of trash per day [7]. Due to the continuous dumping of wastes, the river bed has become more and more silted with organic matter and non biodegradable garbage. This has resulted in serious flooding along the river, affecting nearby communities and carrying polluted water to the households close to the river.
Efforts to revive the Pasig River started in 1973, via the creation of the Pasig River Development Council (PRDC) and implementation of the Pasig River Development Program (PRDP) [8]. These were mainly concerned with the relocation of informal families and dredging of the silted portions of the river, relocation of two large sewers in Manila Bay and the construction of concrete railings along its banks. However, the PRDC and PRDP were abolished in 1987 due to lack of support. In 1993, an Environmental Partnership Program was created to encourage the industrial and business sectors to engage in environmental improvement activities, and advance self-monitoring and mandatory compliance with environmental standards [9].
In 1999, Pasig River Rehabilitation Commission (PRRC) was created to supervise, monitor plans, programs, projects and activities, and enforce rules and regulations towards the rehabilitation of the river. Activities to improve the water quality included:mandatory localized sewage treatment, setting up of communal sanitation projects for secondary sewage households, provision of credit support for the establishment of waste treatment plants, implementation of appropriate industrial relocation plan, expansion of community based solid waste management, garbage river-based collection through loading stations, and immense educational and training campaigns for the communities and industries near Pasig River. The control of domestic and industrial wastes was made possible through the World Bank-financed Manila Third Sewerage Project (MTSP). This project will increase treatment coverage to 30% in 2010, with an additional capacity for waste water treatment of more than 200 million L/d.MTSP will showcase the use of the Combined Sewer-Drainage System for the collection of wastewater from households [10].
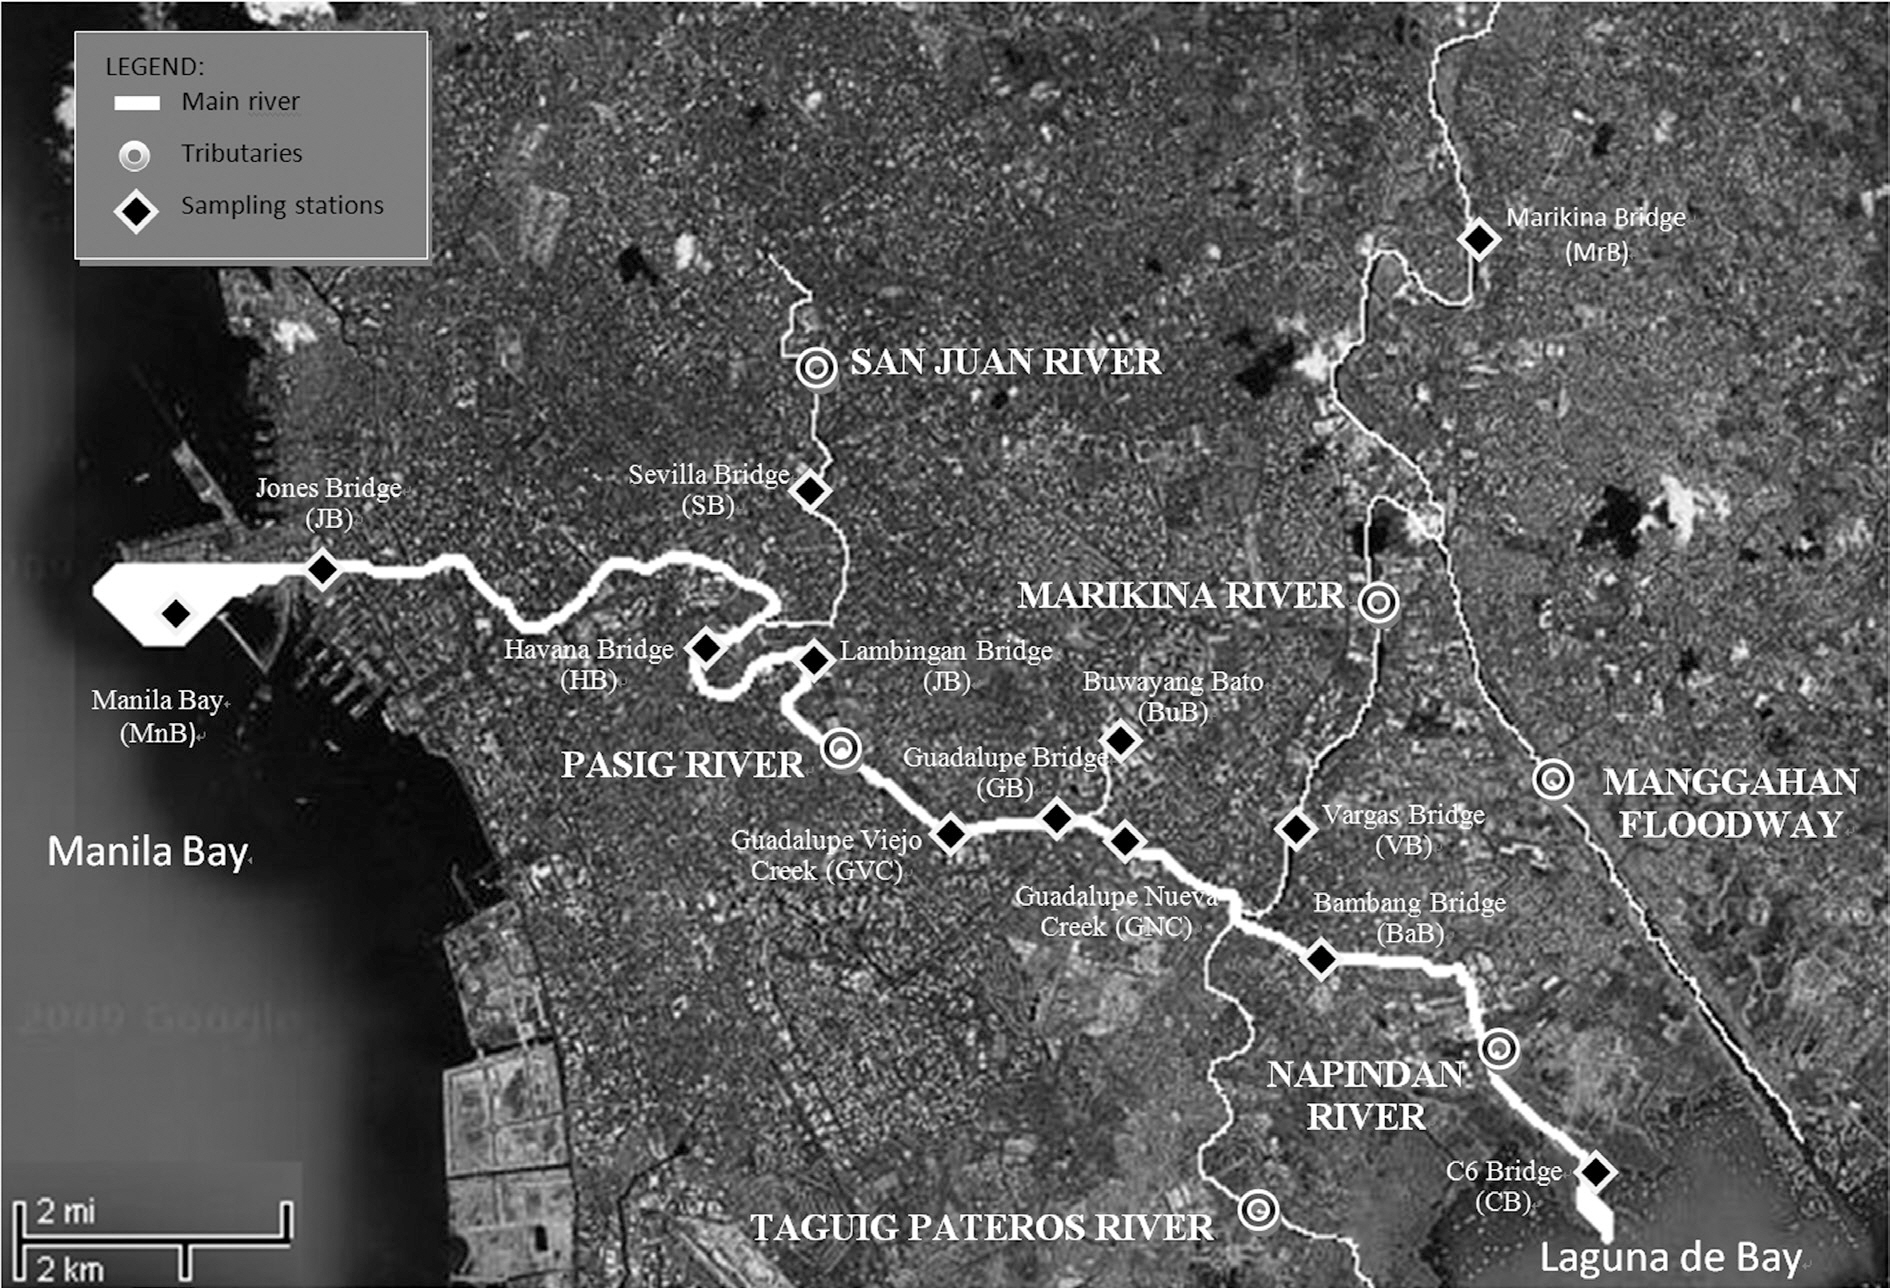
In compliance with the continuing mandamus of the Supreme Court to conduct and collect consolidated information or data on the existing condition of the water quality of the Pasig River, several government agencies, such as the PRRC, Environmental Management Bureau Central Office and National Capital Region, and Laguna Lake Development Authority, were tasked to conduct monitoring, sampling and analyses to serve as a basis for any appropriate actions required in saving the water quality of the Pasig River. In 2009, initiatives were undertaken to discuss the integration for a monitoring program for the Pasig River. These agencies agreed to monitor 13 sampling stations, named the Pasig River Unified Monitoring Stations (PRUMS). These stations, shown in Fig. 1, are located in GB, CB, Marikina Bridge (MrB), Vargas Bridge (VB), Bambang Bridge (BaB), Lambingan Bridge (LB), Sevilla Bridge (SB), Jones Bridge (JB), Manila Bay-Baseco (MB), Havana Bridge (HB), Guadalupe Viejo Creek(GVC), Guadalupe Nuevo Creek (GNC) and Buwayang Bato (BB).
Despite the efforts of the government to control the pollution in the Pasig River, the water pollution continues to worsen. This paper provides an overview of the current condition of the Pasig River. The existing water management policies were reviewed, and the issues and challenges hindering the improvement to its water quality identified. Moreover, the water qualities of the rivers of Metro Manila were compared to those of the major rivers in South Korea. The current watershed management system practiced by South Korea has also been discussed to serve as a guideline for future recovery of the water quality of the rivers in the Philippines.
The data used for the evaluation of the water quality of the Pasig River was obtained from the PRRC. The 13 monitoring stations selected by the agencies under PRUMS are shown in Fig.1. The stations were selected based on three factors: (a) commonalities of the different stations to each agencies, (b) area of the most affected section of the river and (c) consideration of the population and numbers of significant commercial and industrial discharges. The samples for the monitoring program for 2009 were collected on the 11th and 24th days of February and March, and the 1st Wednesday from April to December. The dissolved oxygen (DO), pH, and temperature were measured in the field with portable meters. The water samples were transported to the laboratory, where they were analyzed for biochemical oxygen demand (BOD), nutrients, oil and grease, total suspended solids (TSS), total coliforms and heavy metals, according to the standards in the DENR Water Quality Monitoring Manual.
Measurements of the physical attributes of the river and the pollution levels were taken at regular intervals. The data gathered were processed by the Mike 11 system model, which simulates the river and its flow based on mathematical equations, from which the experts may be able to predict high water levels in the river or simulate the flow of a large volume of water from one end of the river to the other, together with the levels of pollution in the river under the simulated conditions [3].
3.1. Water Quality Characteristics and Pollution Sources
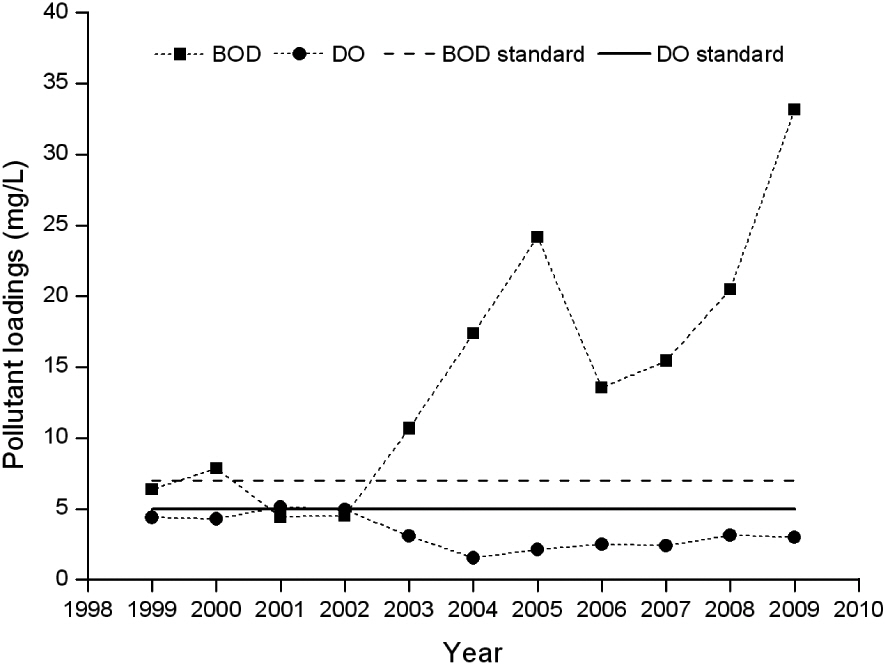
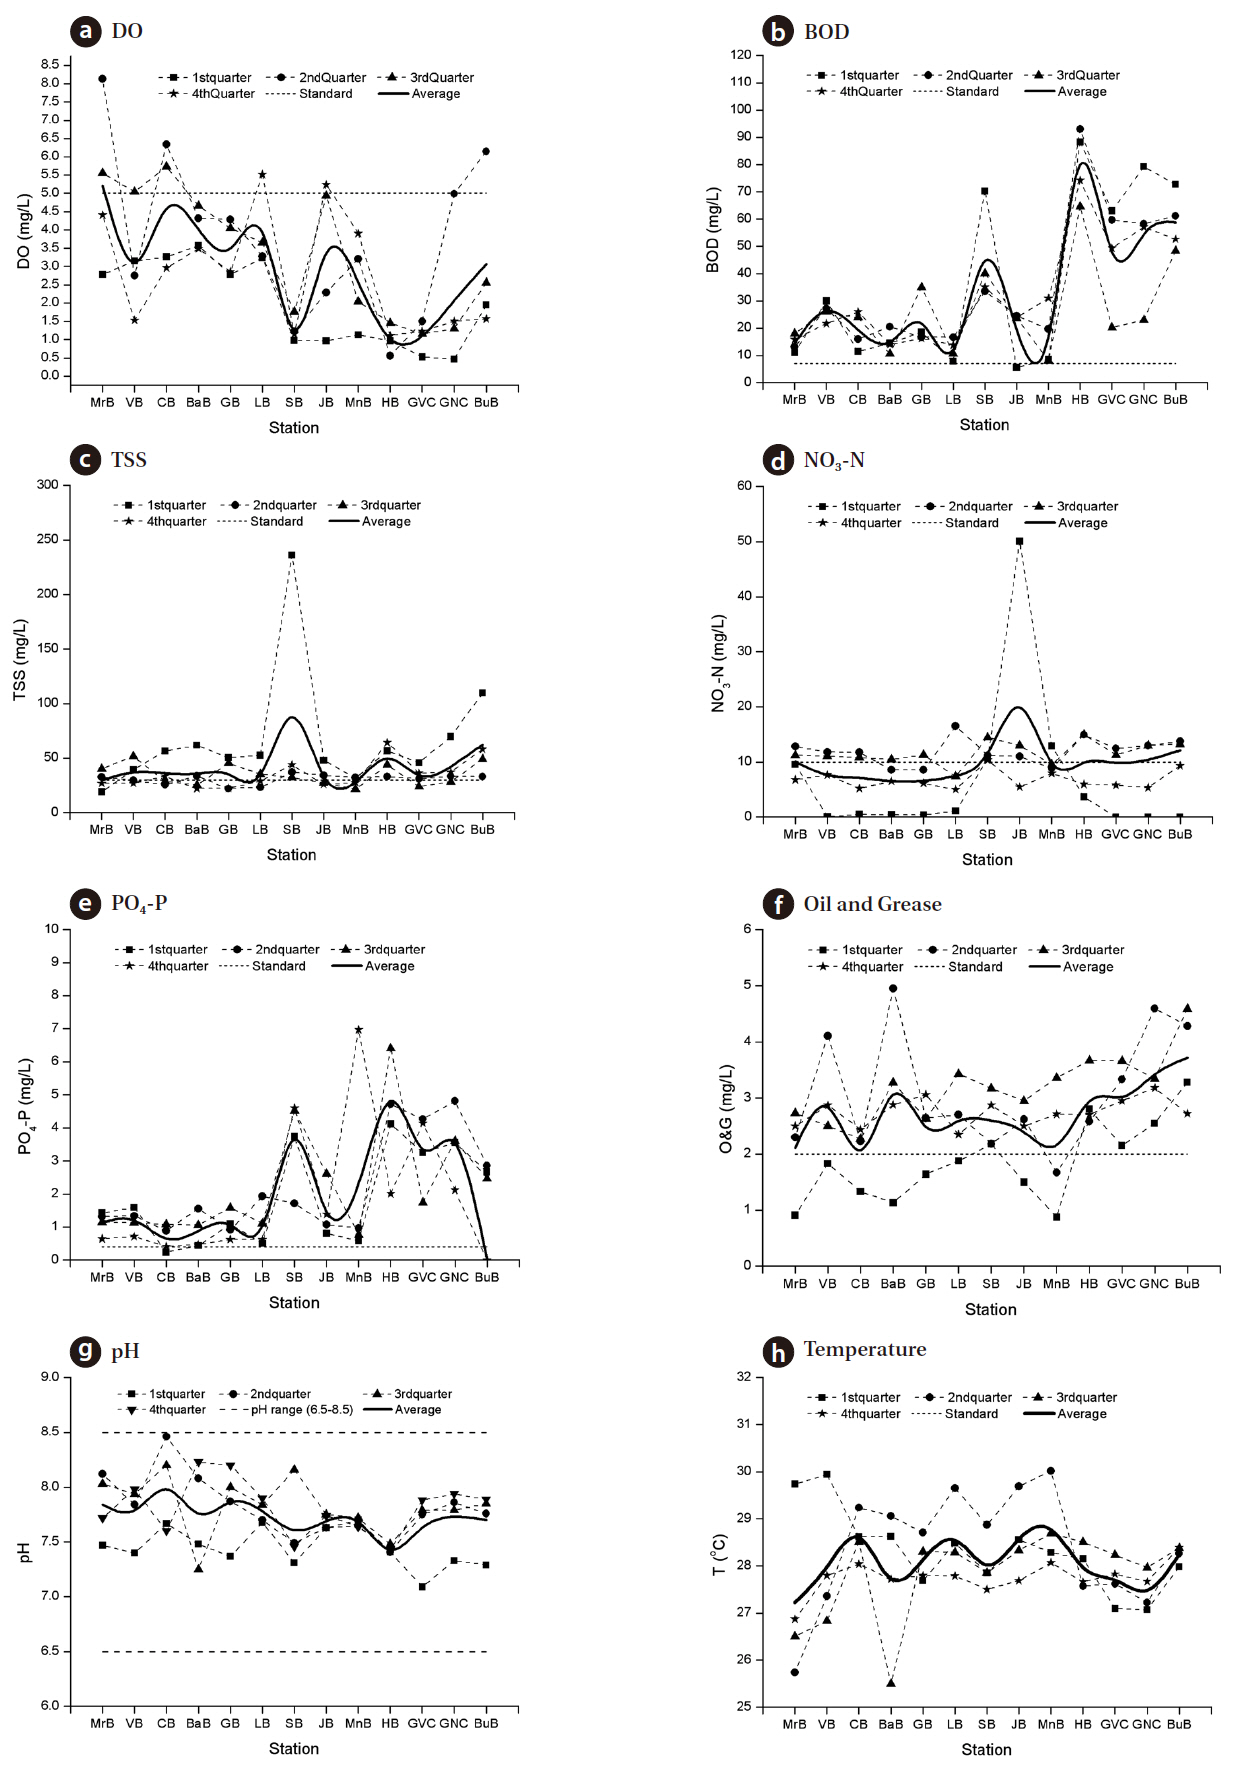
Fig. 2 shows the water quality of the Pasig River from 1999 to 2009. The figure clearly shows that the Pasig River was very polluted, as it failed to meet the DENR standard levels of 5 and 7 mg/L for DO and BOD, respectively. In 1990, 295 tons per day of BOD was discharged via domestic (44%), industrial (45%) and solid (11%) wastes. From the time when the PRRC was established, the water quality has improved. In 2000, the total BOD loading was reduced to 240 metric tons per day, but the trend continued to deteriorate over the subsequent years. The highest BOD loading recorded for the Pasig River was in 2009. Fig.3 presents the water quality characteristics of the PRUMS for the 1st (February and March), 2nd (April to June), 3rd (July to September) and 4th quarters (October to December) of 2009. Parameters, such as DO, BOD, TSS, nitrate-nitrogen (NO3-N), phosphate (PO4-P), and oil and grease failed to meet the standards of the DAO 90-34 water quality criteria for Class C waters in almost all quarters of 2009.
Low DO levels are the result of the high discharge of domestic and industrial wastes in the area [11]. In 2003, 58% (192,000 t) of the BOD loading in Metro Manila was generated by domestic waste, while the remaining 42% (138,000 t) was from industries[4]. It is estimated that 148 t of BOD per day are added to the river purely from the sewage outlets scattered along its banks[3]. It is apparent in Fig. 3 that the DO and BOD concentrations
were at their maxima during the 1st quarter, with the highest value obtained at HB during the 1st quarter. During the rainy months; June to December each year, fish from Laguna de Bay are carried by the floodwaters to the Pasig River. The flushing effect of the increased water levels in Laguna de Bay increases the DO content of the river to a level that increases its potential for some aquaculture activities. Unfortunately, during the dry summer months; March to May, the river is virtually dead due to the water becoming stagnant with the much reduced flow [3].
TSS levels were noticeably high in SB during the first quarter of 2009. A lot of solid particles were found in water, such as silt, decaying plants, animal matter, and domestic and industrial wastes. The majority of the sampling stations reasonably met the NO3-N criterion, while the PO4-P and oil and grease levels were markedly high. According to the records, the textile and food manufacturing industries are the greatest water polluters from the industrial sector. There are approximately 4.4 million people living in the Pasig River catchment area, with only 0.6 million (12%) serviced by the sewerage system that treats domestic wastewaters before their discharge. Untreated wastewaters from the remaining 88% of the population flow through canals into viaducts leading into the river. Having a tropical setting, the water temperature in the sampling stations varied from 27-29℃ throughout the year. Aside from domestic and industrial wastes, solid wastes have contributed to the increase of pollutants in the Pasig River. Although very little, about 30 t of BOD per day, solid wastes block the penetration of sunlight to underwater plant life, the solid waste that sinks to the river bed suffocates the existing aquatic life.
It is important to mention that the Pasig River is a very poor and degraded water body that is unable to cope with and balance the rapid urban growth. The water is stagnant, black and stinking, and the bed seems to be devoid of any slope. The lack of a sewage system and the overflow of sewage caused by frequent heavy rain introduce a large amount of sewage in the whole river. The drainage system in river tributaries has been choked due to high siltation and the dumping of garbage, including nonbiodegradable wastes. Slums are concentrated along the banks of the river, with wastes from the dwellers aggravating the pollution problems of both the canals and river environment.
3.2. Comparison with South Korea
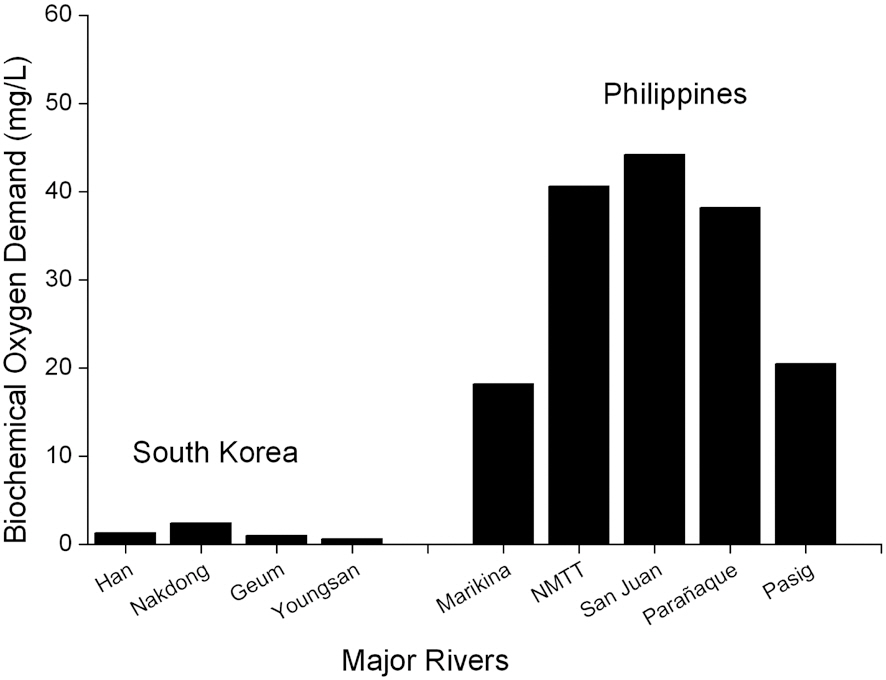
Fig. 4 shows the comparison of the water qualities of the four major rivers of South Korea (Han River, Nakdong River, Geum River and Youngsan River) and the five rivers of Metro Manila (Marikina River, NMTT River, San Juan River, Paranaque River and Pasig River) in 2008. The water sources of the four major rivers had BOD levels of 1-2 mg/L, while the Metro Manila Rivers had average BOD concentrations ranging from 18-45 mg/L. The rivers of South Korea have passed the Ministry of Environment’s (MOE) water quality criteria at the level IB grade, classifying its water ecosystem as being in good condition, with high DO levels and few pollutants, and fit for residential use after a general purification process. Efforts are still being made by the MOE to attain the Level IA grade, in which ecosystems are in excellent condition, with no pollutants and high concentrations of DO. Conversely, the rivers of Metro Manila have failed to pass the DENR criteria, being very polluted and incapable of sustaining aquatic life forms.
The deterioration of water resources as a result of rapid industrialization, urbanization and population growth have been
a problem in South Korea. In 1998, the Total Water Pollution Load Management System (TWPLMS) was implemented as a comprehensive measure to control the quantitative increase of the pollution load. The TWPLMS set standard for the total amount of pollutant emissions from business establishments to achieve a target water quality and secures sustainability in environmental protection, without sacrificing its economic development[12]. Other watershed management practices were also implemented, such as the designation of buffer zones, a land purchase system and a water use charge system. A Riparian Buffer Zone and Land Purchase System were formed by buying, through the consent and agreement with residents, the lands adjacent to the watersheds. Following the designation of an area, the discharges from pollutant sources must only be allowed after they have been processed to attain BOD and SS levels below 10 mg/L. To raise money to support the water management practices, a Water Use Charge system was implemented, where the end user of purified water or water that has been directly collected from public water must pay a charge for the total amount of water used. The country strongly focuses on pollution source management, concentrating on industrial wastewater management and the management of non-point pollution sources. Also, the country concentrates on preserving and restoring the water ecosystem via ecological stream restoration, as well as lake, estuary and lagoon water quality management.
The success of its policy making and implementation has allowed the MOE to achieve its goal on restoring the water quality of its rivers. For Metro Manila, the incessant deterioration of the water quality of its rivers is an effect of its failure to adopt an integrated and holistic approach in addressing the inherently interrelated issues for the development and management planning, implementation and operation of water pollution control, as well as watershed and groundwater protection. The major constraints and challenges will be discussed further in the next section.
3.3. Challenges of Current Water Management
Even with the management programs and strategies of the Philippine government, the water quality in the rivers of Metro Manila, specifically the Pasig River, continue to deteriorate. The problem lies with insufficient funding, which has resulted in weak institutional implementation, outdated plans and investigations, and the lack of water and sewage infrastructures. Environmental degradation and water-related disasters have also affected the water quality of the rivers. The Philippines is a developing country, and the budget allocated for improving the water quality of its aquatic ecosystem is insufficient. Support from investors and its residents is a huge factor. Over the last two decades, capital expenditure on the water and sanitation sector has fluctuated around P3-4 billion a year, which has been almost entirely allocated to water [13]. The unwillingness of the users to pay for sanitation services has made it difficult for the government to expand their investments. Sanitation services are currently supported by a mandatory environmental charge,equal to 10% of the water charge, paid by all water consumers. A sewerage charge of 50% was levied when a household connected to a separate sewerage system. As households are unwilling to pay the additional 50% charge, concessionaires have failed to meet the connection targets [14]. Because of this, a lot of discharged wastes are not properly collected and treated. The budget to construct more and advanced wastewater treatment facilities has also been insufficient. The riverbanks have become heavily congested with squatter communities. Efforts from the government to relocate these illegal settlers have been unsuccessful due to the lack of cooperation and adequate relocation sites. Many illegal settlers have complained that the relocation sites were too far away and unable to provide them with a livelihood. Most of the watersheds in the Philippines are in a critical condition, as manifested from recent and recurring calamities,such as flashfloods, with the greater frequency of El Nino reducing the water levels in dams. The chronic shortage of water supply in Metro Manila and the countryside has placed increased recognition of the adverse effects of man’s activities on the watersheds at the forefront, which has caused erosion and siltation problems in the country’s rivers, lakes and reservoirs [15]. Furthermore, funding for vital research and studies for the creation of additional water management policies has been insufficient.
Water is a major constituent of every organism and; thus, the most important resource to man. Rivers in Metro Manila are not only a good source of water and food, but also provide access to trade and transport. Metro Manila, being the Philippines capital and home to many houses, business establishments and industries, is the most urbanized region in the Philippines. In 1990, the government declared the Pasig River, the most important river system in Metro Manila, biologically dead due to the rapid industrialization and urbanization within the area, which poses threats to Laguna Bay (the largest freshwater lake in the country) and Manila Bay (the country’s main port of maritime trade and travel), since it serves as a two-way connector between these two water bodies. Despite the efforts of the government to control the water quality of the Pasig River, its condition continues to worsen. The data obtained from the Pasig River indicate that the target water quality for Class C waters have not been achieved since 2003. The main problem when addressing water quality problems is insufficient government funding. The lack of monetary resources had resulted in the weak implementation of government projects. The government has not been able to provide enough wastewater facilities to treat huge discharges coming from domestic, industrial and solid wastes, with the majority of these wastes being discharged directly into the river without proper treatment. Another factor is the lack of support from residents living in Metro Manila to cooperate with projects and mandates. Aside from these factors, natural disasters, such as floods and droughts, have constantly plagued the country. The MOE of South Korea has improved the water quality of its major rivers over the past few years by transforming its previous policies to a more innovative watershed management system by forming partnership with watershed members to finance government supported projects with watershed management funds. As a result, the government introduced effective policy measures to achieve comprehensive watershed management -the designation of buffer zones, the land purchase system, the total pollution load management system, financial support for the applicable residents, and the water use charge system. In the Philippines, effective solutions to resolve the conditions of its water quality management cannot be found without the participation and cooperation of its residents. The government must be able to build real watershed communities through efforts of both local government and its watershed members. The government needs to listen to its residents and reflect their opinions on the government’s watershed management policies; whereas, the residents should endeavor to resolve their own water resource problems. With that in mind, the residents of Metro Manila would be able to bring back the once pristine waters of the Pasig River and many other water bodies.