The effects of low impact development (LID) techniques, such as green roofs and porous pavements, on the runoff and pollutant load from an apartment complex were simulated using the Site Evaluation Tool (SET). The study site was the Olympic Village, a preexisting apartment complex in Seoul, South Korea, which has a high percentage of impervious surfaces (approximately 72% of the total area). Using the SET, the effects of replacing parking lots, sidewalks and driveways (37.5% of the total area) having porous pavements and rooftops (14.5% of the total area) with green roofs were simulated. The simulation results indicated that LID techniques reduced the surface runoff, and peak flow and pollutant load, and increased the evapotranspiration and soil infiltration of precipitation. Per unit area, the green roofs were better than the porous pavements at reducing the surface runoff and pollutant loads, while the porous pavements were better than green roofs at enhancing the infiltration to soil. This study showed that LID methods can be useful for urban stormwater management and that the SET is a useful tool for evaluating the effects of LID on urban hydrology and pollutant loads from various land covers.
South Korea (hereafter, Korea) has experienced rapid urbanization in recent decades. Lee [1] reported that the rate of urbanization in Korea rose from 35.8% in the 1960s to 86.5% in 2005. Urban spaces in Korea have a very high percentage of impervious areas compared to similar spaces in other countries. Impervious surfaces are estimated to cover approximately 87% of residential, 92% of commercial, and 84% of industrial developments in Korea [2] Urbanization decreases infiltration and increases surface runoff, peak flow and the magnitude of flooding [3]. Reduced infiltration may decrease groundwater recharge and stream baseflow [4]; furthermore, hydrological alterations caused by urbanization contribute to stream channel degradation and increased non point sources of pollution.
Recent research has demonstrated the successful use of low impact development (LID) strategies for managing the hydrology in urban areas. LID is a relatively recent stormwater management technique, which mimics the predevelopment site hydrology using integrated management practices (IMPs), such as bioretention, dry wells, filter strips, grass swales, infiltration trenches, permeable pavement, rain barrels, soil amendments, tree box filters, vegetated buffers and green roofs [5]. Schneider and McCuen [6] reported that the use of rain barrels can effectively reduce peak discharge during small storms. Meanwhile, Brander et al. [7] concluded that infiltration techniques were very effective for reducing runoff in a development area. Passeport et al. [8], Li et al. [9] and Hunt et al. [10] evaluated the effects of bioretention on the hydrology and pollutant removal. Moran[11] reported that a green roof retained approximately 60% of the total recorded rainfall and 85% of the average peak flow during a nine-month observation period, but the nutrient concentrations in the runoff from a greenroof were higher than those in the control roof, which was the result of leaching from the soil media. Hood et al. [12] experimented with LID techniques and illustrated their effective reduction of runoff and peak discharge, as well as runoff lag times and thresholds compared with traditional stormwater management practices. A number of researchers have developed models for LID design and evaluation.Prince George’s County [5] reported on a hydrological analysis of LID, and Jeon et al. [13] developed LIDMOD for LID modeling based on the method proposed by Prince George’s County. The Site Evaluation Tool (SET), developed by Tetra Tech, Inc., was designed to aid in assessing development plans and LID techniques, and to determine best management practices (BMPs) for the reduction of the impact of urban stormwater.
In this study, the SET was used to model the effects of porous pavements and green roofs on the urban hydrology and pollutant loads from an apartment complex, with the applicability of these LID techniques evaluated for apartment complex developments.
2.1. Site Evaluation Tool
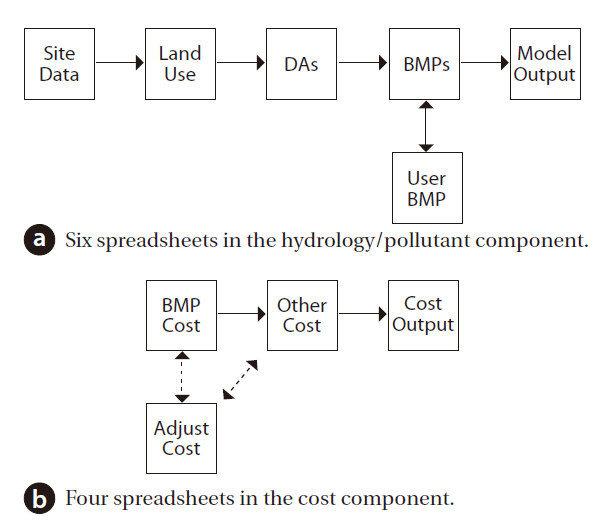
The SET is a Microsoft Excel spreadsheet-based tool designed to aid in the assessment of LID methods and available IMPs [14], which was developed by Upper Neuse River Basin Association and Tetra Tech, with funding from the NC Division of Water Quality, USA, and is obtainable on the SET website [15]. The SET can be used as a screening tool to evaluate various site designs to help achieve the water quality goal of a site in a cost-effective manner [16]. The SET consists of two main components: the hydrology/pollutant component and the cost component (Fig. 1). The hydrologic balance is given in the SET as follows:

where

where

where

where L is the total load, LR the load from the runoff and

where
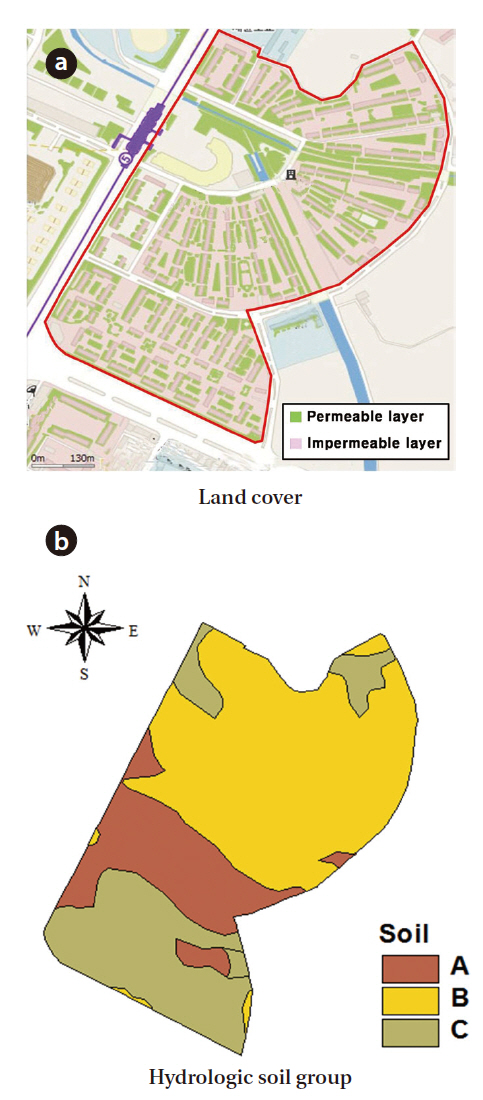
The study area was the Olympic Village Apartment Complex(41.4 ha), located at Sonpa-gu, Seoul, Korea (Fig. 2). Table 1 lists
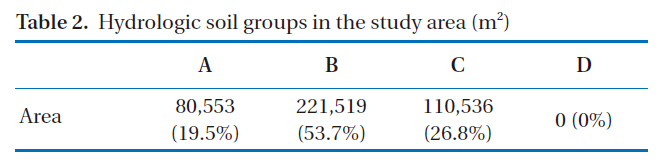
the land cover in the study area, obtained from 2009 Daum-Mapⓒ data [17]. The study area was highly impervious (approximately 72%), with about half of the impervious area being parking lots. Hydrologic soil group data, in GIS shape-file format,were obtained from the National Institute of Agricultural Science and Technology. Soils in the study area generally drained well, with 19.5% for hydrologic soil group A, 53.7% for hydrologic soil group B and 26.8% for hydrologic soil group C (Table 2).
The annual average precipitation from 1971-2000, as reported by the Korea Meteorological Administration [18], was approximately 1,429.6 mm, with considerable seasonal variation caused by the Asian monsoon. The annual average temperature, relatively humidity and wind speed were 12.2℃, 66.9% and 2.4 m/sec, respectively. Table 3 gives the probable amounts of precipitation at the Andong rain gauge station, which was used to estimate the peak flow and runoff volume during storms using the LID techniques.
The runoff volume and peak flow in the SET simulation were estimated using the SCS-CN method. Although the CN values were obtained from long-term experimental data, they sometimes required calibration, as they greatly depend on the field conditions, even for the same land use and soil type [19].
To obtain more accurate simulation results, regionalized CN values for Korea, which were globally optimized for 10 watersheds during a 20-year period, were used in the SET, which are listed in Table 4.
[Table 1.] Land cover in the study area
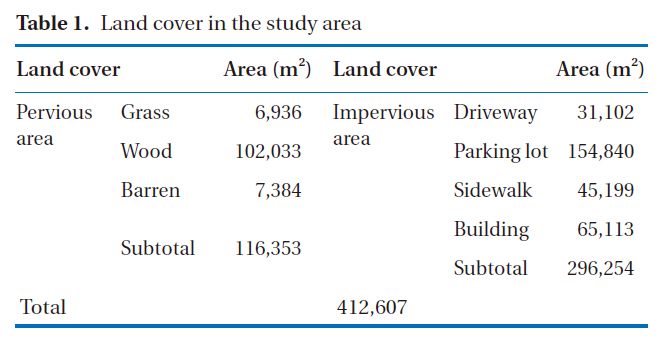
Land cover in the study area
[Table 2.] Hydrologic soil groups in the study area (m2)

Hydrologic soil groups in the study area (m2)
[Table 3.] Probable amounts of precipitation at Andong rain gauge station (mm) [1]
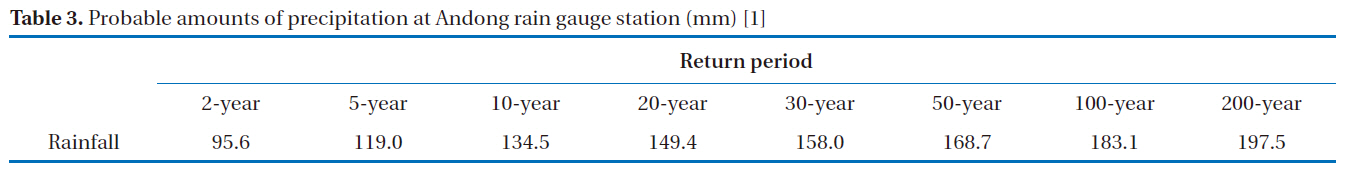
Probable amounts of precipitation at Andong rain gauge station (mm) [1]
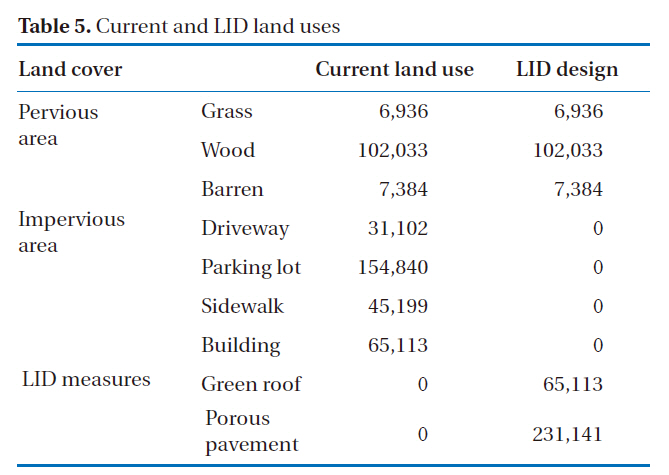
This study evaluated two LID measures: green roofs and porous pavements. Green roofs covered with vegetation may retain stormwater and buffer nose [21]. Porous pavements may reduce the peak flow and runoff volume by enhancing water storage and infiltration into the soil; this system is best applied to areas where vehicular traffic is minimal, such as parking lots and sidewalks [21].
In this study, the effects of replacing all the apartment rooftops with green roofs and all the sidewalks, parking lots and driveways within the apartment complex with porous pavements were simulated. Table 5 lists the current land uses and those under the LID design.
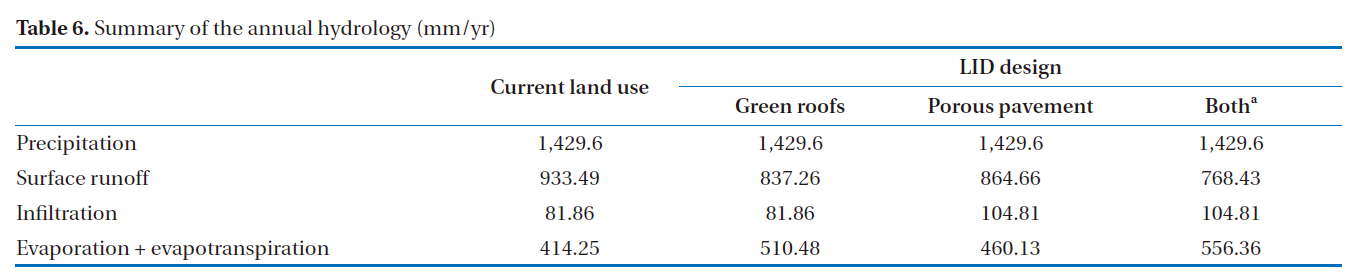
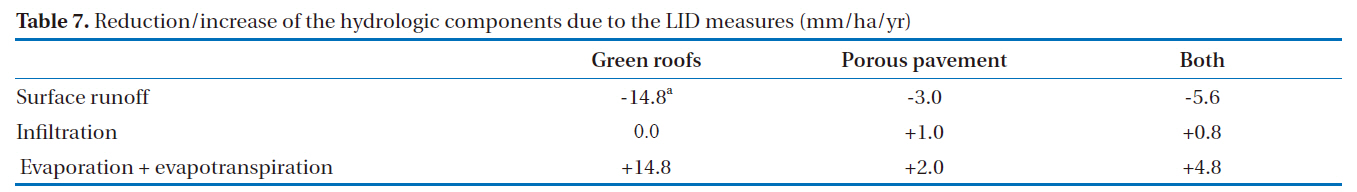
Table. 6 and 7 provide summaries of the annual hydrology and the rates of reduction or increase in the hydrological components,respectively. The simulation indicated that the LID measures could reduce surface runoff and increase evapotranspiration and infiltration. The green roofs were found to reduce surface runoff and increased evapotranspiration, while the porous pavements were more effective than green roofs at increasing infiltration into the soil. The current surface runoff and current infiltration could be reduced by approximately 18% and increased by about 28%, respectively, using the combination of the two LID techniques.
[Table 4.] CN values used in the SET [20]
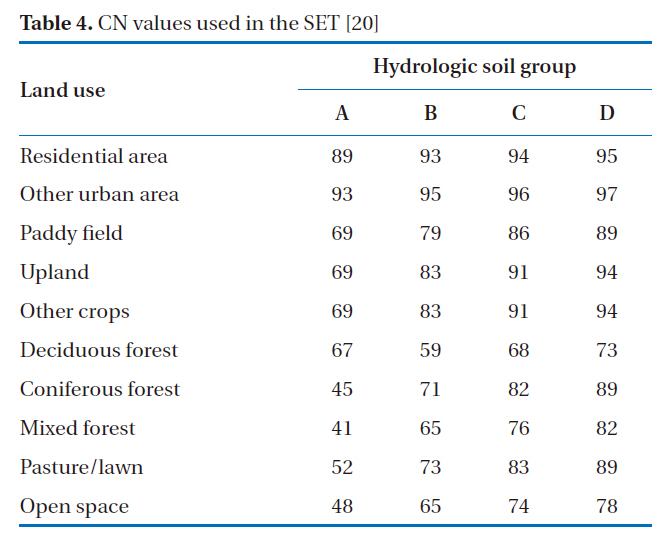
CN values used in the SET [20]
The simulated runoff and storage volumes for 2-year 24-hour storm events under the LID measures are summarized in Table 8. The simulated storage volumes for green roofs, porous pave
[Table 5.] Current and LID land uses

Current and LID land uses
[Table 6.] Summary of the annual hydrology (mm/yr)

Summary of the annual hydrology (mm/yr)
[Table 7.] Reduction/increase of the hydrologic components due to the LID measures (mm/ha/yr)

Reduction/increase of the hydrologic components due to the LID measures (mm/ha/yr)
[Table 8.] Summary of the runoff volumes for 2-year 24-hour storm events (m3)
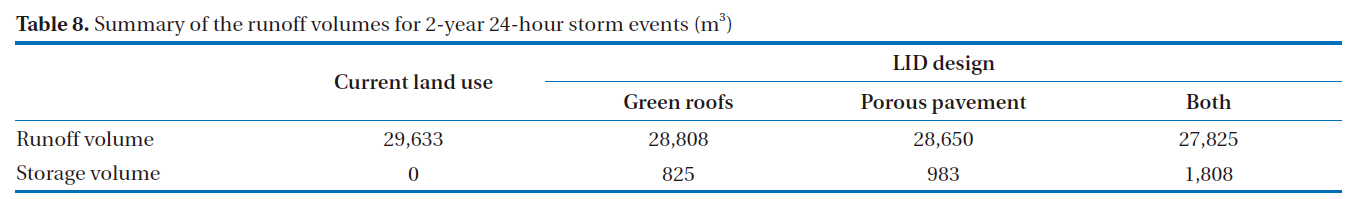
Summary of the runoff volumes for 2-year 24-hour storm events (m3)
[Table 9.] Peak flow during simulated storm events (m3/s)

Peak flow during simulated storm events (m3/s)
ments and the combination of both LID measures were 825,983 and 1,808 m3, respectively
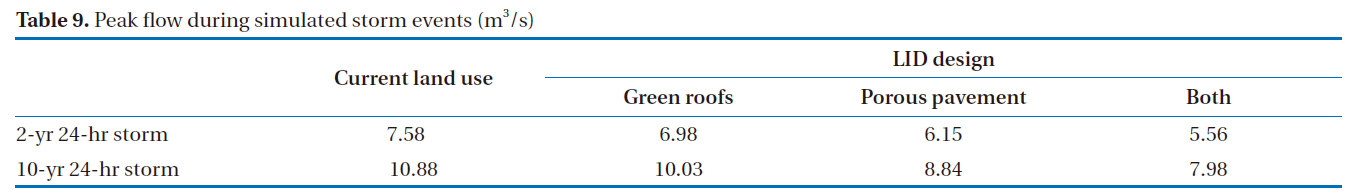
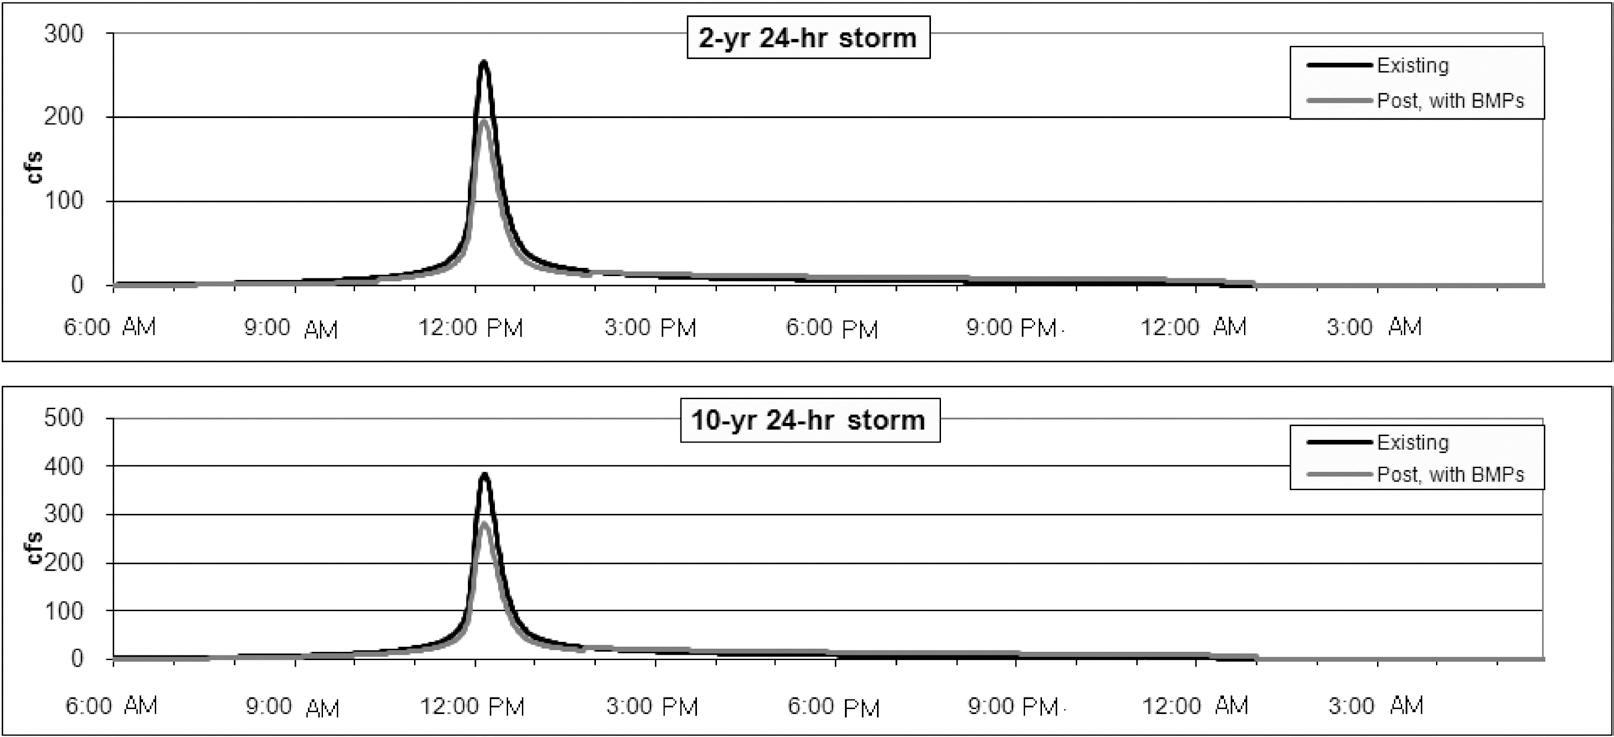
Table 9 lists the peak storm flows under the LID measures, and Fig. 3 presents hydrographs for the current land use and the LID system of green roofs and porous pavements. The peak flows for the current land use for 2-year and 10-year 24-hour storms were estimated to be 7.58 and 10.88 m3/s, respectively. In the SET simulation, the peak flow was reduced by approximately 8% by the green roofs, 19% by the porous pavements and 27% by the combination of green roofs and porous pavements.
3.3. Pollutant Load Simulation
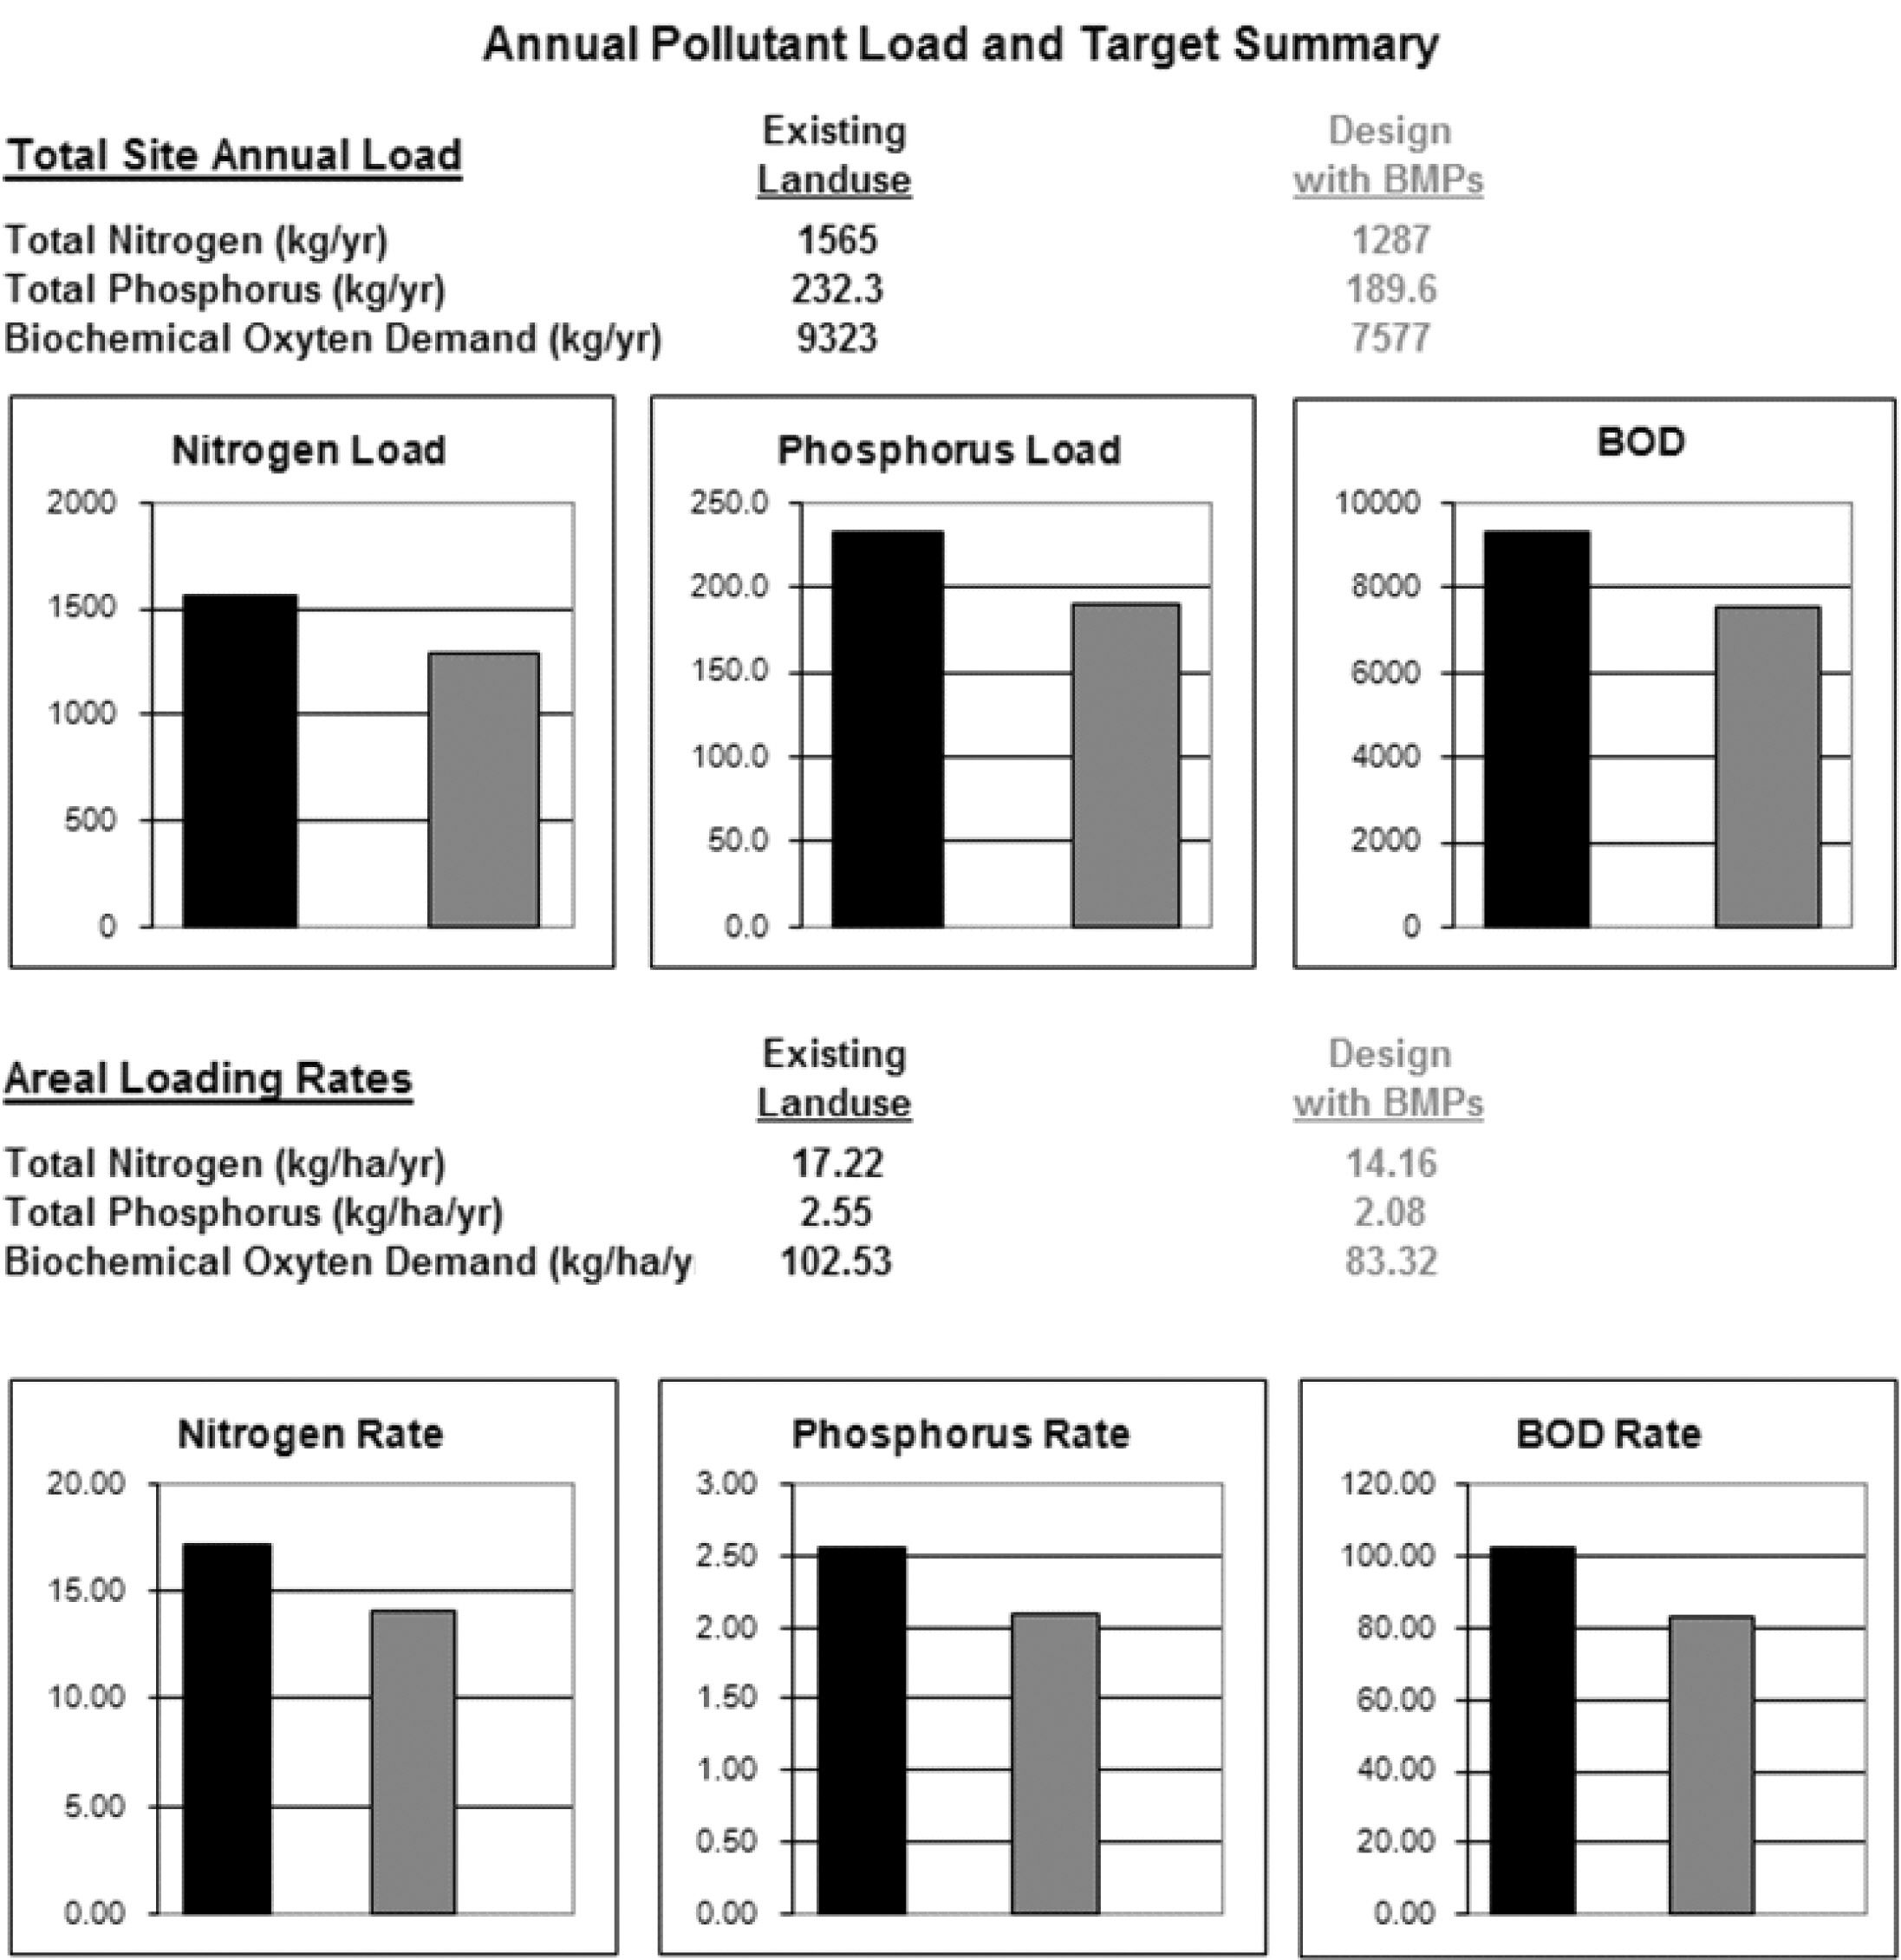
Modeled annual pollutant loads from various land covers are given in Table 10 and Fig. 4. Porous pavements and green roofs reduced the pollutant load by decreasing the surface runoff volume. Pollutant loads from the current land use were 9,323 kg/yr for biochemical oxygen demand (BOD), 1,565 kg/yr for total nitrogen (TN) and 232 kg/yr for total phosphorus (TP). These loads were reduced by 11% with green roofs, 7% with porous pavements and 18% with the combination of both LID systems.
[Table 10.] Annual pollutant loads under the current and LID land uses
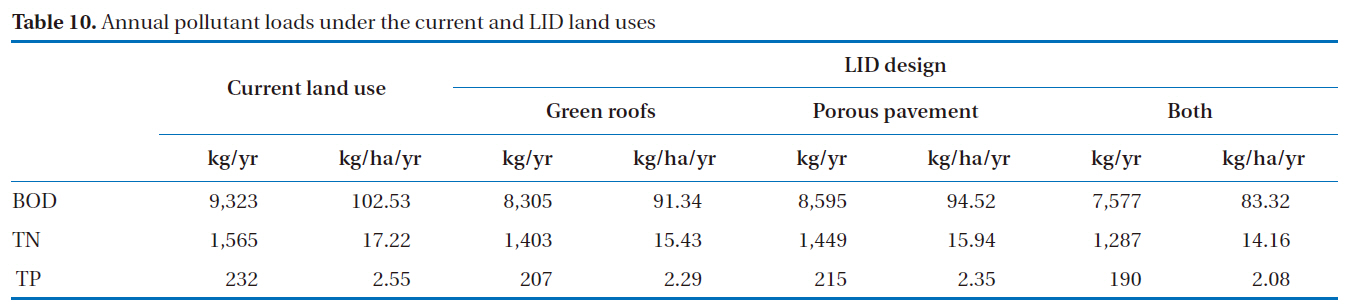
Annual pollutant loads under the current and LID land uses
Considering the area of each LID measure, as given in Table 5, green roofs could more effectively reduce pollutant loads from the study area than porous pavements.
The SET has been designed to evaluate LID techniques. This study used the SET to evaluate the effects of green roofs and porous pavements on the surface runoff and pollutant loads for an apartment complex in Seoul, Korea. The results of the simulation indicated that the LID measures reduced the surface runoff and peak flow, but increased infiltration and evaporation. The increased soil infiltration could contribute to groundwater recharge and raise the level of the water table; thus, help to maintain base flow and supporting stream ecology. Per unit area, the green roofs out performed porous pavements at reducing the surface runoff and pollutant loads. However, porous pavements were better than green roofs at increasing infiltration into the soil and groundwater recharge. The results indicated that LID techniques can be used to help prevent urban flooding and erosion, as well as help maintain the ecological integrity of streams by controlling peak flow. Overall, the SET was useful for evaluating the effects of LID measures on the hydrology and pollutant loads. The application of LID measures is recommended for the management of water quality and preserving aquatic living resources and ecosystems in areas undergoing development.

![The two main components and required spreadsheets of the Site Evaluation Tool [16]. BMP: best management practice.](http://oak.go.kr/repository/journal/10307/E1HGBK_2010_v15n3_167_f001.jpg)

![Probable amounts of precipitation at Andong rain gauge station (mm) [1]](http://oak.go.kr/repository/journal/10307/E1HGBK_2010_v15n3_167_t003.jpg)
![CN values used in the SET [20]](http://oak.go.kr/repository/journal/10307/E1HGBK_2010_v15n3_167_t004.jpg)