Due to the acceleration of global warming and the stress that population growth has placed on the global water supply, the desalination of seawater via reverse osmosis (RO) has shown promise as a technology for overcoming the stress on water resources. However, membrane fouling is a common problem, as it causes flux decline, demands frequent cleaning and consumes a large amount of energy, resulting in a shortened lifespan of the system [1]. Among the types of fouling material, severe biofilm formation by variable bacteria, called biofouling, is the most difficult to control. It was reported that 58 of 70 RO membrane and about 70% of the seawater RO membrane installations surveyed in U.S. suffered from biofouling problems[2, 3]. To avoid or reduce the biofouling on the membrane, a deeper understanding of uncontrollable biofouling is critical.
In an attempt to address this issue, a number of studies have focused on measuring the densities of biological matter [4]. About 1 × 10⁷ cells per cm2 of fouled RO membrane surface was observed, with bacteria, such as
Based on our previous studies, the approach using
2.1. Characteristics of Seawater Sample
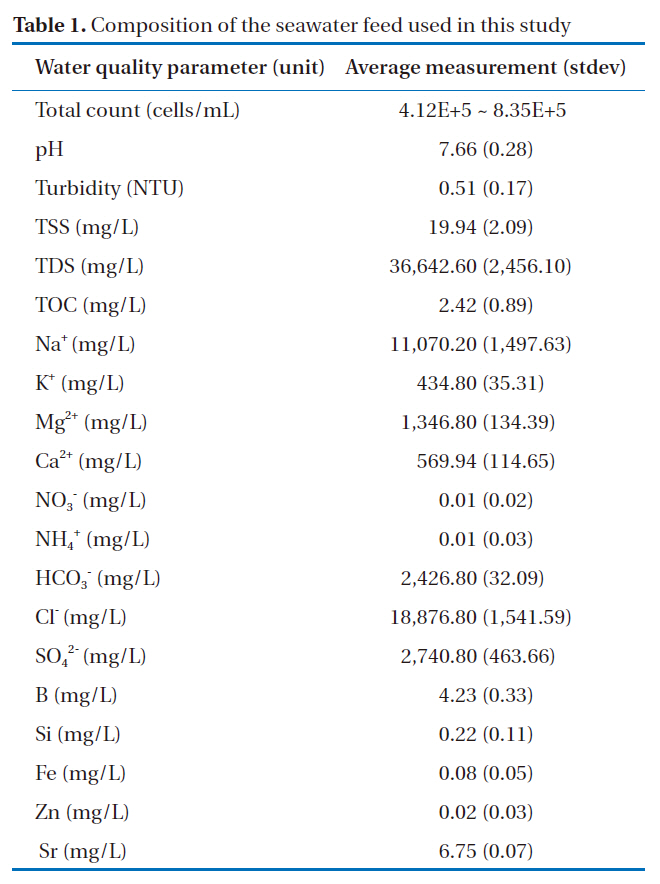
The seawater was sampled from what will be the intake to a seawater reverse osmosis (SWRO) desalination plant (longitude 35°13’32N; latitude 129°14’37N) due to be constructed in 2011 in Korea through the seaHERO R&D program supported by the Ministry of Land, Transport and Maritime Affairs [15]. Water was taken from 7 meters below sea level. The seawater quality data, regularly acquired in 2008 and 2009, are presented in Table 1, and were observed to be fairly consistent. It should be noted that the cell densities in the collected samples were not relatively high compared to those observed in other studies; for example,
[Table 1.] Composition of the seawater feed used in this study

Composition of the seawater feed used in this study
bacterial cells in the northern Gulf of Mexico ranged from 0.4 ×10⁶ cells/mL offshore to 1.0 × 10⁶ cells/mL inshore [16].
An untreated seawater sample was used for the isolation of bacteria, including sporogenous
2.2. Isolation of Bacillus sp. from the Seawater Sample and Sequencing
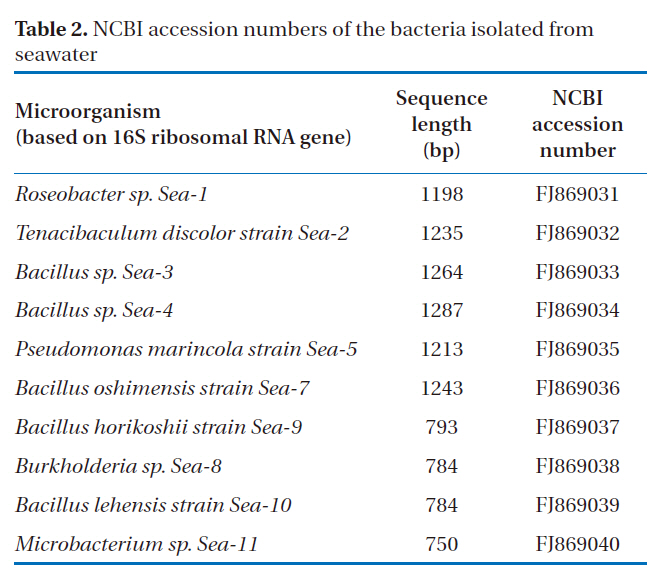
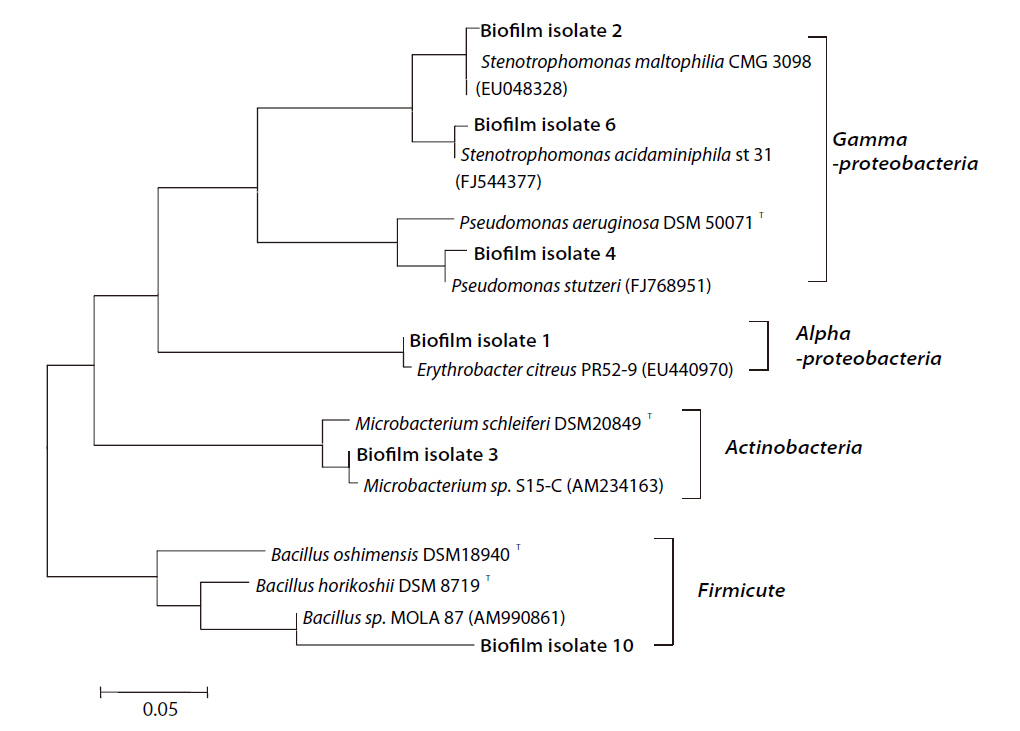
For the isolation of the bacteria from the seawater sample, the following membrane filtration technique was used. After filtering through a 0.45 ㎛ pore-size cellulose acetate membrane, the cells remaining on the filter were transferred to a marine agar plate (Difco 2216) and incubated at 37℃ until individual colonies were grown. Each colony was then genetically identified by sequencing of the amplified 16S rRNA gene. For amplification, a universal bacterial primer set, forward primer 9F (5’-GAG TTT GAT CCT GGC TCA G-3’) and reverse primer 1512R (5’-ACG GHT ACC TTG TTA CGA CTT-3’) was used [12]. In total, 37 strains were purified, with 7 of these isolates deemed to be close to
2.3. Operation of RO Membrane Module and Biofilm Formation on RO Membrane
Two distinct sets of experiments were performed, based on fouling protocols, using a lab-scale crossflow membrane test unit (Sepa CF II; GE Osmonics, Minnetonka, MN, USA). The fouling protocols can be roughly summarized into two main categories. One being a disinfecting RO test unit before applying the fouling protocol (Case I), with the other being an omitting disinfection of an RO test unit (Case II). For the Case I experiment, the lab-scale crossflow membrane test unit was disin-
[Table 2.] NCBI accession numbers of the bacteria isolated from seawater

NCBI accession numbers of the bacteria isolated from seawater
fected with 0.5% sodium hypochlorite, 5 mM ethylene diamine tetra acetate (EDTA), 2 mM sodium dodecyl sulfate (SDS), 95%ethanol and deionized (DI) water [17] prior to the addition of the Bacillus foulants into sterilized seawater feed. In the second set of experiments (Case II), the test unit was cleaned with DI water only, with biofilm formation then carried out in the same manner as in Case I.
A flat sheet polyacrylamide RO membrane, having an effective area of 140 cm2, with a spacer, was placed in the test unit (part no. 1142819, GE Osmonics). The experiment was performed in a 20 L feed tank with a 9 L feedwater volume. The feedwater was composed of micro filtered, sterilized seawater dosed with109 cells of a
2.4. Autopsy of Biofouled RO Membranes and SEM Observation for the Surface of RO Membrane
The RO membrane was retrieved from the test unit and cut into 10 cm × 1 cm sized-pieces. Each piece was then placed in a 15 mL conical tube containing 10 mL of distilled sterile water. To analyze the microbiological and organic compounds based on criteria, such as dry weight, organic matter, protein and carbohydrate contents, each rectangular piece of RO membrane was sonicated for 10-15 minutes using a bath-type sonicator, as the biofilm microorganisms adhering to the surface of membranes were not sufficiently detached by scraping and vigorous stirring only.
For scanning electron microscope (SEM) observation, the fouled regions of the RO membranes were carefully cut into very small pieces of less than 1 cm × 1 cm. The SEM observation required pretreatment of the membrane sections. The membrane samples were fixed with a 2% glutaraldehyde solution for 1 hour at 4℃, dried for 5 minutes at 35℃, and subsequently serially dehydrated for 3 minutes in 50, 80 and 96% EtOH solutions. After placing in a drying chamber overnight, the membrane samples were then coated with Pt for 35 s using ion sputtering (E-1030;Hitachi, Tokyo, Japan) prior to the SEM (S-4700; Hitachi) observation.
Note: the entire process of membrane autopsy and sampling was undertaken under aseptic conditions. All solutions were prepared with distilled water, autoclaved, and then filtered through a cellulose acetate membrane with a pore size of 0.2 ㎛.All storage receptacles and filtration membranes were sterile and disposable.
2.5. Measurements of Total Bacteria Count, Bacillus sp. Count and Viability
Direct measurements of total count and viability were carried out based on fluorescent staining. For the total count, 1 mg/mL 4‘-6-diamidino-2-phenylindole (DAPI) was applied to the biofilm extract sample for DNA staining, with the staining solution transferred to a 0.2 ㎛-pore sized black polycarbonate membrane for confocal laser scanning microscopy (CLSM)observation. Ten fluorescent images were randomly captured using a LSM5 (Zeiss, Oberkochen, Germany) inverted CLSM, linked to a PC, with LSM software (PASCAL, Oberkochen, Germany) used to control all the system components. A mercury lamp was used as the light source, and imaging was achieved using a C-Apochromat 40× objective. A quantitative analysis of the fluorescent signal on the image captured from a LSM confocal microscope was then conducted using image analyzer software (isolution/Lite, iMTechnology, Korea).
To determine the viability, a LIVE/DEAD BacLight staining kit (L-7012; Molecular Probes, USA) was used to enumerate the viable bacteria from the biofilm cells. The staining procedure followed the instructions provided by the manufacturer; application of the two different dyes resulted in green fluorescence, indicating viable cells, and red fluorescence for dead cells, due to SYTO 9 and PI, respectively. Finally, the viability (% of viable cells) was obtained using a flow cytometer (Cell Lab Quanta SC;Beckman Coulter, USA).
Spread plate counting was used to enumerate the viable
2.6. Measurements of EPS Proteins and EPS Hexose
The biofilms extracted from the 10 cm × 1 cm rectangular RO membrane pieces into 10 mL sterile water were stored in 15 mL conical tubes. Several of the conical tubes were then used to determine the dry weight, organic matter content and EPS hexose content [4]. Here, the EPS protein concentration was measured using a Micro BCA protein assay kit (Cat no. 23235; Thermo Scientific Pierce, USA), with EPS extract prepared from the biofilm extract [18].
2.7. Measurement of spoOA Gene Expressions by RT-PCR
DNA and RNA extractions from the biofilm cells were carried out, with the same volume of biofilm cells being used in each extraction. Genomic DNA was extracted using a phenol/chloroform extraction and ethanol precipitation method. The extracted DNA was then quantified using a spectrophotometer (Ultraspec 3100pro, Amersham Pharmacia Biotech, Sweden) at 260 nm. For RNA extraction, bead beating (0.1 mm zirconia/silica beads, Biospec Products, USA) was applied with 10% SDS for lysis of the biofilm cells. The cells were then lysed in a beadbeater for 60 seconds at 4,600 rpm, then centrifuged for 3 minutes at 12,000 rpm and 4℃. The supernatant was collected in a new sterile 2 mL tube, with RNAiso plus (Cat no. 9108; TaKaRa, Japan) then applied to isolate RNA according to the manufacturer’s protocols. Subsequently, reverse transcription (AccuPower RT PreMix; K-2041, Bioneer, Korea) was performed using 10 μL of the RNA extract to make cDNA; this cDNA was further used for a real-time reverse transcriptase (RT)-PCR assay in order to quantify the amount of the transcribed
RT-PCR was conducted and then analyzed using a Rotor-Gene 6000 system (Corbett Research, USA), with SYBR Green, a fluorescent double-stranded DNA (dsDNA)-intercalating dye. Two primers, forward: 5’- GGN RTN CCN GCN CAY ATH AAR GGN TA -3’) and reverse: 5’- CAT NGC DAT RAA YTC NSW RTT NGT NGG YTT -3’), were used to amplify the results by about 300 bps against the
To determine the specificities of the amplified products affected by nonspecific amplification and/or primer dimmer formation, a melting-point analysis was carried out after completion of the amplification; slow heating at 1℃ per step from 72-95℃ was performed, while continuously acquiring fluorescence data during the 5 s hold per step. A standard curve for the RT-PCR assay was created by serially diluting the standard plasmids(about 300 bps-
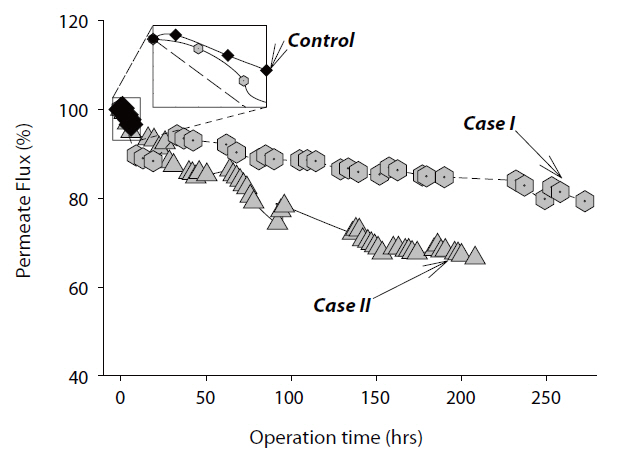
3.1. Permeate Flux Performance
The decline in the permeate flux was determined for both Cases I and II experiments. For Case I, the membrane test unit was cleaned with various detergents and chemical disinfectants before adding the
served in the control experiment, which contained no
3.2. Bacillus Biofilm Autopsy Formed on RO Membrane
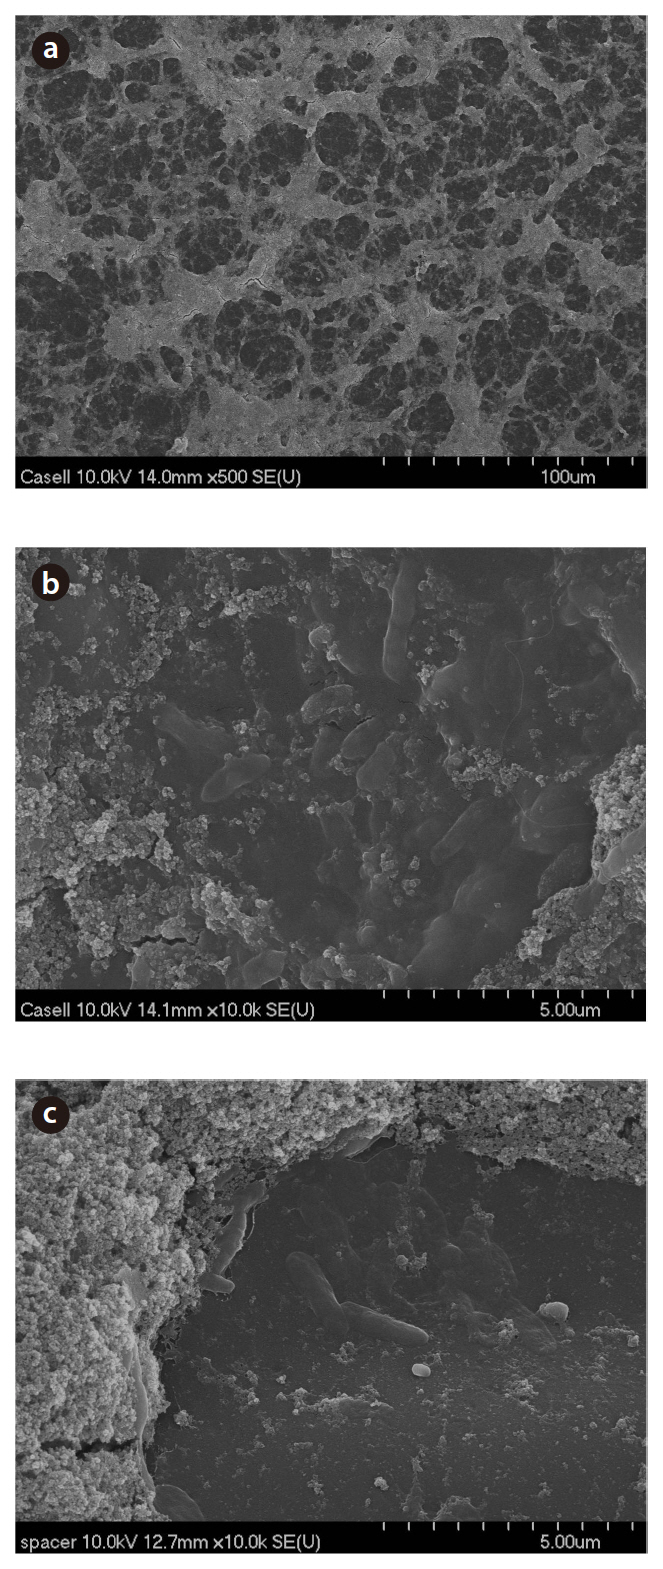
Fig. 2 presents the SEM images of the membrane surface morphology. The fouling of the membrane in Case II initially appears as in a web-like form at lower magnification (a), although a closer observation of the membrane surface revealed a large amount of bacteria embedded or grown beneath the inorganic aggregates (b). Bacteria attached to the spacer surface used in the assembly of the test unit were also observed (c). However, it was hard to capture the images of bacteria present in the biofilm for Case I (data not shown). The energy-dispersive X-ray (EDX) spectra of the biofilms in Cases I and II indicated the presence of Na (1.19%), Si (2.60%), S (0.91%), C (47.46%) and O (47.83%). The composition found from the EDX analysis was relatively constant, with less than 1% fluctuations.
3.3. Measurements of Total Count, Viability, Dry Weight,Organic Matters, EPS Protein and EPS Hexose
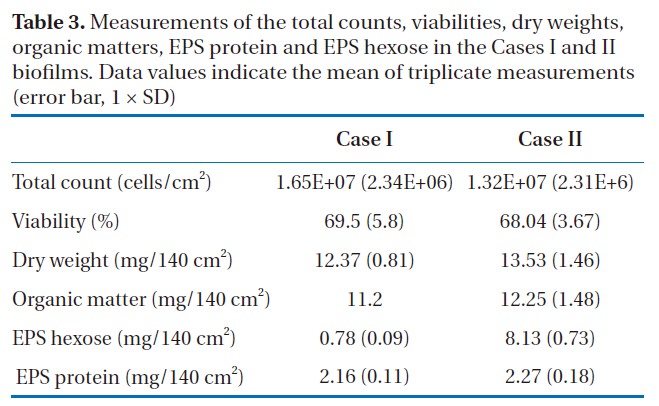
The direct fluorescence microscopic counts for enumeration of the total count included both live and dead cells. Based on the results shown in Table 3, the difference in the total counts between the two biofilms was not significant (p > 0.05). The viabilities of all the bacteria in the biofilm extracts from Cases I and II were determined using flow cytometry; the percentages of viable cells were about 70% in both biofilms, but there was no statistical difference (p > 0.05). From the results of the total counts and viabilities, it was determined that both the Cases I and II biofilms had similar amounts of biomass.
In both cases, dry weights of 12-13 mg per 140 cm2 of the RO membranes were measured, with the dry masses mainly composed of organic matter, at 11-12 mg per 140 cm2 (90.5-90.6%). EPS protein and EPS hexose measurements were then carried out by extracting the EPS from each biofilm. Many of the bacterial EPS were found to possess 1, 3- or 1, 4- β-linked hexose residues[20] and the most common monosaccharides in the EPS were hexose D-glucose, D-galactose and D-mannose, with pentose, hexosamine and glucuronic acids, as well as hexose also found in the EPS from the biofilms. The phenol-sulfuric acid method was used to quantify the carbohydrates, which mainly estimates the concentration of hexose sugars because different sugars have different absorbencies. Thus, the term ‘EPS hexose’

Measurements of the total counts viabilities dry weightsorganic matters EPS protein and EPS hexose in the Cases I and II biofilms. Data values indicate the mean of triplicate measurements(error bar 1 × SD)
was used rather than EPS carbohydrate or EPS polysaccharide. For Case I, 17.5 and 6.3% EPS proteins and EPS hexose were observed;whereas, 16.7 and 60%, respectively, were found in Case II (Table 3). These results showed that although similar amounts of EPS protein were obtained in both cases (p > 0.05), the EPS hexose of the two biofilms showed statistically different values(
In typical biofilms, more than 50% of the total organic matters are composed of dried deposits, and the approximate 90% organic content indicated a severe case of biofouling. For example, organic matters have been reported to account for 30-55% of the dry mass [21], with the percentage of organic matters of up to 94% [22]. Our results showed similar dry weight, organic matter and total cell count values.
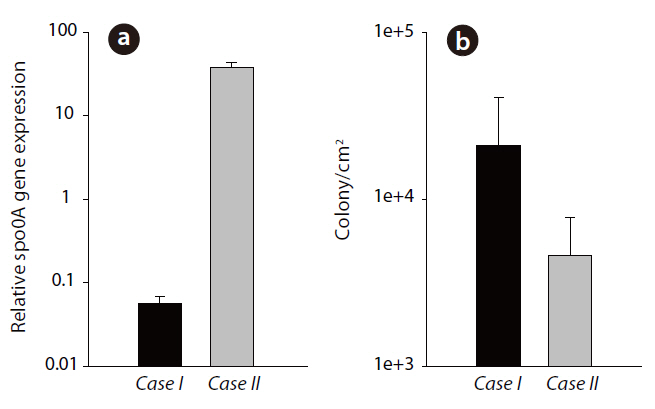
3.4. Measurement of spoOA Gene Expressions
In this study, an observation of the
The results in Fig. 3a show the relative
Selection of the
The expression of this gene is required for both sporulation and biofilm construction. It is also known that
In terms of the relationship between the bacterial mass of the biofilm and biofouling, the mass of an individual bacterium did not give rise to significant biofouling. For this reason, it has proved quite difficult to control biofouling by reducing the number of microorganisms in water due to the unclear link between microbial communities and the membrane [24]. However, the activation of genes of interest, which indicate a functional inclination to form the biofilm on an RO membrane, had a much more significant effect on biofouling. Studies to determine the gene expression patterns in bacterial biofilms have recently increased.For instance, biofilm genes essential in the initial step of adhesion may not be activated in biofilms formed later and in those with more complex structures [25]; also, EPS synthesisrelated genes increase during biofilm formation; whereas, pili or flagella-related genes decrease [17].
3.5. Bacillus and Other Culturable Bacteria in Case II Biofilm
When each biofilm extract was cultured on marine agar, a yellow colony, revealing
As a result of the 16S rRNA sequencing, with the exception of the Firmicute group containing
Biofouling measurements of two different
In Case II, more biofilm fouling was observed than in Case I due to the higher amount of EPS hexose and larger decline of the permeate flux in Case II. From the results, no significant differences were observed in the total counts, dry weights, total organic matters and amounts of EPS protein between the two biofilms.However, significant differences in the EPS hexose,
It was noted in this study that the extent of