The water supply service is used by all people living in a city as it is an important facility for maintaining everyday life and all other activities within urban areas. Today, 100 years after the first introduction of the water supply service, the rate of penetration of this service has almost approached 100% and; thus, is regarded as a basic requisite of urban life and the most fundamental service of the government for the people. In addition, it is expected that quantitative and qualitative demands for water will further increase as the future standard of living and economy are raised [1].
As the “Water Supply Facility Standards” of South Korea clearly state, the purpose of a water supply facility is to supply qualitatively safe and quantitatively sufficient water at a reasonable construction and maintenance expense. An impending task of the current water supply service is to distribute and supply the best quality and quantity of water to meet the customer’s needs. Therefore, the current and future water demands should be accurately estimated and predicted to meet these needs. Thus, the amount of water consumption should be accurately predicted as a prerequisite for the stable and efficient operation of a water supply service facility.
Since the on-set of water supply services, the conventional estimation and prediction of the amount of long-term water consumption has principally been carried out based on the average liter per capita day, which was not of major concern in the past when high-density urbanization and regional characteristics were not commonplace [2]. Currently; however, due to many changes, such as many urban redevelopments, diversification of regional characteristics and changes in housing, consumption and life patterns, the previous method for the estimation of water demand, based on the average liter per capita day of entire cities, can not fully account for regional characteristics, which leads to large errors in the actual amount of water consumption as well as the over- or under-design of the capacity of the water supply service facilities across regions, which makes the optimal operation and reasonable maintenance/management of the facility difficult, even after its construction [3].
Currently in Korea, only one single factor, population, is used in analyzing long-term water demands, which causes many problems. To solve these problems, there is a need for research on the various factors that may affect water consumption to assess other affecting factors, other than the population factor, for the purpose of diversification [4, 5].
Therefore, in this study, a comprehensive analysis on the amount of water consumption in nationwide urban areas, with the factors that can characterize the urban areas, was conducted using both principal component and cluster analyses, which are widely applied for the classification of regional characteristics. In addition, this study proposed a new equation for the prediction of water demand, which may be acceptable for the water consumption patterns for all regional characteristics across all urban area groups. This study also aimed to improve the previous predictive equation for use in the future basic modification plan for the water supply system and in the evaluation index of the water supply system.
The current study conducted a multiple regression analysis,where the factors affecting water consumption were used as the independent variables to account for the dependent variables from 164 nationwide local self-governing regions. Each independent variable was evaluated to determine which significantly affected water consumption. A comprehensive multiple regression model was developed and compared with the multiple regression model, which was developed after clustering of their goodness of fit using the observed values [6, 7].
However, the inter-independence of the selected factors could not be guaranteed. The data that were not inter-independent may cause erroneous results in the subsequent analysis,which; in turn, reduces the reliability of the subsequent analysis. Therefore, the data need to be made inter-independent; that is, a principal component analysis was performed [8].
One of the purposes in this study was to account for the regional characteristics in water demand estimations. Thus, a step for classifying the study target areas by their regional characteristics was required, i.e. a clustering analysis. Clustering analysis was conducted to classify the target areas into regional clusters that had similar impacts on the independent variables. The social and industrial factors were also taken into account in this clustering process [5].
After clustering the self-governing regions via this process, multiple regression models for each of the clustered self-governing regions were developed. By comparing these models with the comprehensive model, a model reflecting the social and industrial characteristics of each of the self-governing regions was developed.
2.1. Principal Component Analysis
A principal component analysis is a form of factor analysis, where the correlations between multiple variables are analyzed to account for the common underlying dimension across all factors. The purpose of a principal component analysis is to derive a comprehensive index, which combines multiple indices, and to divide the observation targets into a few groups in order to recognize the value of the data for a multiple regression analysis or discriminant analysis from different perspectives [1, 9].
Although a regression analysis assumes that the variables are independent of each other, the observed variables are not often completely independent, even though they are the variables affecting the dependent variable, since they usually do affect each other. In a principal component analysis, a new variable ensuring inter-independence, named a ‘principal component’, is derived using a linear combination of variables in order of the size of their accountability to the variance of the original variables. Therefore, there are no independent or dependent variables in a principal component analysis, with its primary purpose being to find a common foundation for the variables by analyzing their correlations.
Thus, this study used a principal component analysis to determine the principal components from the social and industrial factors, which were later used in the water demand estimation.
A clustering analysis refers to a grouping method where the objects of interest are classified into a few clusters in a way that the objects in same cluster are similar, while those in different clusters are dissimilar. A clustering analysis makes no assumption on the number of clusters and their structure, but forms the cluster based only on the similarity or distance between the objects. The major purpose of a clustering analysis is to identify the characteristics of the objects and the relationships among the clusters. In other words, a clustering analysis is a technique that can be used when there are no or unknown classification criteria. When P variables are measured with N of objects, a clustering analysis measures the similarity or dissimilarity between the N variables to connect the object based on their closer distance. Therefore, this study analyzed 164 self-governing regions, using a clustering analysis, to group the self-governing regions with similar water demand characteristics into the same cluster, with the estimation equation then calculated for the water demand [1, 9].
The present study was conducted using 164 self-governing regions in Korea. Although there have been many studies on the development of models for the estimation of the water demands in specific cities or regions, there have also been many difficulties associated with the studies on all regions in Korea, such as difficulty in choosing the factors affecting the amount of water consumption in an individual self-governing region and the limitation in the practical value using a comprehensive model for the estimation of the water demands, including accuracy problem.
Therefore, the present study extracted the water supply service-related information for 164 self-governing regions from the Water Supply Service Statistics (2006) to determine the influential independent variables and collect the statistics for social/industrial factors via a DB search from Statistics Korea.
The amount of water consumption in urban areas is a direct index representing changes in the demand for water use, which tends to be parallel with the population size, but is largely influenced by the characteristics and location of the city, living standard, life style and socioeconomic conditions. Therefore, this study aimed to examine the relationship between the level of water consumption and the social/industrial factors, which may reflect the regional characteristics as well as the direct affecting factors, such as population and water supply service [10].
The social factors included the water-supply population and the size of the administrative area (1,000 persons/km2) as the density index for water demand, as well as the number of independent houses/total households, and the number of apartment households/total households as the index of the amount of water consumption across housing types. In addition, this study adopted the ratio of beneficiaries for National Basic Liveli hood to investigate the correlation between the standard of living and the level of water consumption.
The industrial factors included the number of businesses/the unit administrative area (No./km2), the number of factories/the unit administrative area (No./km2), the number of employees in the industrial sector/the residential population of the area per total population (person/person) as the index for the impact of the number of businesses and factories on the level of water consumption, as well as the degree of financial independence(%) as the index of financial ability related to urban development.
3.1. Development of Comprehensive Multiple Regression Model
To determine which factors will affect water consumption among the social and industrial factors anticipated to do so, this study used a multiple regression model to investigate the correlation between the level of water consumption and the affecting factors.
The R2 value (coefficient of determination) from a multiple regression equation is used to explain the correlation between independent and dependent variables, which increases with the addition of new independent variables. Generally speaking, the accountability of a regression equation increases with increasing R2 value. However, it can be inefficient to add more independent variables only to slightly increase the R2 value. To address this problem, an adjusted R2 value is used, where the value of the adjusted-R2 decreases, but the R2 value increases slightly when a certain variable to be added has very little additional accountability. In this type of case, it is inappropriate to include the variable as an independent variable.
Therefore, this study also adopted adjusted R2 values in developing an appropriate multiple regression model for the independent variables.
In the multiple regression analysis, the dependent variable was the level of daily water consumption of each self-governing region, while the independent variables were the 6 factors, with the exceptions of the proportion of apartment households and number of businesses in a unit area, which were excluded to solve the multicollinearity problem.

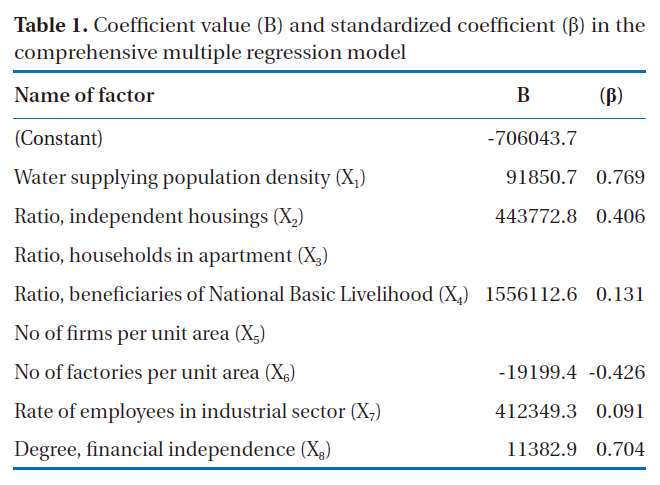
Coefficient value (B) and standardized coefficient (β) in the comprehensive multiple regression model
The results from the multiple regression analysis gave an adjusted R2 of 0.59, which was slightly lowered than the R2 value of 0.605. However, the significance level was 0.000, indicating that this model was significant. The coefficients (B) and standardized coefficients (β) of the comprehensive multiple regression model are presented in Table 1.
Conversely, the R2calculated from the multiple regression model for the classification into administrative territory showed that the R2 values for special metropolitan cities and Jeju Special Self-Governing Province was 0.935, indicating that the observed and predicted values were a good fit. However, the R2 values for other cities and ‘Gun’ (similar to county) were 0.397 and 0.04, respectively, indicating that the comprehensive multiple regression model was not sufficient to represent the observed value.
To solve this problem, a new model for water consumption needs to be developed to reflect the social and industrial characteristics of the self-governing regions after their grouping together, rather than using the comprehensive multiple regression model for the water consumption for all 164 regions.
3.2.1. Analysis of Affecting Factors through Principal Component Analysis
The principal component analysis in this study used the 4 social factors and 4 industrial factors from the 164 self-governing
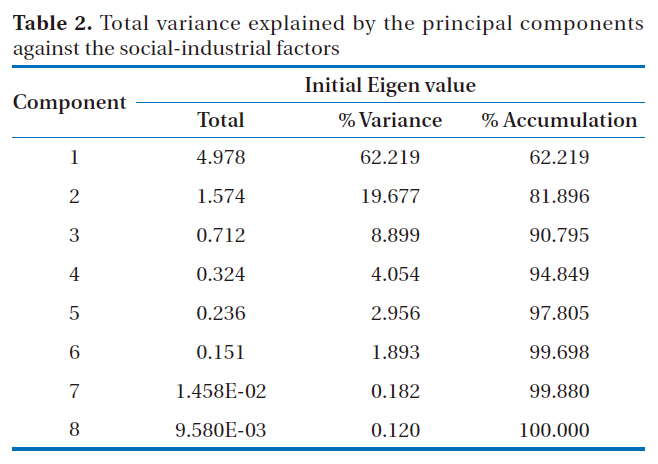
Total variance explained by the principal components against the social-industrial factors
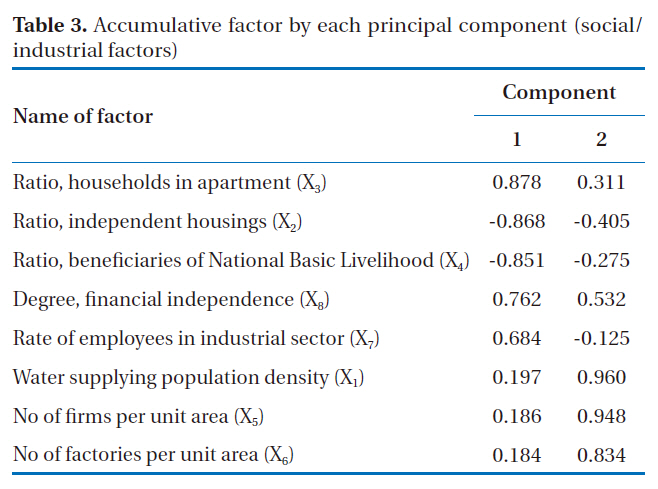
[Table 3.] Accumulative factor by each principal component (social/industrial factors)

Accumulative factor by each principal component (social/industrial factors)
[Table 4.] Status of local bodies by cluster according to the results of the clustering analysis
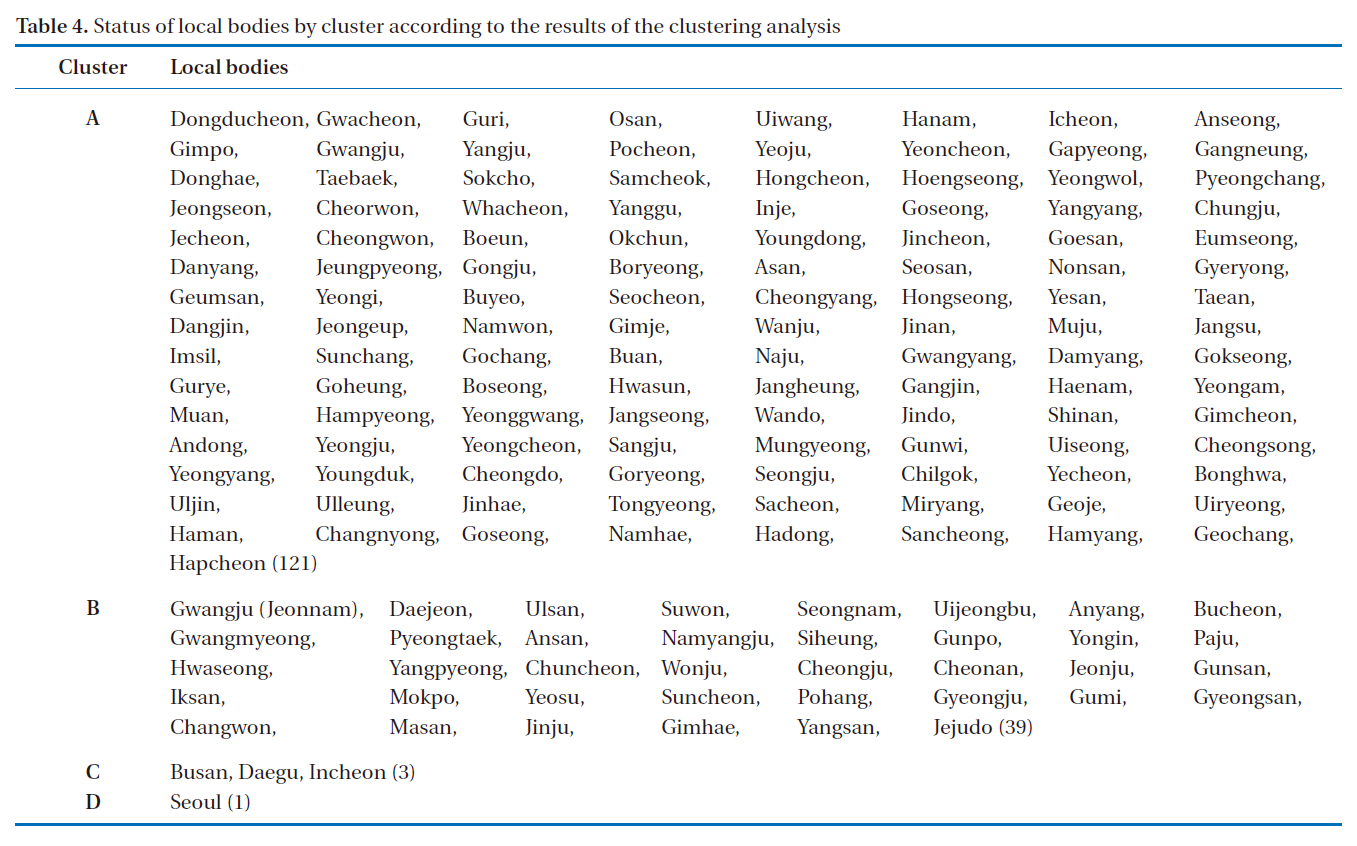
Status of local bodies by cluster according to the results of the clustering analysis
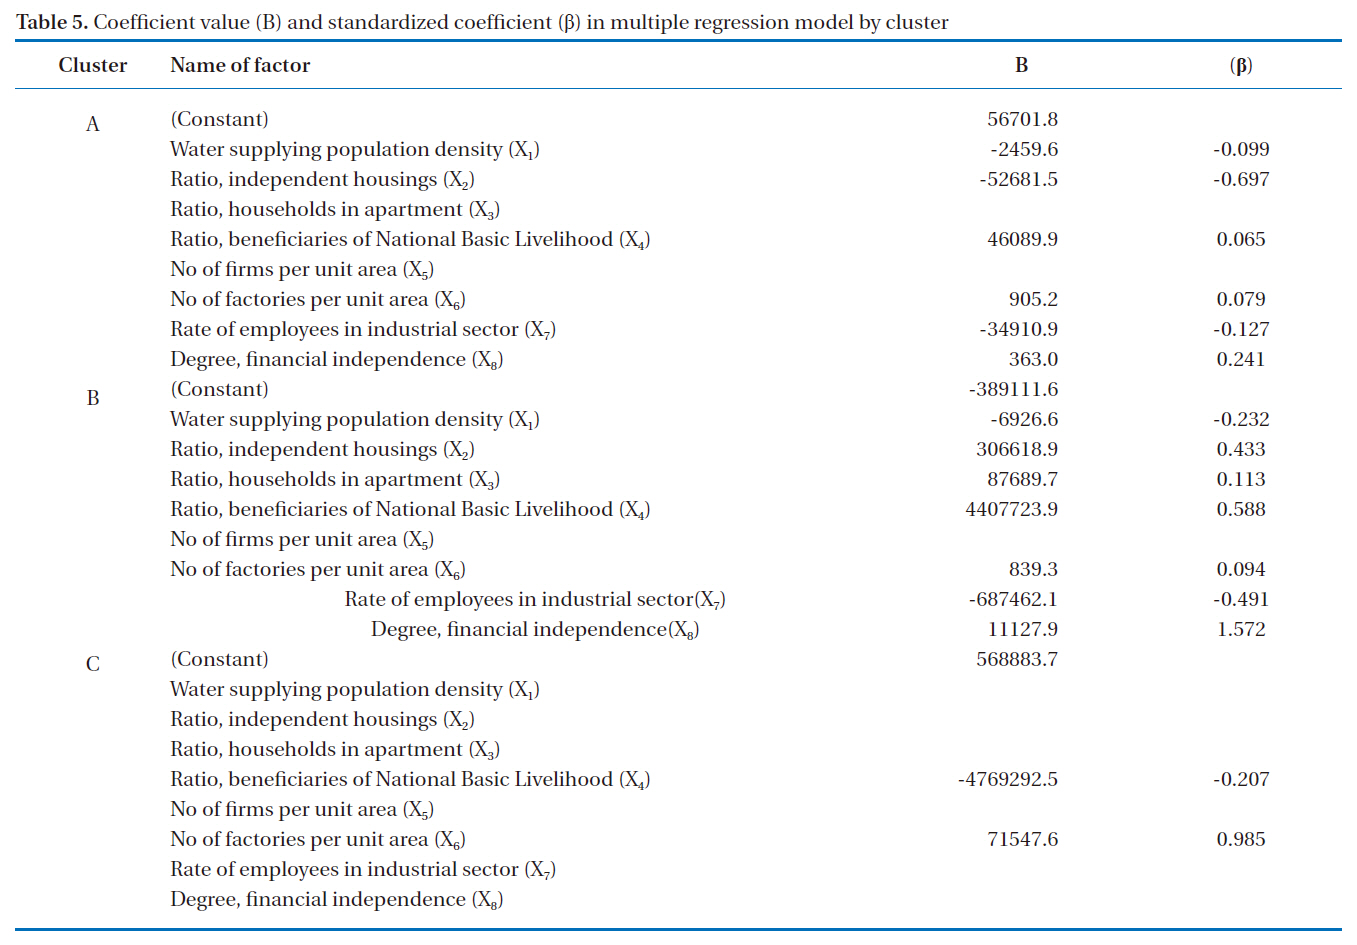
Coefficient value (B) and standardized coefficient (β) in multiple regression model by cluster
regions for 2006. As shown in Table 2, the 2 principal components of the socio-industrial factors from the principal component analysis accounted for 82% of the total variances.
As shown in Table 3, the first component showed an accumulation frequency in the order; highest to lowest: apartment ratio,independent housing ratio, ratio of beneficiaries for National Basic Livelihood and the number of industrial employees, while the second component showed that an accumulation frequency in the order: ratio of water-supply population density, the number of businesses in a unit area and the number of factories in a unit area.
3.2.2. Segmentation of Local Bodies through Clustering Analysis
Although the above comprehensive multiple regression model, based on the 6 independent variables, may predict the comprehensive water consumption pattern of the 164 self-governing regions, it was adjudged to have limitation in predicting the water consumption of the self-governing regions that have exceptional regional characteristics (e.g. rural areas or newly emerging industrial complex areas). Therefore, this study aimed to appropriately classify the 164 self-governing regions by representing their social and industrial status via the clustering analysis, and develop a multiple regression model for each cluster. The clustering was conducted around the 2 components derived from the prior principal component analysis, the results of which are shown in Table 4.
3.3. Development of Multiple Regression Model for Each Cluster Using Independent Variables
A multiple regression model for each cluster derived from the clustering analysis was developed to predict the level of water consumption after solving the multicollinearity problem. Unlike the previous comprehensive multiple regression model with the adjusted R2 0.59, the adjusted R2 of the multiple regression model for cluster A was increased to 0.62 after clustering, while that for cluster B was 0.74. For cluster C, which included only 3 self-governing regions; however, there might be a limitation because the multiple regression model was developed using the data from 2006 only. In addition, the model was developed with the exclusion of variables from the multiple regression analysis other than the ratio of beneficiaries for National Basic Liveli-

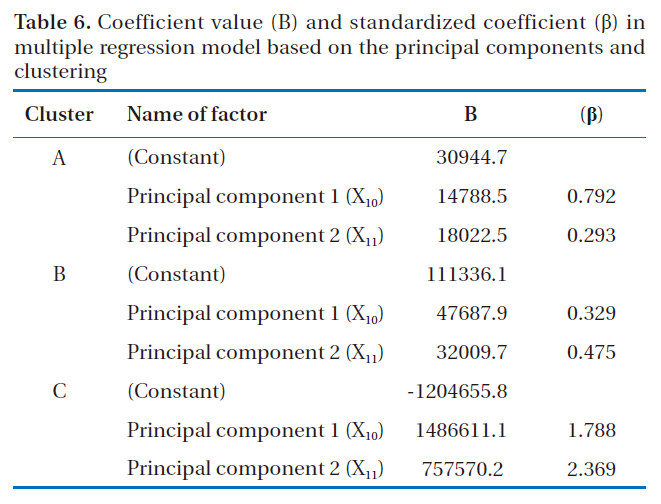
Coefficient value (B) and standardized coefficient (β) in multiple regression model based on the principal components and clustering
hood and the number of factories in a unit area. Furthermore, Seoul was classified into D cluster, which appeared markedly differentiated from other clusters in terms of the level of water consumption and social/industrial factors. Thus, a separate multiple regression model needs to be developed for cluster D only, using multi-year data to consider their time-serial characteristics.
Table 5 shows the coefficient value (B) and standardized coefficient(β) of the multiple regression model for each cluster.
3.4. Development of Multiple Regression Model for Each Cluster Using Principal Components
A multiple regression model was developed with the 2 variables derived from the principal component analysis. Table 6 shows the coefficient value (B) and standardized coefficient (β) of the multiple regression model for the principal component of each cluster. The adjusted R2 value for clusters A and B were 0.56 and 0.12, respectively.
3.5. Determination of Optimal Model for Predicting Water Demand
As described above, 3 multiple regression models were developed to predict the water demands in 164 self-governing regions; they were a comprehensive multiple regression model,a multiple regression model for each cluster and a multiple regression model based on principal components and clustering. To solve the multicollinearity problem, the models were constructed after eliminating the independent variables with high correlations with others.
Consequently, the clustering multiple regression model best predicted the observed value, and the multiple regression model based on principal components and clustering had a limitation in efficiently expressing the water consumption patterns for the 164 self-governing regions with only the 2 principal components.
This study aimed to diversify the factors affecting water consumption by taking into account the regional characteristics using a statistical approach employing principal component and clustering analyses for predicting water demands. A further aim was to develop a more effective water demand estimation model by supplementing with statistical objectivity. The study findings were as follows:
Although the correlations between the independent variables selected from the social and industrial factors for predicting the level of water consumption of the 164 self-governing regions were high, the correlations between the independent variable and the level of water consumption were low. Thus, due to the confounding regional characteristics, there was a need to group the regions to reflect the characteristics of the independent variables.
In addition, the results from the principal component analysis showed that a social factor, i.e. water supply population density,accounted for 76% of the total variance. As for the industrial factors, two factors, i.e. the number of businesses per unit area and the number of factories per unit area, accounted for 85% of the total variance, which allowed this study to test the importance of the determined independent variables via the standardized coefficients of the comprehensive multiple regression model.
The results from the clustering of the 164 self-governing regions via the clustering analysis showed that the clustering based on the level of water consumption better reflected the regional characteristics than the clustering based on the 8 independent variables, which enabled this study to derive significant clustering results. In addition, the correlation analysis between the level of water consumption and independent variables, which was conducted after clustering of the self-governing regions into 4, showed that the correlation coefficients increased more than those before clustering, which suggests that the clustering in this study increase the correlation between the level of water consumption and the independent variables.
This study generated 2 principal components from the principal component analysis of the social and industrial factors,and developed 3 multiple regression models after clustering of the 164 self-governing regions into 4 clusters via a clustering analysis; the comprehensive multiple regression mode, a clustering multiple regression model and a principal component/clustering multiple regression model. Of the 3 developed models, the clustering multiple regression model clustered around regional characteristics was the found to be the most appropriate. For regions C (Busan, Daegu and Incheon) and D (Seoul); however, there was a limitation in accurately identifying the extent of errors associated with the model because the multiple regression models for those 2 regions were developed based on the data for a single year (2006).
In conclusion, the developed models were adjudged to have sufficient validity in terms of their logical aspects. The developed models may be used as basic data for the planning of water supply facilities, as well as their maintenance, by estimating the level of water consumption. The models are also expected to have economical efficacy due to the saving of water resource and reduced construction and maintenance costs when used for the long-term planning and optimal operation of water supply systems, such as filtration plants, water reservoirs and water pipes/drainpipes/water service pipe. However, it is suggested that more accurate and extensive data should be acquired and further details of the factors affecting water demands taken into account to develop a more scientific and reasonable model for the estimation of water demands.